Interpretable model-free inference of parametric variation across time-series data through large-scale feature extraction
Pith reviewed 2026-06-27 05:23 UTC · model grok-4.3
The pith
A library of thousands of time-series features recovers the parameters driving variation in dynamical systems without fitting any model.
A machine-rendered reading of the paper's core claim, the machinery that carries it, and where it could break.
Core claim
The central claim is that an unsupervised, data-driven approach using a library of over 7000 time-series statistics often reconstructs the underlying parametric variation across collections of time series from linear stochastic processes, nonlinear oscillators, and chaotic dynamics, while also yielding interpretable estimators for each underlying dimension; the same procedure applied to movement dynamics of 1143 fruit flies extracts components corresponding to sex and circadian rhythmicity.
What carries the argument
A library of over 7000 diverse and interpretable time-series statistics that maps inter-instance variation into a feature space where low-dimensional parametric structure becomes visible and allows construction of estimators for the generative degrees of freedom.
If this is right
- The method reconstructs parametric variation across linear stochastic processes, nonlinear oscillators, and chaotic dynamics.
- Interpretable estimators are obtained for each underlying dimension of variation.
- The procedure identifies components in fruit-fly movement data that correspond to sex and circadian rhythmicity.
Where Pith is reading between the lines
- The same feature-based extraction could be tried on time-series collections from other domains where the source of variation is unknown.
- If the low-dimensional recovery holds, it would lessen the need to specify a model before inferring which parameters matter in a dataset.
- A direct next test would be to apply the procedure to experimental time series with controlled but higher-dimensional parameter changes.
Load-bearing premise
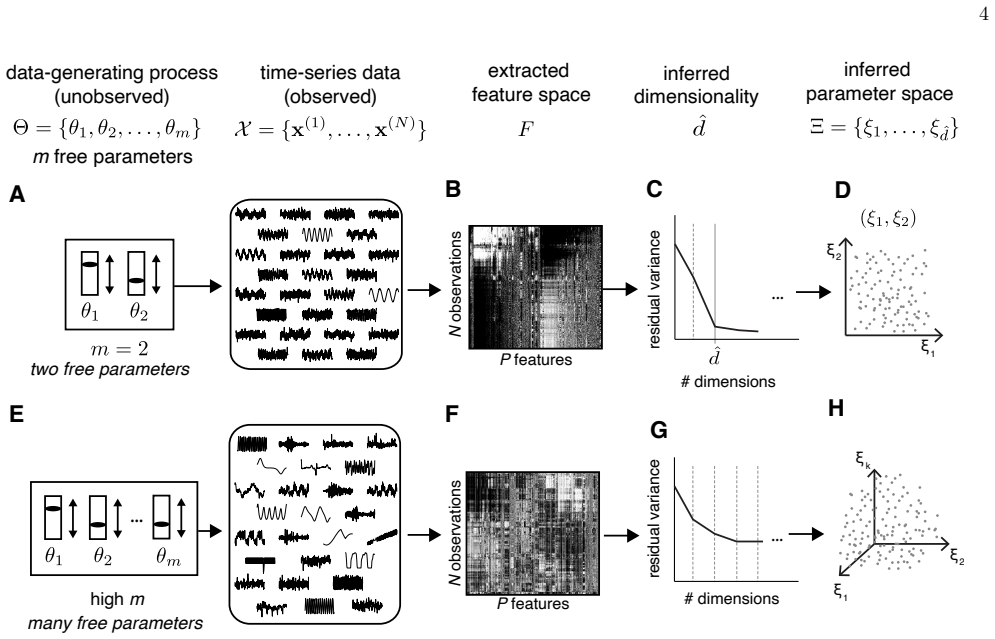
Low-dimensional parametric variation in the unknown generating process will appear as low-dimensional structure in the space of time-series features when a sufficiently large library of statistics is used.
What would settle it
If low-dimensional features extracted from time series of a system whose two controlling parameters are known do not align with those two parameters when checked against ground truth, the claim would be falsified.
Figures
read the original abstract
Here we address the problem of estimating the dimensionality and nature of parametric variation in an unknown generative process directly from time-series data, without specifying or fitting a model. In particular we suppose that inter-instance variation in collections of time series is caused by parametric variation in the generating model. We hypothesize that, given a sufficiently large library of time-series features, low-dimensional parametric variation will manifest as low-dimensional structure in feature space, enabling interpretable estimators of the underlying degrees of freedom to be constructed. We test our hypothesis using a library of over 7000 diverse and interpretable time-series statistics and thirteen simulated systems with known parametric variation, spanning linear stochastic processes, nonlinear oscillators, and chaotic dynamics. Our unsupervised, data-driven approach often reconstructs the underlying parametric variation across this extensive range of simulated dynamical systems while also yielding interpretable estimators for each underlying dimension. Applied to the movement dynamics of 1143 fruit flies, we use this method to extract biologically meaningful components corresponding to sex and circadian rhythmicity. Our results pave the way for much-needed data-driven methods to bridge the gap between interpretable theoretical understanding of dynamics and the large and complex datasets that characterize modern scientific problems.
Editorial analysis
A structured set of objections, weighed in public.
Referee Report
Summary. The manuscript proposes an unsupervised, data-driven pipeline that extracts over 7000 time-series features from collections of trajectories to recover the dimensionality and interpretable estimators of underlying parametric variation in an unknown generative process. The hypothesis is tested on thirteen simulated dynamical systems (linear stochastic, nonlinear oscillators, chaotic) with known ground-truth parameters and applied to movement time series from 1143 fruit flies, where recovered components align with independent labels for sex and circadian phase.
Significance. If the reconstructions prove robust, the method supplies a practical route to model-free discovery of low-dimensional parametric structure in high-dimensional time-series collections, with direct relevance to exploratory analysis in nonlinear dynamics and biological data.
major comments (2)
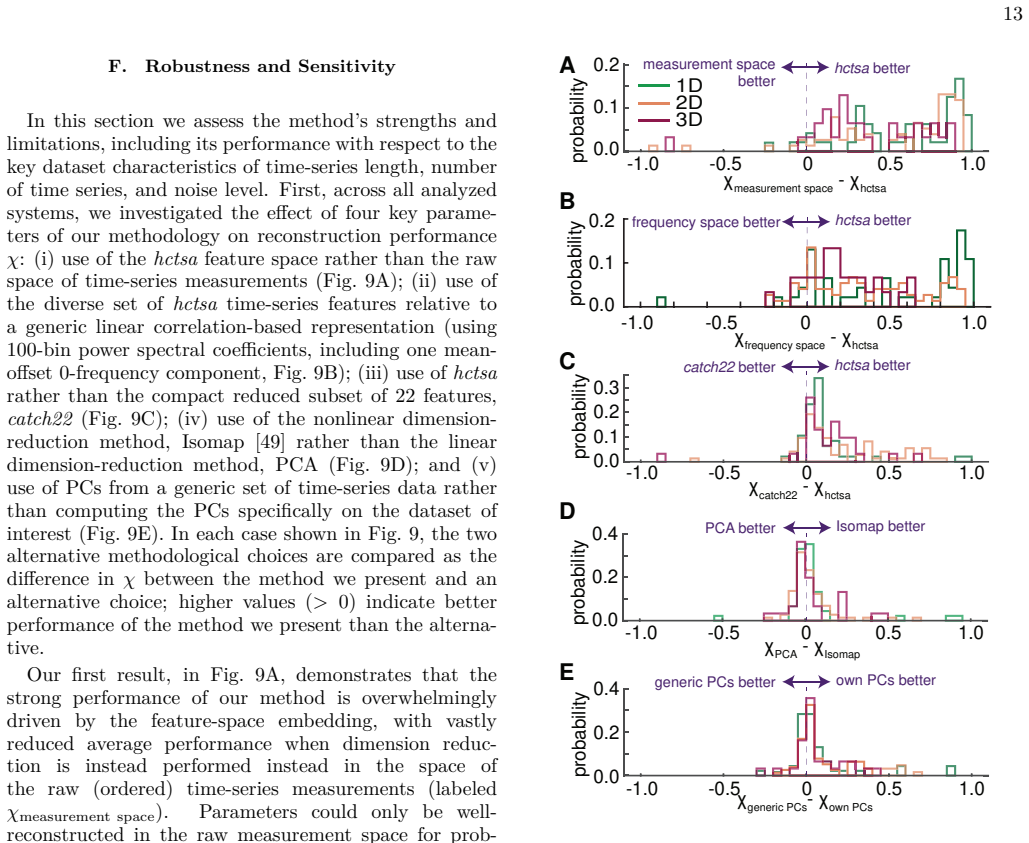
- [Abstract and §3] Abstract and §3 (simulated systems): the statement that the approach 'often reconstructs' the underlying parametric variation is not accompanied by quantitative success metrics (e.g., fraction of systems recovered within a stated tolerance, median reconstruction error, or comparison against null feature sets), which is load-bearing for the central claim of reliable recovery across linear, nonlinear, and chaotic regimes.
- [§4] §4 (feature extraction and dimensionality reduction): the pipeline description does not specify how redundancy among the 7000+ features is controlled before the low-dimensional embedding step, nor the exact criterion used to declare that a recovered component is an 'interpretable estimator' of a ground-truth parameter; both choices directly affect whether the low-dimensional structure in feature space is an artifact of the library rather than the parametric variation.
minor comments (2)
- Figure captions should explicitly state the number of trajectories per system and the precise embedding method (e.g., UMAP parameters or PCA variance threshold) used to visualize the recovered components.
- The real-data section would benefit from a quantitative comparison of the recovered components against the independent biological labels (e.g., classification accuracy or correlation coefficients) rather than qualitative alignment statements.
Simulated Author's Rebuttal
We thank the referee for their constructive review and recommendation for minor revision. We address each major comment below with clarifications and commitments to strengthen the manuscript.
read point-by-point responses
-
Referee: [Abstract and §3] Abstract and §3 (simulated systems): the statement that the approach 'often reconstructs' the underlying parametric variation is not accompanied by quantitative success metrics (e.g., fraction of systems recovered within a stated tolerance, median reconstruction error, or comparison against null feature sets), which is load-bearing for the central claim of reliable recovery across linear, nonlinear, and chaotic regimes.
Authors: We agree that quantitative metrics are needed to support the claim of reliable recovery. In the revised manuscript we will add a summary table in §3 reporting, for each of the 13 systems: (i) the Pearson correlation between each recovered component and its corresponding ground-truth parameter, (ii) the fraction of systems recovered to within a normalized tolerance of 0.1, (iii) median reconstruction error across systems, and (iv) the same quantities computed on null feature sets obtained by random permutation of feature values. These additions will make the performance across dynamical regimes explicit and allow direct comparison to chance levels. revision: yes
-
Referee: [§4] §4 (feature extraction and dimensionality reduction): the pipeline description does not specify how redundancy among the 7000+ features is controlled before the low-dimensional embedding step, nor the exact criterion used to declare that a recovered component is an 'interpretable estimator' of a ground-truth parameter; both choices directly affect whether the low-dimensional structure in feature space is an artifact of the library rather than the parametric variation.
Authors: We acknowledge that the original text leaves these choices implicit. In the revision we will expand the Methods subsection of §4 to state explicitly that (a) pairwise Pearson correlations are computed across all features and any pair with |r| > 0.9 is pruned by retaining only the feature with higher variance, and (b) a recovered component is declared an interpretable estimator of a ground-truth parameter when its absolute correlation with that parameter exceeds 0.7 and the component’s top-weighted features have clear dynamical interpretations (e.g., autocorrelation at the driving frequency). We will also add a short robustness check in the supplement showing that the recovered low-dimensional structure is stable under modest changes to the correlation threshold. revision: yes
Circularity Check
No significant circularity detected
full rationale
The paper advances an unsupervised, data-driven pipeline that extracts over 7000 time-series features and applies dimensionality reduction to recover known parametric variation in 13 simulated dynamical systems plus one real biological dataset. The central hypothesis—that low-dimensional parametric changes appear as recoverable structure in feature space—is tested directly by comparing recovered components against ground-truth parameters and independent biological labels, rather than being presupposed or derived from fitted quantities. No equations, self-citations, or ansatzes reduce the reported reconstructions to the inputs by construction; the method remains self-contained against external benchmarks.
Axiom & Free-Parameter Ledger
axioms (1)
- domain assumption Low-dimensional parametric variation in the generative process will appear as low-dimensional structure in the space of a sufficiently large and diverse library of time-series features.
Reference graph
Works this paper leans on
-
[1]
sloppy models
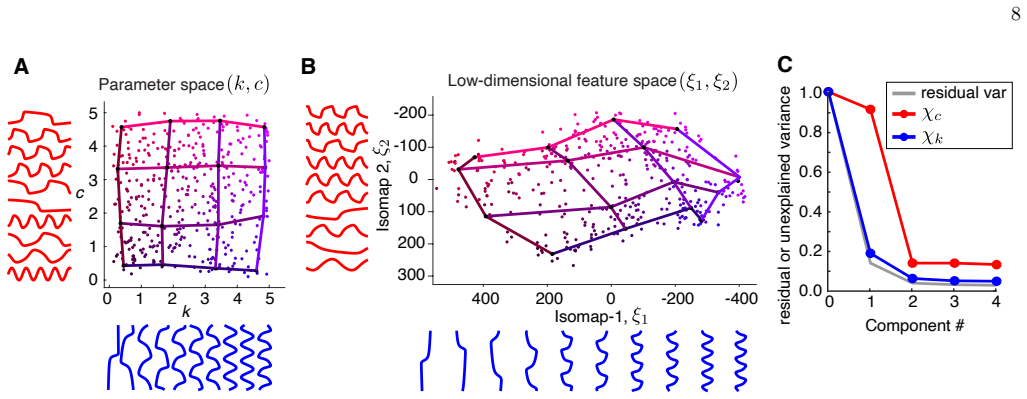
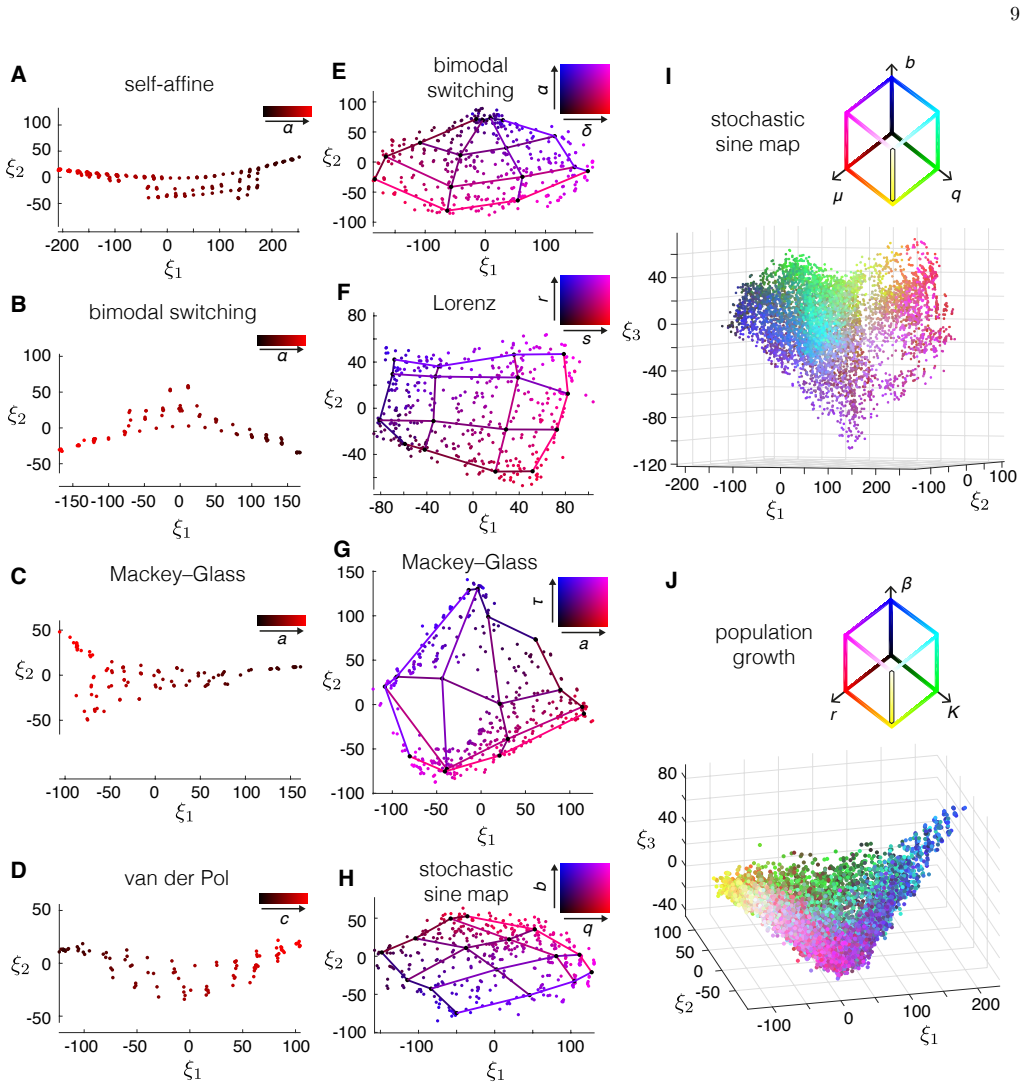
(Fig. 5D). In each case, ξ1 provides an estimate of the underlying free underlying parameter θ1. When two parameters vary independently, as in the X (2) datasets, the underlying two-dimensional parame- ter space is approximately reconstructed in the extracted embedding (as per the van der Pol oscillator studied in Sec. III B above). Examples are plotted f...
-
[2]
Systems was simulated using Mat- lab code from https://github.com/benfulcher/ TimeSeriesGeneration/ [79]
Time-Series Datasets This section describes details of each simu- lated system. Systems was simulated using Mat- lab code from https://github.com/benfulcher/ TimeSeriesGeneration/ [79]
-
[3]
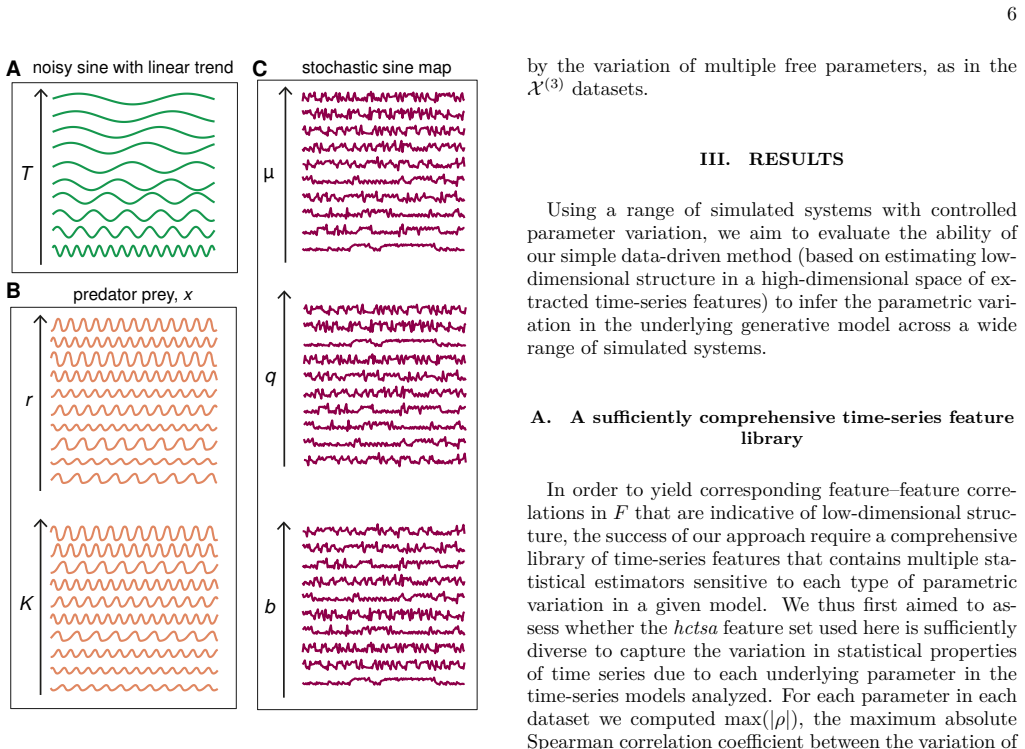
Noisy Trendy Sine This simple time-series system generates a sinusoid with period T , with a linear trend of gradient m and additive noise of standard deviation η
Stochastic Systems a. Noisy Trendy Sine This simple time-series system generates a sinusoid with period T , with a linear trend of gradient m and additive noise of standard deviation η. Time series, xt, are generated according to the following model: xt = sin(2πt/T ) + mt/N + ηnt , (A1) for a period T , gradient m, and noise standard deviation η, and nt ∼...
-
[4]
All flows were simulated in Matlab using the ordinary differential equa- tion solver ode45
Deterministic Flows Here we use the term ‘flow’ to describe a dynamical system formulated in continuous time. All flows were simulated in Matlab using the ordinary differential equa- tion solver ode45. Each system was then evaluated on an even time grid of an appropriate resolution for each sys- tem (listed below for each system). In all cases, the first ...
1976
-
[5]
Deterministic Maps Here we refer to a ‘map’ as a system with dynamics formulated as an iterative relationship in discrete time. a. Logistic Map The Logistic map is a simple one-dimensional map that can exhibit chaotic dynamics, and is indeed a paradig- matic example of the phenomenon [55, 66]. Dynamics are governed by: xt+1 = axt(1 − xt) , (A11) where a i...
-
[6]
Self-affine Time series with an power-law characteristic in the power spectrum with scaling exponent α
Other a. Self-affine Time series with an power-law characteristic in the power spectrum with scaling exponent α. The time se- ries are generated by an inverse Fourier transform (IFFT) from the desired power-law spectrum with random phase
-
[7]
19 Parameter Values α (-1, 3)
using Matlab. 19 Parameter Values α (-1, 3)
-
[45]
R. N. Gutenkunst, J. J. Waterfall, F. P. Casey, et al. Uni- versally sloppy parameter sensitivities in systems biology models. PLoS Computational Biology 3, e189 (2007). 20
2007
-
[48]
Hastie, R
T. Hastie, R. Tibshirani, J. H. Friedman, and J. H. Fried- man. The Elements of Statistical Learning: Data Mining, Inference, and Prediction , volume 2. Springer (2009)
2009
-
[49]
K. S. Owens and B. D. Fulcher. Time-series dimension reduction: A comprehensive review and conceptual uni- fication of algorithms (2025)
2025
-
[50]
F. Takens. Detecting strange attractors in turbulence. Lect. Notes Math. 898, 366 (1981)
1981
-
[51]
Kantz and T
H. Kantz and T. Schreiber. Nonlinear Time Series Analy- sis. Cambridge University Press, Cambridge, 2nd edition (2004)
2004
-
[52]
K. S. Owens and B. D. Fulcher. Parameter inference from a non-stationary unknown process. Chaos: An In- terdisciplinary Journal of Nonlinear Science 34, 101501 (2024)
2024
-
[53]
Güttler, H
S. Güttler, H. Kantz, and E. Olbrich. Reconstruction of the parameter spaces of dynamical systems. Physical Review E 63, 056215 (2001)
2001
-
[54]
B. D. Fulcher, M. A. Little, and N. S. Jones. Highly com- parative time-series analysis: The empirical structure of time series and their methods. Journal of The Royal So- ciety Interface 10, 20130048 (2013)
2013
-
[55]
B. D. Fulcher and N. S. Jones. Hctsa: A computational framework for automated time-series phenotyping using massive feature extraction. Cell Systems 5, 527 (2017)
2017
-
[56]
J. B. Tenenbaum, V. de Silva, and J. C. Langford. A global geometric framework for nonlinear dimensionality reduction. Science 290, 2319 (2000)
2000
-
[57]
Chatfield
C. Chatfield. The Analysis of Time Series . CRC Press LLC (2004)
2004
-
[58]
R. M. May. Limit cycles in predator-prey communities. Science 177, 900 (1972)
1972
-
[59]
P. F. Verhulst. La loi d’accroissement de la population. Nouv. Mem. Acad. Roy. Soc. Belle-lettr. Bruxelles 18 (1845)
-
[60]
relaxation-oscillations
B. van der Pol. On “relaxation-oscillations” . Philosophi- cal Magazine and Journal of Science 2, 978 (1926)
1926
-
[61]
noise titration
U. S. Freitas, C. Letellier, and L. A. Aguirre. Failure in distinguishing colored noise from chaos using the “noise titration” technique. Physical Review E 79, 035201 (2009)
2009
-
[62]
R. M. May. Simple mathematical models with very com- plicated dynamics. Nature 261, 459 (1976)
1976
-
[63]
E. N. Lorenz. Deterministic nonperiodic flow. Journal of the atmospheric sciences 20, 130 (1963)
1963
-
[64]
O. E. Rössler. An equation for continuous chaos. Physics Letters A 57, 397 (1976)
1976
-
[65]
Mackey and L
MC. Mackey and L. Glass. Oscillation and chaos in phys- iological control systems. Science 197, 287 (1977)
1977
-
[66]
B. D. Malamud and D. L. Turcotte. Self-affine time series: I. generation and analyses. In Advances in Geophysics , volume 40, pp. 1–90. Elsevier (1999)
1999
-
[67]
Hoppensteadt
F. Hoppensteadt. Predator-prey model. Scholarpedia 1, 1563 (2006)
2006
-
[68]
C. H. Lubba, S. S. Sethi, P. Knaute, et al. catch22: CAnonical Time-series CHaracteristics. Data Mining and Knowledge Discovery pp. 1–32 (2019)
2019
-
[69]
B. D. Fulcher. Highly Comparative Time-Series Analysis . Ph.D. thesis, University of Oxford (2012)
2012
-
[70]
Glass, M
L. Glass, M. C. Mackey, and P. F. Zweifel. From Clocks to Chaos: The Rhythms of Life . Princeton University Press (1988)
1988
-
[71]
R. Levins. The effect of random variations of different types on population growth. Proceedings of the National Academy of Sciences of the United States of America 62, 1061 (1969)
1969
-
[72]
M. C. Mackey and L. Glass. Oscillation and chaos in physiological control systems. Science 197, 287 (1977)
1977
-
[73]
J. C. Sprott. Chaos and Time-Series Analysis . Oxford University Press, New York (2003)
2003
-
[74]
Geissmann, L
Q. Geissmann, L. G. Rodriguez, E. J. Beckwith, et al. Ethoscopes: An open platform for high-throughput ethomics. PLOS Biology 15, e2003026 (2017)
2017
-
[75]
Jones, J
H. Jones, J. A. Willis, L. C. Firth, C. N. Giachello, and G. F. Gilestro. A reductionist paradigm for high- throughput behavioural fingerprinting in Drosophila melanogaster. eLife 12, RP86695 (2023)
2023
-
[76]
Geissmann, E
Q. Geissmann, E. J. Beckwith, and G. F. Gile- stro. Raw ethoscope recordings — geissmann, beck- with & gilestro 2019 (sci. adv.) — data set 1 of 2 (20160404_overnight_dsd) (2026)
2019
-
[77]
Geissmann, E
Q. Geissmann, E. J. Beckwith, and G. F. Gilestro. Most sleep does not serve a vital function: Evidence from Drosophila melanogaster. Science Advances 5, eaau9253 (2019)
2019
-
[78]
B. D. Fulcher, C. H. Lubba, S. S. Sethi, and N. S. Jones. A self-organizing, living library of time-series data. Sci- entific Data 7, 213 (2020)
2020
-
[79]
Ashraf, F
M. Ashraf, F. Anowar, J. H. Setu, et al. A Survey on Di- mensionality Reduction Techniques for Time-Series Data 11, 42909 (2023)
2023
-
[80]
T. Toni, D. Welch, N. Strelkowa, A. Ipsen, and M. P. H. Stumpf. Approximate Bayesian computation scheme for parameter inference and model selection in dynamical systems. Journal of The Royal Society Interface 6, 187 (2009)
2009
-
[81]
M. A. Beaumont. Approximate Bayesian Computation in Evolution and Ecology. Annual Review of Ecology, Evolution, and Systematics 41, 379 (2010)
2010
-
[82]
S. A. Sisson, Y. Fan, and M. A. Beaumont. Overview of ABC. In Handbook of Approximate Bayesian Computa- tion. Chapman and Hall/CRC (2018)
2018
-
[83]
Fearnhead and D
P. Fearnhead and D. Prangle. Constructing summary statistics for approximate Bayesian computation: Semi- automatic approximate Bayesian computation. Journal of the Royal Statistical Society: Series B (Statistical Methodology) 74, 419 (2012)
2012
-
[84]
K. S. Brown and J. P. Sethna. Statistical mechanical ap- proaches to models with many poorly known parameters. Physical Review E 68, 021904 (2003)
2003
-
[85]
R. N. Gutenkunst, J. J. Waterfall, F. P. Casey, et al. Uni- versally sloppy parameter sensitivities in systems biology models. PLoS Computational Biology 3, e189 (2007)
2007
-
[86]
Fulcher and C
B. Fulcher and C. H. Lubba. benf- ulcher/timeseriesgeneration: v0.1 (2020)
2020
-
[87]
C. G. Fox. An inverse fourier transform algorithm for generating random signals of a specified spectral form. Computers and Geosciences 13, 369 (1987)
1987
discussion (0)
Sign in with ORCID, Apple, or X to comment. Anyone can read and Pith papers without signing in.