SCAN: Enhance Time Series Anomaly Detection via Multi-Scale Neighborhood-Centered Clustering
Pith reviewed 2026-06-26 21:04 UTC · model grok-4.3
The pith
SCAN constrains reconstruction models to normal pattern cluster centers and combines membership probabilities with error for dual anomaly scoring in time series data.
A machine-rendered reading of the paper's core claim, the machinery that carries it, and where it could break.
Core claim
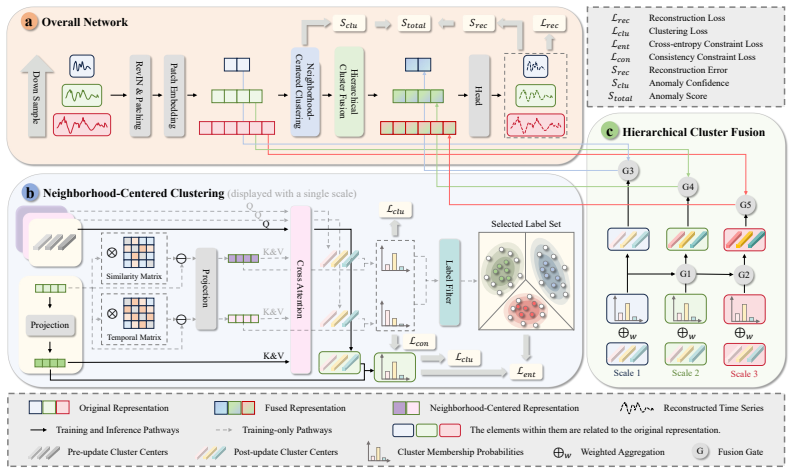
SCAN integrates cluster center representations of normal patterns to constrain the model to target representative normal patterns for reconstruction, preventing dominance of powerful capacity, and derives an anomaly confidence score from cluster membership probability combined with reconstruction error to provide dual criteria, with the clustering itself supported by neighborhood-centered representations for multi-view clustering.
What carries the argument
Neighborhood-centered representations for multi-view clustering, used to produce cluster centers that constrain reconstruction and membership probabilities that augment the anomaly score.
If this is right
- Reconstruction models are guided away from over-generalizing by targeting normal cluster centers.
- Anomaly decisions rest on both reconstruction error and cluster membership probability.
- Clustering quality directly determines how much the dual criteria improve detection.
- The approach yields state-of-the-art results across multiple real-world time series datasets.
Where Pith is reading between the lines
- The dual-criteria idea could apply to other reconstruction tasks if clustering can be made reliable.
- If neighborhood centering proves robust, similar clustering steps might simplify model design in related detection problems.
- Efficient implementations of the multi-view step would be needed before deployment on streaming data.
Load-bearing premise
Neighborhood-centered representations will produce clusters accurate enough that their centers and membership probabilities improve reconstruction targeting and anomaly scoring.
What would settle it
Running the method on a dataset where the multi-view clustering fails to separate normal patterns, resulting in detection performance no better than or worse than a plain reconstruction baseline.
Figures
read the original abstract
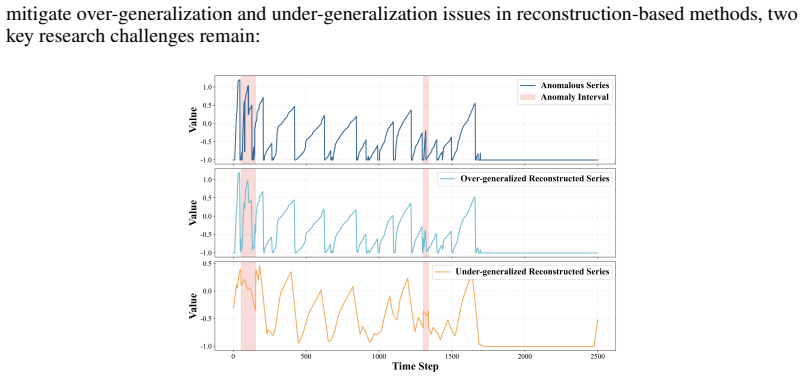
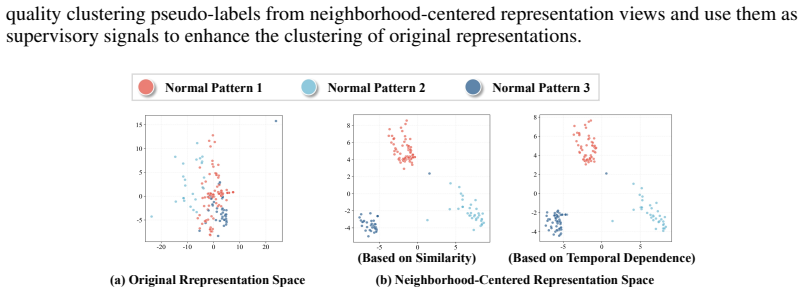
Time series anomaly detection plays a crucial role in a wide range of real-world applications. Reconstruction-based methods have become the mainstream paradigm, but they suffer from over-generalization and under-generalization problems, which are challenging to balance. To address this, we introduce multi-scale clustering to enhance reconstruction-based methods. At the representation level, we integrate the cluster center representations of normal patterns to constrain the model to target representative normal patterns for reconstruction, preventing dominance of powerful capacity and representation capability. At the anomaly criterion level, we derive anomaly confidence score based on cluster membership probability and combine it with reconstruction error, providing dual criteria for detection. Furthermore, the effectiveness of the cluster center representations and anomaly confidence score depends on the clustering performance. Accordingly, we extract neighborhood-centered representations for multi-view clustering to improve clustering performance. Extensive experiments on multiple real-world datasets from diverse application domains demonstrate the state-of-the-art performance of SCAN.
Editorial analysis
A structured set of objections, weighed in public.
Referee Report
Summary. The manuscript presents SCAN, a reconstruction-based time series anomaly detection method augmented by multi-scale neighborhood-centered clustering. Cluster-center representations of normal patterns are integrated to constrain the encoder-decoder toward representative normal reconstructions; an anomaly score is formed by combining reconstruction error with cluster-membership probability. Neighborhood-centered representations are introduced to improve multi-view clustering performance, on which both the constraint and the dual score are stated to depend. Experiments on multiple real-world datasets are reported to achieve state-of-the-art results.
Significance. If the neighborhood-centered clustering component reliably yields accurate clusters, the dual-criterion formulation could meaningfully mitigate the over- and under-generalization problems that plague pure reconstruction methods. The explicit use of cluster centers as a reconstruction target is a concrete, testable idea that, if validated, would constitute a useful addition to the anomaly-detection toolkit.
major comments (2)
- [Abstract] Abstract: the central claim that the method achieves state-of-the-art performance rests entirely on experimental outcomes, yet the abstract (and the supplied text) contains no equations, training details, dataset descriptions, or ablation results, rendering the outcomes uninspectable.
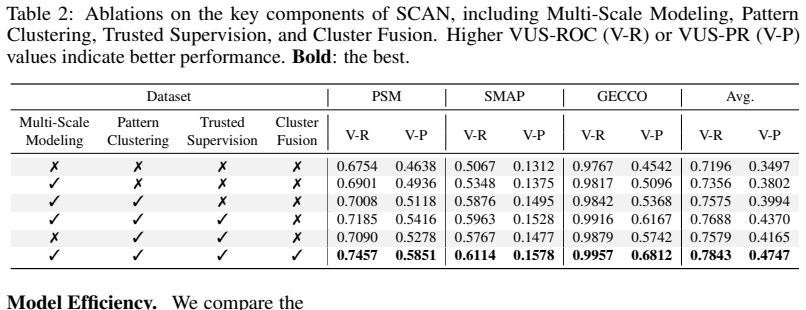
- [Abstract] Abstract: the paper states that effectiveness 'depends on the clustering performance' and therefore introduces neighborhood-centered representations, but supplies no cluster-quality metrics (silhouette, NMI, ARI, etc.) or ablation isolating the clustering component; without these the key assumption that the clusters are accurate enough to constrain reconstruction and supply a reliable second detection criterion remains untested.
Simulated Author's Rebuttal
We thank the referee for the constructive feedback. We address each major comment below and agree to make revisions where appropriate.
read point-by-point responses
-
Referee: [Abstract] Abstract: the central claim that the method achieves state-of-the-art performance rests entirely on experimental outcomes, yet the abstract (and the supplied text) contains no equations, training details, dataset descriptions, or ablation results, rendering the outcomes uninspectable.
Authors: Abstracts are intentionally concise and follow standard conventions by omitting detailed technical elements such as equations, hyperparameters, or dataset lists to remain within length limits. These specifics are provided in the main manuscript (model in Section 3, experimental protocol in Section 4, and results/ablation studies in Section 5). To enhance inspectability of the SOTA claim, we will revise the abstract to include a brief mention of the datasets and high-level experimental outcomes. revision: yes
-
Referee: [Abstract] Abstract: the paper states that effectiveness 'depends on the clustering performance' and therefore introduces neighborhood-centered representations, but supplies no cluster-quality metrics (silhouette, NMI, ARI, etc.) or ablation isolating the clustering component; without these the key assumption that the clusters are accurate enough to constrain reconstruction and supply a reliable second detection criterion remains untested.
Authors: We acknowledge that the abstract does not report cluster-quality metrics or an explicit ablation isolating the clustering component. While the manuscript demonstrates overall performance gains through comparative experiments, the referee's point about directly validating the clustering assumption is valid. We will add cluster-quality metrics (e.g., silhouette scores) and a dedicated ablation study on the neighborhood-centered clustering component to the revised manuscript. revision: yes
Circularity Check
No circularity: method relies on experimental validation rather than self-referential derivations.
full rationale
The paper presents SCAN as an enhancement to reconstruction-based anomaly detection by adding multi-scale clustering constraints and dual scoring. The abstract explicitly notes that cluster center and membership components depend on clustering quality and therefore proposes neighborhood-centered multi-view representations as an improvement. No equations, fitted parameters renamed as predictions, or self-citations appear in the supplied text. The central claims are supported by experiments on multiple real-world datasets rather than by any reduction of outputs to inputs by construction. This matches the default case of a self-contained empirical method paper.
Axiom & Free-Parameter Ledger
axioms (1)
- domain assumption Reconstruction-based methods suffer from over-generalization and under-generalization problems that clustering can address.
Reference graph
Works this paper leans on
-
[1]
Fedformer: Frequency enhanced decomposed transformer for long-term series forecasting,
T. Zhou, Z. Ma, Q. Wen, X. Wang, L. Sun, and R. Jin, “Fedformer: Frequency enhanced decomposed transformer for long-term series forecasting,” inProceedings of the International Conference on Machine Learning (ICML), pp. 27268–27286, 2022
2022
-
[2]
Pathformer: Multi-scale transformers with adaptive pathways for time series forecasting,
P. Chen, Y . ZHANG, Y . Cheng, Y . Shu, Y . Wang, Q. Wen, B. Yang, and C. Guo, “Pathformer: Multi-scale transformers with adaptive pathways for time series forecasting,” inProceedings of the International Conference on Learning Representations (ICLR), 2024
2024
-
[3]
Lightgts: A lightweight general time series forecasting model,
Y . Wang, Y . Qiu, P. Chen, Y . Shu, Z. Rao, L. Pan, B. Yang, and C. Guo, “Lightgts: A lightweight general time series forecasting model,” inProceedings of the International Conference on Machine Learning (ICML), 2025
2025
-
[4]
Autoformer: Decomposition transformers with Auto-Correlation for long-term series forecasting,
H. Wu, J. Xu, J. Wang, and M. Long, “Autoformer: Decomposition transformers with Auto-Correlation for long-term series forecasting,” inProceedings of the Annual Conference on Neural Information Processing Systems (NeurIPS), vol. 34, pp. 22419–22430, 2021
2021
-
[6]
Aimts: Augmented series and image contrastive learning for time series classification,
Y . Chen, S. Huang, Y . Cheng, P. Chen, Z. Rao, Y . Shu, B. Yang, L. Pan, and C. Guo, “Aimts: Augmented series and image contrastive learning for time series classification,” inProceedings of the International Conference on Data Engineering (ICDE), pp. 1952–1965, 2025
1952
-
[7]
Catch: Channel-aware multivariate time series anomaly detection via frequency patching,
X. Wu, X. Qiu, Z. Li, Y . Wang, J. Hu, C. Guo, H. Xiong, and B. Yang, “Catch: Channel-aware multivariate time series anomaly detection via frequency patching,” inProceedings of the International Conference on Learning Representations (ICLR), 2025
2025
-
[8]
Deep time series models: A comprehensive survey and benchmark,
Y . Wang, H. Wu, J. Dong, Y . Liu, C. Wang, M. Long, and J. Wang, “Deep time series models: A comprehensive survey and benchmark,”arXiv preprint arXiv:2407.13278, 2024
Pith/arXiv arXiv 2024
-
[9]
Tab: Unified benchmarking of time series anomaly detection methods,
X. Qiu, Z. Li, W. Qiu, S. Hu, L. Zhou, X. Wu, Z. Li, C. Guo, A. Zhou, Z. Sheng, J. Hu, C. S. Jensen, and B. Yang, “Tab: Unified benchmarking of time series anomaly detection methods,” inProceedings of the VLDB Endowment (VLDB), 2025
2025
-
[10]
Towards a general time series anomaly detector with adaptive bottlenecks and dual adversarial decoders,
Q. Shentu, B. Li, K. Zhao, Y . Shu, Z. Rao, L. Pan, B. Yang, and C. Guo, “Towards a general time series anomaly detector with adaptive bottlenecks and dual adversarial decoders,” inProceedings of the International Conference on Learning Representations (ICLR), 2025
2025
-
[11]
Crossad: Time series anomaly de- tection with cross-scale associations and cross-window modeling,
B. Li, Q. Shentu, Y . Shu, H. Zhang, M. Li, N. Jin, B. Yang, and C. Guo, “Crossad: Time series anomaly de- tection with cross-scale associations and cross-window modeling,” inProceedings of the Annual Conference on Neural Information Processing Systems (NeurIPS), 2025
2025
-
[12]
Momemto: Patch-based memory gate model in time series foundation model,
S. Yoon, J. Kim, J. Ha, and Y . M. Ko, “Momemto: Patch-based memory gate model in time series foundation model,”arXiv preprint arXiv:2509.18751, 2025
arXiv 2025
-
[13]
Duet: Dual clustering enhanced multivariate time series forecasting,
X. Qiu, X. Wu, Y . Lin, C. Guo, J. Hu, and B. Yang, “Duet: Dual clustering enhanced multivariate time series forecasting,” inProceedings of the ACM SIGKDD International Conference on Knowledge Discovery and Data Mining (SIGKDD), pp. 1185–1196, 2025
2025
-
[14]
Z. Tan, X. Luo, Y . Liu, and Y . Zhang, “Mask the redundancy: Evolving masking representation learning for multivariate time-series clustering,”arXiv preprint arXiv:2511.17008, 2025
arXiv 2025
-
[15]
A comparative study on unsupervised anomaly detection for time series: Experiments and analysis,
Y . Zhao, L. Deng, X. Chen, C. Guo, B. Yang, T. Kieu, F. Huang, T. B. Pedersen, K. Zheng, and C. S. Jensen, “A comparative study on unsupervised anomaly detection for time series: Experiments and analysis,”arXiv preprint arXiv:2209.04635, 2022
arXiv 2022
-
[16]
Lof: identifying density-based local outliers,
M. M. Breunig, H.-P. Kriegel, R. T. Ng, and J. Sander, “Lof: identifying density-based local outliers,” inProceedings of the ACM SIGMOD International Conference on Management of Data (SIGMOD), pp. 93–104, 2000
2000
-
[17]
Enhancing effectiveness of outlier detections for low density patterns,
J. Tang, Z. Chen, A. W.-C. Fu, and D. W. Cheung, “Enhancing effectiveness of outlier detections for low density patterns,” inProceedings of the Pacific-Asia Conference on Knowledge Discovery and Data Mining (PAKDD), pp. 535–548, 2002
2002
-
[18]
Support vector method for novelty detection,
B. Schölkopf, R. C. Williamson, A. Smola, J. Shawe-Taylor, and J. Platt, “Support vector method for novelty detection,” inProceedings of the Annual Conference on Neural Information Processing Systems (NeurIPS), vol. 12, 1999. 10
1999
-
[19]
Support vector data description,
D. M. J. Tax and R. P. W. Duin, “Support vector data description,”Machine Learning, vol. 54, no. 1, pp. 45–66, 2004
2004
-
[20]
Anomaly transformer: Time series anomaly detection with association discrepancy,
J. Xu, H. Wu, J. Wang, and M. Long, “Anomaly transformer: Time series anomaly detection with association discrepancy,” inProceedings of the International Conference on Learning Representations (ICLR), 2022
2022
-
[21]
Dcdetector: Dual attention contrastive representation learning for time series anomaly detection,
Y . Yang, C. Zhang, T. Zhou, Q. Wen, and L. Sun, “Dcdetector: Dual attention contrastive representation learning for time series anomaly detection,” inProceedings of the ACM SIGKDD International Conference on Knowledge Discovery and Data Mining (SIGKDD), pp. 3033–3045, 2023
2023
-
[22]
Detecting spacecraft anomalies using lstms and nonparametric dynamic thresholding,
K. Hundman, V . Constantinou, C. Laporte, I. Colwell, and T. Söderström, “Detecting spacecraft anomalies using lstms and nonparametric dynamic thresholding,” inProceedings of the ACM SIGKDD International Conference on Knowledge Discovery and Data Mining (SIGKDD), pp. 387–395, 2018
2018
-
[23]
Deepant: A deep learning approach for unsupervised anomaly detection in time series,
M. Munir, S. A. Siddiqui, A. Dengel, and S. Ahmed, “Deepant: A deep learning approach for unsupervised anomaly detection in time series,”IEEE Access, vol. 7, pp. 1991–2005, 2018
1991
-
[24]
Graph neural network-based anomaly detection in multivariate time series,
A. Deng and B. Hooi, “Graph neural network-based anomaly detection in multivariate time series,” in Proceedings of the AAAI Conference on Artificial Intelligence (AAAI), vol. 35, pp. 4027–4035, 2021
2021
-
[25]
Kan-ad: Time series anomaly detection with kolmogorov–arnold networks,
Q. Zhou, C. Pei, F. Sun, Z. Gao, H. Zhang, G. Xie, D. Pei,et al., “Kan-ad: Time series anomaly detection with kolmogorov–arnold networks,” inProceedings of the International Conference on Machine Learning (ICML), 2025
2025
-
[26]
Deep autoencoding gaussian mixture model for unsupervised anomaly detection,
B. Zong, Q. Song, M. R. Min, W. Cheng, C. Lumezanu, D. Cho, and H. Chen, “Deep autoencoding gaussian mixture model for unsupervised anomaly detection,” inProceedings of the International Conference on Learning Representations (ICLR), 2018
2018
-
[27]
Robust anomaly detection for multivariate time series through stochastic recurrent neural network,
Y . Su, Y . Zhao, C. Niu, R. Liu, W. Sun, and D. Pei, “Robust anomaly detection for multivariate time series through stochastic recurrent neural network,” inProceedings of the ACM SIGKDD International Conference on Knowledge Discovery and Data Mining (SIGKDD), pp. 2828–2837, 2019
2019
-
[28]
Beatgan: Anomalous rhythm detection using adversarially generated time series,
B. Zhou, S. Liu, B. Hooi, X. Cheng, and J. Ye, “Beatgan: Anomalous rhythm detection using adversarially generated time series,” inProceedings of the International Joint Conference on Artificial Intelligence (IJCAI), vol. 2019, pp. 4433–4439, 2019
2019
-
[29]
Usad: Unsupervised anomaly detection on multivariate time series,
J. Audibert, P. Michiardi, F. Guyard, S. Marti, and M. A. Zuluaga, “Usad: Unsupervised anomaly detection on multivariate time series,” inProceedings of the ACM SIGKDD International Conference on Knowledge Discovery and Data Mining (SIGKDD), pp. 3395–3404, 2020
2020
-
[30]
Multivariate time series anomaly detection and interpretation using hierarchical inter-metric and temporal embedding,
Z. Li, Y . Zhao, J. Han, Y . Su, R. Jiao, X. Wen, and D. Pei, “Multivariate time series anomaly detection and interpretation using hierarchical inter-metric and temporal embedding,” inProceedings of the ACM SIGKDD International Conference on Knowledge Discovery and Data Mining (SIGKDD), pp. 3220–3230, 2021
2021
-
[31]
Tranad: Deep transformer networks for anomaly detection in multivariate time series data,
S. Tuli, G. Casale, and N. R. Jennings, “Tranad: Deep transformer networks for anomaly detection in multivariate time series data,” inProceedings of the VLDB Endowment (VLDB), vol. 15, pp. 1201–1214, 2022
2022
-
[32]
Timesnet: Temporal 2d-variation modeling for general time series analysis,
H. Wu, T. Hu, Y . Liu, H. Zhou, J. Wang, and M. Long, “Timesnet: Temporal 2d-variation modeling for general time series analysis,” inProceedings of the International Conference on Learning Representations (ICLR), 2023
2023
-
[33]
Moderntcn: A modern pure convolution structure for general time series analysis,
D. Luo and X. Wang, “Moderntcn: A modern pure convolution structure for general time series analysis,” inProceedings of the International Conference on Learning Representations (ICLR), 2024
2024
-
[34]
Large memory layers with product keys,
G. Lample, A. Sablayrolles, M. Ranzato, L. Denoyer, and H. Jégou, “Large memory layers with product keys,”Proceedings of the Annual Conference on Neural Information Processing Systems (NeurIPS), vol. 32, pp. 8546–8557, 2019
2019
-
[35]
Retrieval-augmented generation for knowledge-intensive nlp tasks,
P. Lewis, E. Perez, A. Piktus, F. Petroni, V . Karpukhin, N. Goyal, H. Küttler, M. Lewis, W.-t. Yih, T. Rocktäschel,et al., “Retrieval-augmented generation for knowledge-intensive nlp tasks,”Proceedings of the Annual Conference on Neural Information Processing Systems (NeurIPS), vol. 33, pp. 9459–9474, 2020
2020
-
[36]
Augmenting language models with long-term memory,
W. Wang, L. Dong, H. Cheng, X. Liu, X. Yan, J. Gao, and F. Wei, “Augmenting language models with long-term memory,”Proceedings of the Annual Conference on Neural Information Processing Systems (NeurIPS), vol. 36, pp. 74530–74543, 2023. 11
2023
-
[37]
Mart: Memory-augmented recurrent transformer for coherent video paragraph captioning,
J. Lei, L. Wang, Y . Shen, D. Yu, T. Berg, and M. Bansal, “Mart: Memory-augmented recurrent transformer for coherent video paragraph captioning,” inProceedings of the Annual Meeting of the Association for Computational Linguistics (ACL), pp. 2603–2614, 2020
2020
-
[38]
Video object segmentation using space-time memory networks,
S. W. Oh, J.-Y . Lee, N. Xu, and S. J. Kim, “Video object segmentation using space-time memory networks,” inProceedings of the IEEE/CVF International Conference on Computer Vision (ICCV), pp. 9225–9234, 2019
2019
-
[39]
Model-based episodic memory induces dynamic hybrid controls,
H. Le, T. Karimpanal George, M. Abdolshah, T. Tran, and S. Venkatesh, “Model-based episodic memory induces dynamic hybrid controls,”Proceedings of the Annual Conference on Neural Information Processing Systems (NeurIPS), vol. 34, pp. 30313–30325, 2021
2021
-
[40]
Prototypical networks for few-shot learning,
J. Snell, K. Swersky, and R. Zemel, “Prototypical networks for few-shot learning,”Proceedings of the Annual Conference on Neural Information Processing Systems (NeurIPS), vol. 30, pp. 4077–4087, 2017
2017
-
[41]
A prototype-oriented frame- work for unsupervised domain adaptation,
K. Tanwisuth, X. Fan, H. Zheng, S. Zhang, H. Zhang, B. Chen, and M. Zhou, “A prototype-oriented frame- work for unsupervised domain adaptation,”Proceedings of the Annual Conference on Neural Information Processing Systems (NeurIPS), vol. 34, pp. 17194–17208, 2021
2021
-
[42]
Learning prototype-oriented set representations for meta-learning,
D. Guo, L. Tian, M. Zhang, M. Zhou, and H. Zha, “Learning prototype-oriented set representations for meta-learning,” inProceedings of the International Conference on Learning Representations (ICLR), 2022
2022
-
[43]
Dual memory units with uncertainty regulation for weakly supervised video anomaly detection,
H. Zhou, J. Yu, and W. Yang, “Dual memory units with uncertainty regulation for weakly supervised video anomaly detection,” inProceedings of the AAAI Conference on Artificial Intelligence (AAAI), vol. 37, pp. 3769–3777, 2023
2023
-
[44]
Anomaly detection with prototype-guided discriminative latent embeddings,
Y . Lai, Y . Han, and Y . Wang, “Anomaly detection with prototype-guided discriminative latent embeddings,” inProceedings of the IEEE International Conference on Data Mining (ICDM), pp. 300–309, 2021
2021
-
[45]
A hybrid prototype selection-based deep learning approach for anomaly detection in industrial machines,
R. de Paula Monteiro, M. C. Lozada, D. R. C. Mendieta, R. V . S. Loja, and C. J. A. Bastos Filho, “A hybrid prototype selection-based deep learning approach for anomaly detection in industrial machines,”Expert Systems with Applications, vol. 204, p. 117528, 2022
2022
-
[46]
Semi-supervised anomaly detection with dual prototypes autoencoder for industrial surface inspection,
J. Liu, K. Song, M. Feng, Y . Yan, Z. Tu, and L. Zhu, “Semi-supervised anomaly detection with dual prototypes autoencoder for industrial surface inspection,”Optics and Lasers in Engineering, vol. 136, p. 106324, 2021
2021
-
[47]
Memorizing normality to detect anomaly: Memory-augmented deep autoencoder for unsupervised anomaly detection,
D. Gong, L. Liu, V . Le, B. Saha, M. R. Mansour, S. Venkatesh, and A. v. d. Hengel, “Memorizing normality to detect anomaly: Memory-augmented deep autoencoder for unsupervised anomaly detection,” inProceedings of the IEEE/CVF International Conference on Computer Vision (ICCV), pp. 1705–1714, 2019
2019
-
[48]
Learning memory-guided normality for anomaly detection,
H. Park, J. Noh, and B. Ham, “Learning memory-guided normality for anomaly detection,” inProceedings of the IEEE/CVF Conference on Computer Vision and Pattern Recognition (CVPR), pp. 14360–14369, 2020
2020
-
[49]
Memto: Memory-guided transformer for multivariate time series anomaly detection,
J. Song, K. Kim, J. Oh, and S. Cho, “Memto: Memory-guided transformer for multivariate time series anomaly detection,”Proceedings of the Annual Conference on Neural Information Processing Systems (NeurIPS), vol. 36, pp. 57947–57963, 2023
2023
-
[50]
A time series is worth 64 words: Long-term forecasting with transformers,
Y . Nie, N. H. Nguyen, P. Sinthong, and J. Kalagnanam, “A time series is worth 64 words: Long-term forecasting with transformers,” inProceedings of the International Conference on Learning Representations (ICLR), 2023
2023
-
[51]
From similarity to superiority: Channel clustering for time series forecasting,
J. Chen, J. E. Lenssen, A. Feng, W. Hu, M. Fey, L. Tassiulas, J. Leskovec, and R. Ying, “From similarity to superiority: Channel clustering for time series forecasting,” inProceedings of the Annual Conference on Neural Information Processing Systems (NeurIPS), vol. 37, pp. 130635–130663, 2024
2024
-
[52]
Twin contrastive learning for online clustering,
Y . Li, M. Yang, D. Peng, T. Li, J. Huang, and X. Peng, “Twin contrastive learning for online clustering,” International Journal of Computer Vision, vol. 130, no. 9, pp. 2205–2221, 2022
2022
-
[53]
Anomaly detection in streams with extreme value theory,
A. Siffer, P.-A. Fouque, A. Termier, and C. Largouet, “Anomaly detection in streams with extreme value theory,” inProceedings of the ACM SIGKDD International Conference on Knowledge Discovery and Data Mining (SIGKDD), pp. 1067–1075, 2017
2017
-
[54]
Practical approach to asynchronous multivariate time series anomaly detection and localization,
A. Abdulaal, Z. Liu, and T. Lancewicki, “Practical approach to asynchronous multivariate time series anomaly detection and localization,” inProceedings of the ACM SIGKDD International Conference on Knowledge Discovery and Data Mining (SIGKDD), pp. 2485–2494, 2021. 12
2021
-
[55]
Swat: A water treatment testbed for research and training on ics security,
A. P. Mathur and N. O. Tippenhauer, “Swat: A water treatment testbed for research and training on ics security,” inProceedings of the International Workshop on Cyber-physical Systems for Smart Water Networks (CySWater), pp. 31–36, 2016
2016
-
[56]
Revisiting time series outlier detection: Definitions and benchmarks,
K.-H. Lai, D. Zha, J. Xu, Y . Zhao, G. Wang, and X. Hu, “Revisiting time series outlier detection: Definitions and benchmarks,” inProceedings of the Annual Conference on Neural Information Processing Systems Track on Datasets and Benchmarks (NeurIPS Track on Datasets and Benchmarks), 2021
2021
-
[57]
Current time series anomaly detection benchmarks are flawed and are creating the illusion of progress,
R. Wu and E. J. Keogh, “Current time series anomaly detection benchmarks are flawed and are creating the illusion of progress,”IEEE transactions on knowledge and data engineering (TKDE), vol. 35, no. 3, pp. 2421–2429, 2021
2021
-
[58]
A novel anomaly detection scheme based on principal component classifier,
M.-L. Shyu, S.-C. Chen, K. Sarinnapakorn, and L. Chang, “A novel anomaly detection scheme based on principal component classifier,” inProceedings of the IEEE International Conference on Data Mining (ICDM), 2003
2003
-
[59]
Histogram-based outlier score (hbos): A fast unsupervised anomaly detection algorithm,
M. Goldstein and A. Dengel, “Histogram-based outlier score (hbos): A fast unsupervised anomaly detection algorithm,” inKI-2012: Poster and Demo Track, pp. 59–63, 2012
2012
-
[60]
Isolation forest,
F. T. Liu, K. M. Ting, and Z.-H. Zhou, “Isolation forest,” inProceedings of the IEEE International Conference on Data Engineering (ICDE), pp. 413–422, 2008
2008
-
[61]
Loda: Lightweight on-line detector of anomalies,
T. Pevn`y, “Loda: Lightweight on-line detector of anomalies,”Machine Learning, vol. 102, no. 2, pp. 275– 304, 2016
2016
-
[62]
Anomaly detection using autoencoders with nonlinear dimensionality reduction,
M. Sakurada and T. Yairi, “Anomaly detection using autoencoders with nonlinear dimensionality reduction,” inProceedings of the MLSDA Workshop on Machine Learning for Sensory Data Analysis, p. 4–11, 2014
2014
-
[63]
Unsupervised time series outlier detection with diversity-driven convolutional ensembles,
D. Campos, T. Kieu, C. Guo, F. Huang, K. Zheng, B. Yang, and C. S. Jensen, “Unsupervised time series outlier detection with diversity-driven convolutional ensembles,” inProceedings of the VLDB Endowment (VLDB), vol. 15, pp. 611–623, 2021
2021
-
[64]
One fits all: Power general time series analysis by pretrained lm,
T. Zhou, P. Niu, L. Sun, R. Jin,et al., “One fits all: Power general time series analysis by pretrained lm,” inProceedings of the Annual Conference on Neural Information Processing Systems (NeurIPS), vol. 36, pp. 43322–43355, 2023
2023
-
[65]
Timemixer: Decomposable multiscale mixing for time series forecasting,
S. Wang, H. Wu, X. Shi, T. Hu, H. Luo, L. Ma, J. Y . Zhang, and J. ZHOU, “Timemixer: Decomposable multiscale mixing for time series forecasting,” inProceedings of the International Conference on Learning Representations (ICLR), 2024
2024
-
[66]
Multivariate time series anomaly detection by capturing coarse-grained intra-and inter-variate dependencies,
Y . Xie, H. Zhang, and M. A. Babar, “Multivariate time series anomaly detection by capturing coarse-grained intra-and inter-variate dependencies,” inProceedings of the ACM on Web Conference, pp. 697–705, 2025
2025
-
[67]
Local evaluation of time series anomaly detection algorithms,
A. Huet, J. M. Navarro, and D. Rossi, “Local evaluation of time series anomaly detection algorithms,” in Proceedings of the ACM SIGKDD International Conference on Knowledge Discovery and Data Mining (SIGKDD), pp. 635–645, 2022
2022
-
[68]
V olume under the surface: a new accuracy evaluation measure for time-series anomaly detection,
J. Paparrizos, P. Boniol, T. Palpanas, R. S. Tsay, A. Elmore, and M. J. Franklin, “V olume under the surface: a new accuracy evaluation measure for time-series anomaly detection,” inProceedings of the VLDB Endowment (VLDB), vol. 15, pp. 2774–2787, 2022
2022
-
[69]
Vus: effective and efficient accuracy measures for time-series anomaly detection,
P. Boniol, A. K. Krishna, M. Bruel, Q. Liu, M. Huang, T. Palpanas, R. S. Tsay, A. Elmore, M. J. Franklin, and J. Paparrizos, “Vus: effective and efficient accuracy measures for time-series anomaly detection,”The VLDB Journal, vol. 34, no. 3, p. 32, 2025
2025
-
[70]
Tfb: Towards comprehensive and fair benchmarking of time series forecasting methods,
X. Qiu, J. Hu, L. Zhou, X. Wu, J. Du, B. Zhang, C. Guo, A. Zhou, C. S. Jensen, Z. Sheng,et al., “Tfb: Towards comprehensive and fair benchmarking of time series forecasting methods,” inProceedings of the VLDB Endowment (VLDB), vol. 17, pp. 2363–2377, 2024
2024
-
[71]
Timer: Generative pre-trained transformers are large time series models,
Y . Liu, H. Zhang, C. Li, X. Huang, J. Wang, and M. Long, “Timer: Generative pre-trained transformers are large time series models,” inProceedings of the International Conference on Machine Learning (ICML), 2024. 13 A Analysis: Enhancement of Clustering Separability To analyze why neighborhood-centered representation can improve clustering, we model each ...
2024
-
[72]
SMD collects resource utilization information from the computer clusters owned by an Internet company
-
[73]
MSL, collected by NASA, contains telemetry data that reflects the operational conditions of sensors and actuators on the Martian rover
-
[74]
SMAP, collected by NASA, offers soil moisture data acquired through spacecraft monitoring systems
-
[75]
PSM is sourced from eBay’s server machines and records metrics associated with their operational performance
-
[76]
SWaT includes sensor data from a water treatment infrastructure that operates continuously
-
[77]
NeurIPS-TS is a dataset introduced by [56], and GECCO and SWAN are its sub-datasets, which cover a variety of anomaly scenarios
-
[78]
UCR consists of 250 sub-datasets, with each containing one-dimensional data that has a single anomaly segment. The statistical details of all the aforementioned datasets are summarized in Table 3. 14 Table 3: Statistics of the datasets. The anomaly ratio denotes the abnormal proportion of the entire dataset. Dataset Domain Dimension Training Validation Te...
discussion (0)
Sign in with ORCID, Apple, or X to comment. Anyone can read and Pith papers without signing in.