One country, multiple portraits: representativeness in GPS-based mobility data is source-specific and spatially dependent
Pith reviewed 2026-06-26 06:06 UTC · model grok-4.3
The pith
GPS mobility data coverage bias differs by source and follows spatial patterns across Mexican municipalities.
A machine-rendered reading of the paper's core claim, the machinery that carries it, and where it could break.
Core claim
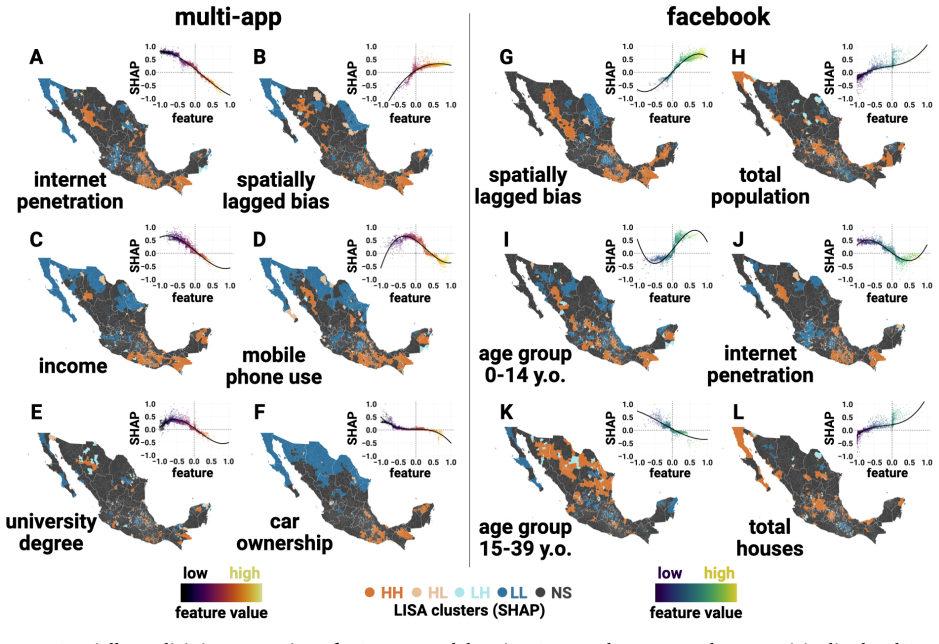
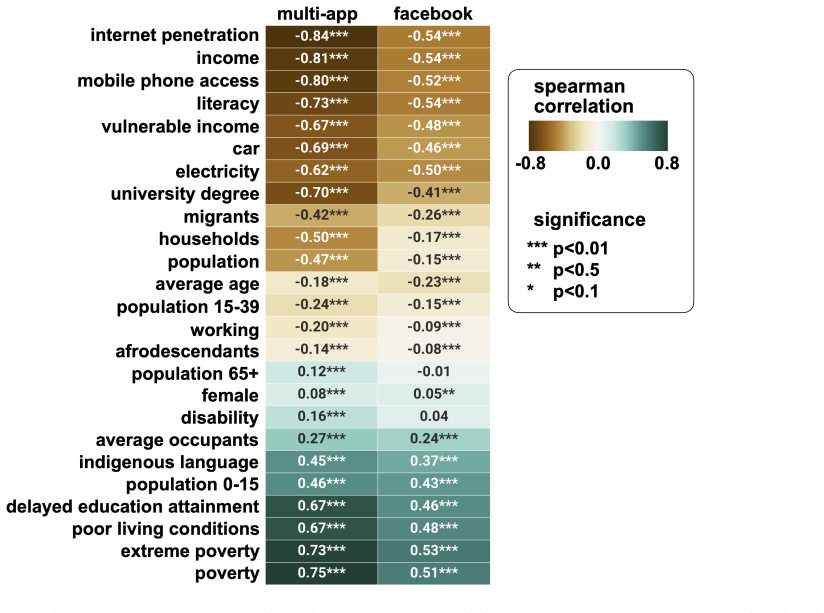
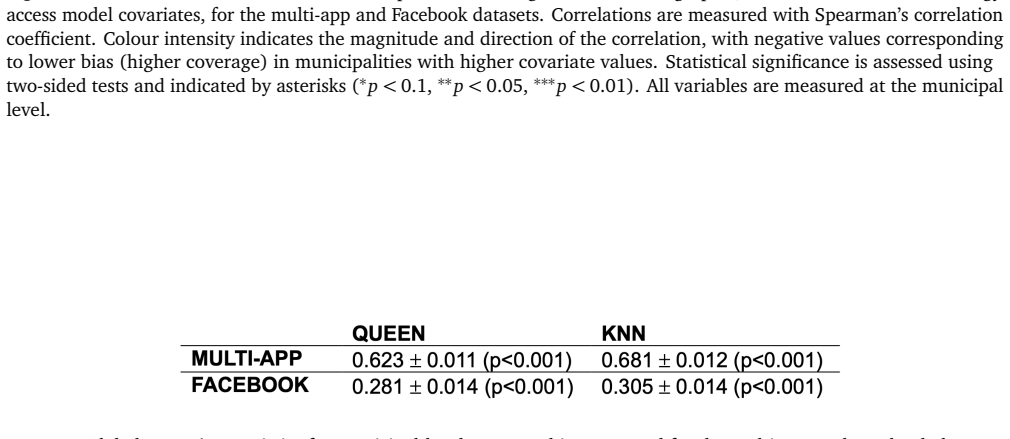
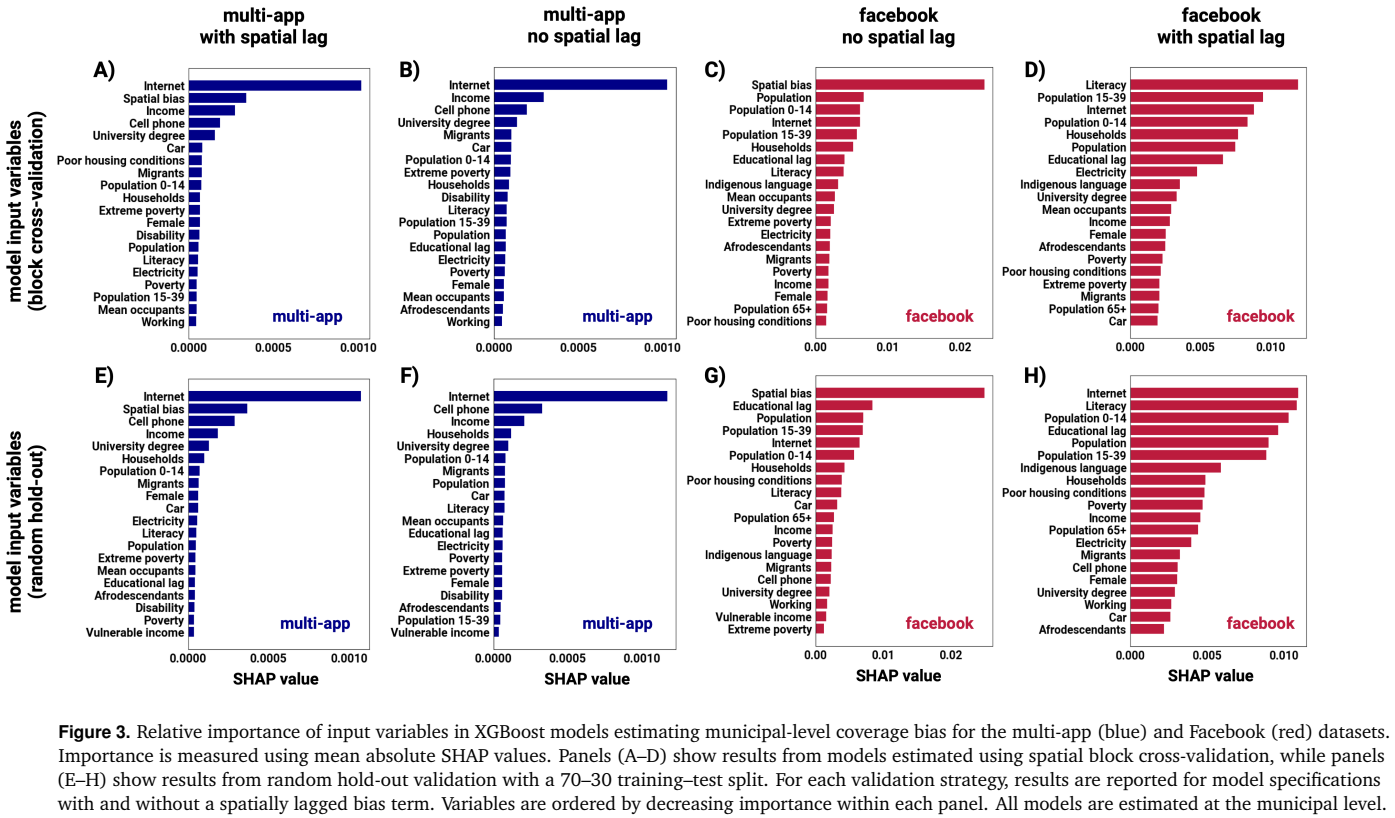
Coverage bias in GPS-based mobile phone data is source-specific and spatially dependent, with Facebook providing higher and more evenly distributed coverage while multi-app data concentrate users in larger, wealthier and more digitally connected places; neighbouring municipalities exhibit similar bias levels, and digital access drives bias for multi-app data whereas demographics drive it for Facebook.
What carries the argument
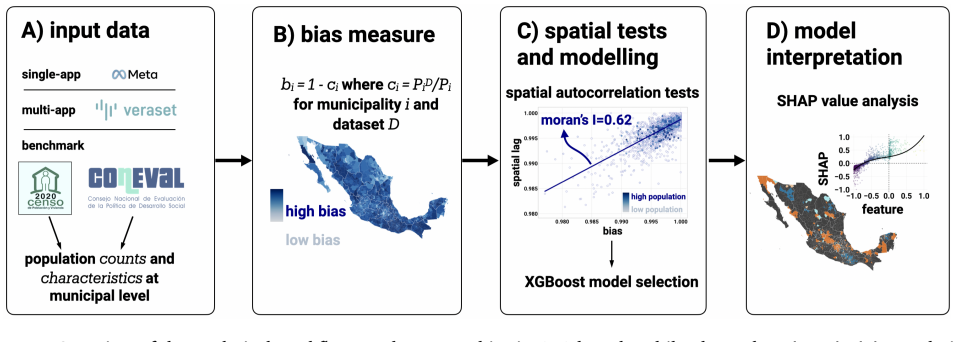
Direct comparison of source-derived population counts to the 2020 Mexican Census, followed by explainable machine learning for driver identification and spatial dependence modeling.
Load-bearing premise
The 2020 Mexican Population Census constitutes an unbiased and complete ground truth for measuring coverage bias in the mobile phone datasets.
What would settle it
Observing identical magnitude and spatial distribution of coverage bias across the two sources, or finding that spatial dependence vanishes once observed covariates are controlled, would falsify the source-specific and spatially structured claims.
Figures
read the original abstract
Anonymised GPS-based mobile phone data are increasingly used to estimate population distribution and human mobility, supporting applications across disaster response, public health, urban planning and migration research. Yet whether these data fairly represent the populations they describe, particularly outside high-income countries, remains poorly understood. We quantify coverage bias for 2,478 municipalities in Mexico by comparing population estimates from a single-platform source (Facebook) and a multi-app aggregator (Veraset) against the 2020 Mexican Population Census. We find that the magnitude and spatial distribution of coverage bias differ substantially across sources. Facebook provides higher and more evenly distributed coverage, whereas the multi-app data concentrate users in larger, wealthier and more digitally connected places. Coverage bias is also spatially structured, with neighbouring municipalities showing similar levels of over- or under-coverage. Using explainable machine learning, we show that digital access and material resources are the dominant drivers of bias for the multi-app data, while demographic and population structure dominate for Facebook. Explicitly modelling spatial dependence improves the performance of statistical models for explaining bias and reveals that an appreciable share of spatial variation remains unexplained by observed covariates. These findings show that coverage bias is source-specific and spatially dependent, and provide a foundation for adjustments that improve the representativeness of mobile phone data in unequal, data-scarce settings.
Editorial analysis
A structured set of objections, weighed in public.
Referee Report
Summary. The manuscript quantifies coverage bias in two GPS-based mobile phone datasets (Facebook single-platform and Veraset multi-app aggregator) for 2,478 Mexican municipalities by direct comparison to 2020 census population counts. It reports that bias magnitude and spatial distribution differ substantially by source, with Facebook showing higher and more uniform coverage while Veraset concentrates in larger, wealthier, digitally connected places. Bias exhibits spatial autocorrelation; explainable ML attributes drivers (digital access/resources for Veraset, demographics for Facebook); and explicit spatial modeling improves explanatory performance while leaving appreciable variation unexplained. The central claim is that coverage bias is source-specific and spatially dependent.
Significance. If the results hold after addressing ground-truth concerns, the work provides a useful empirical demonstration that representativeness of mobility data is not interchangeable across commercial sources and carries spatially structured patterns. Credit is due for the dual-source comparison, municipal-scale analysis, incorporation of spatial dependence in the explanatory models, and use of interpretable ML to separate drivers. These elements supply a concrete basis for source-aware adjustments in applications such as public health or disaster response in middle-income settings.
major comments (2)
- [Data and Methods] Data and Methods sections: All coverage-bias quantities (magnitude, spatial distribution, and ML driver attributions) are defined as deviations from the 2020 Mexican Population Census municipality totals. No sensitivity analysis, post-enumeration adjustment, or comparison to independent population estimates is described to address documented census undercounts in rural, low-income, or indigenous areas. This assumption is load-bearing for the reported source-specific differences and driver rankings.
- [Results] Results section on explainable ML and spatial models: The claim that 'explicitly modelling spatial dependence improves the performance of statistical models' and that 'an appreciable share of spatial variation remains unexplained' is central, yet the manuscript provides no table or text reporting the specific spatial specification (e.g., spatial lag, error, or CAR model), the quantitative improvement (ΔR², AIC, or Moran’s I reduction), or cross-validation details for the ML models. Without these, the improvement and residual-variation statements cannot be evaluated.
minor comments (1)
- [Abstract] Abstract and Methods: Sample sizes, exact coverage fractions per dataset, and the precise definition of the bias metric (e.g., ratio, difference, or log-ratio) are not stated, making it difficult to reproduce the reported percentages or spatial patterns.
Simulated Author's Rebuttal
We thank the referee for their constructive and detailed review. The comments highlight important issues regarding ground-truth assumptions and reporting of model details. We respond to each major comment below and will make targeted revisions to improve clarity and transparency while preserving the core findings on source-specific and spatially dependent coverage bias.
read point-by-point responses
-
Referee: [Data and Methods] Data and Methods sections: All coverage-bias quantities (magnitude, spatial distribution, and ML driver attributions) are defined as deviations from the 2020 Mexican Population Census municipality totals. No sensitivity analysis, post-enumeration adjustment, or comparison to independent population estimates is described to address documented census undercounts in rural, low-income, or indigenous areas. This assumption is load-bearing for the reported source-specific differences and driver rankings.
Authors: We agree this is a substantive concern. The 2020 Mexican Census is the official ground truth, but undercounts in rural, low-income, and indigenous municipalities are documented in the literature. We lack access to post-enumeration survey data or alternative population estimates for a formal sensitivity analysis. In revision we will add an explicit Limitations subsection in the Discussion that (i) cites studies on census accuracy in Mexico, (ii) discusses how differential undercount could affect the two data sources, and (iii) notes that the source-specific patterns we report should be interpreted with this caveat. This addresses the load-bearing nature of the assumption without overstating what the data allow. revision: yes
-
Referee: [Results] Results section on explainable ML and spatial models: The claim that 'explicitly modelling spatial dependence improves the performance of statistical models' and that 'an appreciable share of spatial variation remains unexplained' is central, yet the manuscript provides no table or text reporting the specific spatial specification (e.g., spatial lag, error, or CAR model), the quantitative improvement (ΔR², AIC, or Moran’s I reduction), or cross-validation details for the ML models. Without these, the improvement and residual-variation statements cannot be evaluated.
Authors: We accept that the quantitative details were insufficiently reported. The manuscript used a spatial error model; the revised version will add (i) the exact specification and estimation method, (ii) a table showing R², AIC, and Moran’s I before/after spatial terms, (iii) 5-fold cross-validation results for the explainable ML models, and (iv) the proportion of residual spatial variation left unexplained. These additions will make the performance claims directly verifiable. revision: yes
Circularity Check
Empirical comparison against external census benchmark with no reduction to fitted parameters or self-citations
full rationale
The paper quantifies coverage bias by direct comparison of Facebook and Veraset user counts to 2020 Mexican Population Census municipality totals, then applies explainable ML to attribute observed deviations to covariates such as digital access and demographics. No equations, model fits, or claims reduce by construction to the inputs (e.g., no parameter fitted on a subset then relabeled as a prediction of a related quantity). No load-bearing self-citations or uniqueness theorems are invoked. The derivation chain consists of standard statistical comparisons and feature-importance analysis against an external benchmark, remaining self-contained.
Axiom & Free-Parameter Ledger
axioms (1)
- domain assumption The 2020 Mexican Population Census provides an accurate and complete population benchmark.
Reference graph
Works this paper leans on
-
[1]
Green, M., Pollock, F . D. & Rowe, F .New Forms of Data and New Forms of Opportunities to Monitor and T ackle a Pandemic, 423–429 (Springer International Publishing, 2021)
2021
-
[2]
C., Hidalgo, C
Gonzalez, M. C., Hidalgo, C. A. & Barabasi, A.-L. Understanding individual human mobility patterns.nature453, 779–782 (2008)
2008
-
[3]
S., Greco, K., Sobolevsky , S
Kung, K. S., Greco, K., Sobolevsky , S. & Ratti, C. Exploring universal patterns in human home-work commuting from mobile phone data.PloS one9, e96180 (2014)
2014
-
[4]
& Jing, Y
Liu, Y., Fang, F . & Jing, Y. How urban land use influences commuting flows in wuhan, central china: A mobile phone signaling data perspective.Sustain. Cities Soc.53, 101914 (2020)
2020
-
[5]
& Neville, R
Rowe, F ., Cabrera-Arnau, C., González-Leonardo, M., Nasuto, A. & Neville, R. Medium-term changes in the patterns of internal population movements in Latin American countries: effects of the COVID-19 pandemic. InPopulation and Development series, No. 139 (LC/TS.2024/71) (Economic Commission for Latin America and the Caribbean (ECLAC), Santiago, 2024)
2024
-
[6]
& Blanchard, P
Gubert, F . & Blanchard, P . Temporary migration response to rainy season conditions in senegal: New evidence using mobile phone data (2024)
2024
-
[7]
& Rubrichi, S
Blanchard, P . & Rubrichi, S. A highly granular temporary migration dataset derived from mobile phone data in senegal. Sci. Data12, 1051 (2025)
2025
-
[8]
Using digital footprint data to monitor human mobility and support rapid humanitarian responses.Reg
Rowe, F . Using digital footprint data to monitor human mobility and support rapid humanitarian responses.Reg. Studies, Reg. Sci.9, 665–668 (2022)
2022
-
[9]
& Pietrostefani, E
Iradukunda, R., Rowe, F . & Pietrostefani, E. Estimating internal displacement in ukraine from high-frequency gps mobile phone data.Humanit. Soc. Sci. Commun.12, 1863 (2025). 12/15
2025
-
[10]
M., Spinelli, S
Rotondi, V ., Kashyap, R., Pesando, L. M., Spinelli, S. & Billari, F . C. Leveraging mobile phones to attain sustainable development.Proc. Natl. Acad. Sci.117, 13413–13420 (2020). 11.Rowe, F .et al.Methodological guide on the use of mobile phone data: Migration statistics introduction (2022)
2020
-
[11]
& Watts, D
Barreras, F . & Watts, D. The exciting potential and daunting challenge of using gps human-mobility data for epidemic modeling.Nat. Comput. Sci.4, 398–411 (2024). 13.Rowe, F .9.: Big data, 42 – 47 (Edward Elgar Publishing, Cheltenham, UK, 2023)
2024
-
[12]
Wesolowski, A., Eagle, N., Noor, A. M., Snow, R. W . & Buckee, C. O. The impact of biases in mobile phone ownership on estimates of human mobility .J. The Royal Soc. Interface10, 20120986, 10.1098/rsif.2012.0986 (2013). https://royalsocietypublishing.org/doi/pdf/10.1098/rsif.2012.0986
- [13]
-
[14]
& Pham, T
Suich, H., Yap, M. & Pham, T . Coverage bias: the impact of eligibility constraints on mobile phone-based sampling and data collection.Int. J. Soc. Res. Methodol.25, 849–860 (2022)
2022
-
[15]
O., Engø-Monsen, K
Wesolowski, A., Buckee, C. O., Engø-Monsen, K. & Metcalf, C. J. E. Connecting mobility to infectious diseases: the promise and limits of mobile phone data.The J. infectious diseases214, S414–S420 (2016)
2016
-
[16]
Lai, S.et al.Exploring the use of mobile phone data for national migration statistics.Palgrave communications5, 1–10 (2019)
2019
-
[17]
& De Domenico, M
Gallotti, R., Maniscalco, D., Barthelemy , M. & De Domenico, M. Distorted insights from human mobility data.Commun. Phys.7, 421 (2024)
2024
-
[18]
N., Benevenuto, F
Ribeiro, F . N., Benevenuto, F . & Zagheni, E. How biased is the population of facebook users? comparing the demographics of facebook users with census data to generate correction factors. InProceedings of the 12th ACM conference on web science, 325–334 (2020)
2020
-
[19]
& Zagheni, E
Gil-Clavel, S. & Zagheni, E. Demographic differentials in facebook usage around the world. InProceedings of the International AAAI Conference on Web and Social Media, vol. 13, 647–650 (2019)
2019
-
[20]
Zhao, Z.et al.Understanding the bias of call detail records in human mobility research.Int. J. Geogr. Inf. Sci.30, 1738–1762 (2016)
2016
-
[21]
& Viotti, L
Milusheva, S., Bjorkegren, D. & Viotti, L. Assessing bias in smartphone mobility estimates in low income countries. In Proceedings of the 4th ACM SIGCAS Conference on Computing and Sustainable Societies, 364–378 (2021)
2021
-
[22]
& Lessani, M
Li, Z., Ning, H., Jing, F . & Lessani, M. N. Understanding the bias of mobile location data across spatial scales and over time: a comprehensive analysis of safegraph data in the united states.Plos one19, e0294430 (2024)
2024
-
[23]
A., Gibbs, H., Yabe, T ., O’Brien, D
Sanchez, S. A., Gibbs, H., Yabe, T ., O’Brien, D. T . & Moro, E. Correcting temporal bias in mobility data using time-use surveys.arXiv preprint arXiv:2601.22330(2026)
arXiv 2026
-
[25]
Roberts, D. R.et al.Cross-validation strategies for data with temporal, spatial, hierarchical, or phylogenetic structure. Ecography40, 913–929, https://doi.org/10.1111/ecog.02881 (2017). https://nsojournals.onlinelibrary .wiley .com/ doi/pdf/10.1111/ecog.02881
-
[26]
Legendre, P . & Fortin, M. J. Spatial pattern and ecological analysis.Vegetatio80, 107–138, 10.1007/BF00048036 (1989)
-
[27]
Spinons and triplons in spatially anisotropic frustrated antiferromagnets
Bahn, V . & McGill, B. J. Testing the predictive performance of distribution models.Oikos122, 321–331, https: //doi.org/10.1111/j.1600-0706.2012.00299.x (2013). https://nsojournals.onlinelibrary.wiley.com/doi/pdf/10. 1111/j.1600-0706.2012.00299.x
work page internal anchor Pith review Pith/arXiv arXiv doi:10.1111/j.1600-0706.2012.00299.x 2012
-
[28]
Mahoney, M. J.et al.Assessing the performance of spatial cross-validation approaches for models of spatially structured data (2023). 2303.07334
arXiv 2023
-
[29]
den Nijs, K., Omodei, E. & Sekara, V . Data bias in human mobility is a universal phenomenon but is highly location- specific (2025). 2508.00149. 13/15
arXiv 2025
-
[30]
Sinclair, M.et al.Assessing the socio-demographic representativeness of mobile phone application data.Appl. Geogr. 158, 102997, https://doi.org/10.1016/j.apgeog.2023.102997 (2023)
-
[31]
& Zangerling, B.Mexico urbanization review: Managing spatial growth for productive and livable cities in Mexico (World Bank Publications, 2016)
Kim, Y. & Zangerling, B.Mexico urbanization review: Managing spatial growth for productive and livable cities in Mexico (World Bank Publications, 2016)
2016
-
[32]
& Mora-Rivera, J
Garcia-Mora, F . & Mora-Rivera, J. Exploring the impacts of internet access on poverty: A regional analysis of rural mexico.New media & society25, 26–49 (2023). 36.NapoleonCat. Mexico social media statistics (2026). Accessed January 2026
2023
-
[33]
Sitthiyot, T . & Holasut, K. A simple method for estimating the lorenz curve.Humanit. Soc. Sci. Commun.8, 268, 10.1057/s41599-021-00948-x (2021). 38.Rey , S. J., Arribas-Bel, D. & Wolf, L. J.Geographic Data Science with Python(Chapman and Hall/CRC, 2023), 1 edn
-
[34]
Busso, M. & Messina, J. The inequality crisis: Latin america and the caribbean at the crossroads, 10.18235/0002629 (2020)
-
[35]
& Mora-Rivera, J
Martínez-Domínguez, M. & Mora-Rivera, J. Internet adoption and usage patterns in rural mexico.T echnol. society60, 101226 (2020)
2020
-
[36]
& Martinez Dominguez, M
Díaz de León Castañeda, C. & Martinez Dominguez, M. Factors related to internet adoption and its use to seek health information in mexico.Heal. Commun.36, 1768–1775 (2021)
2021
-
[37]
Nonequilibrium work performed in quantum annealing
García-Mora, F ., Cavazos-Castro, M. & Mora-Rivera, J. Does mobile internet reduce social inequality? evidence from mexican villages.Inf. T echnol. for Dev.31, 1399–1424, 10.1080/02681102.2025.2488325 (2025). https: //doi.org/10.1080/02681102.2025.2488325
work page internal anchor Pith review Pith/arXiv arXiv doi:10.1080/02681102.2025.2488325 2025
-
[38]
& Cabrera, C
Renninger, A. & Cabrera, C. Extreme heat reduces and reshapes urban mobility .PNAS Nexus5, pgag078, 10.1093/ pnasnexus/pgag078 (2026). https://academic.oup.com/pnasnexus/article-pdf/5/4/pgag078/68031014/pgag078. pdf
2026
-
[39]
Wang, Y., Zhong, C., Gao, Q. & Cabrera-Arnau, C. Understanding internal migration in the UK before and during the COVID-19 pandemic using twitter data.Urban Informatics1, 10.1007/s44212-022-00018-w (2022)
-
[40]
Mobility Patterns Are Associated with Experienced Income Segregation in Large
Moro, E., Calacci, D., Dong, X. & Pentland, A. Mobility patterns are associated with experienced income segregation in large us cities.Nat. Commun.12, 10.1038/s41467-021-24899-8 (2021)
- [41]
-
[42]
Ribeiro, F . N., Benevenuto, F . & Zagheni, E. How biased is the population of facebook users? comparing the demographics of facebook users with census data to generate correction factors, 10.1145/3394231.3397923 (2020). Proceedings of the 12th ACM Conference on Web Science, Southampton, United Kingdom, pp. 325–334. Association for Computing Machinery , N...
-
[43]
Gil-Clavel, S. & Zagheni, E. Demographic differentials in facebook usage around the world.Proc. Int. AAAI Conf. on Web Soc. Media13, 647–650, 10.1609/icwsm.v13i01.3263 (2019)
-
[44]
Breen, C. F .et al.Mapping subnational gender gaps in internet and mobile adoption using social media data.Proc. Natl. Acad. Sci.122, e2416624122, 10.1073/pnas.2416624122 (2025). https://www.pnas.org/doi/pdf/10.1073/ pnas.2416624122
-
[45]
González-Leonardo, M., Cabrera, C., Neville, R., Nasuto, A. & Rowe, F . Beyond the immediate impacts of covid-19 on internal population movements in mexico: Facebook data reveal urban decay and slow recovery—a research note. Demography62, 1171–1184, 10.1215/00703370-12183205 (2025). https://read.dukeupress.edu/demography/ article-pdf/62/4/1171/2307728/117...
-
[46]
PLoS ONE9(1), e86041 (2014-01-27).https://doi.org/10.1371/journal.pone
Li, Z., Ning, H., Jing, F . & Lessani, M. N. Understanding the bias of mobile location data across spatial scales and over time: A comprehensive analysis of safegraph data in the united states.PLOS ONE19, 1–23, 10.1371/journal.pone. 0294430 (2024)
-
[47]
Duan, Q.et al.Identifying counter-urbanisation using facebook’s user count data.Habitat Int.150, 103113, https://doi.org/10.1016/j.habitatint.2024.103113 (2024)
-
[48]
Andrich, P .et al.Social media data for population mapping: A bayesian approach to address representativeness and privacy challenges (2026). 2601.22104. 14/15
arXiv 2026
-
[49]
Pelletier, F .et al.Census counts, undercounts and population estimates: The importance of data quality evaluation. T ech. Pap.2(2020)
2020
-
[50]
Kukutai, T . Census in crisis—further erasure of indigenous peoples?Science389, eaea0932, 10.1126/science.aea0932 (2025). https://www.science.org/doi/pdf/10.1126/science.aea0932
-
[51]
Global Demographic Data Project, funded by the Bill & Melinda Gates Foundation (INV-045237)
Bondarenko, M.et al.The spatial distribution of population in 2015–2030 at a resolution of 30 arc (approximately 1 km at the equator): R2025a version v1, 10.5258/SOTON/WP00845 (2025). Global Demographic Data Project, funded by the Bill & Melinda Gates Foundation (INV-045237)
-
[52]
Schiavina, M., Freire, S., Carioli, A. & MacManus, K. Ghs-pop r2023a: Ghs population grid multitemporal (1975–2030), 10.2905/2FF68A52-5B5B-4A22-8F40-C41DA8332CFE (2023). 58.Maas, P .et al.Facebook disaster maps: Aggregate insights for crisis response and recovery (2019)
work page doi:10.2905/2ff68a52-5b5b-4a22-8f40-c41da8332cfe 1975
-
[53]
Bing Maps Tile System - Bing Maps
Microsoft. Bing Maps Tile System - Bing Maps. https://learn.microsoft.com/en-us/bingmaps/articles/ bing-maps-tile-system.[Accessed 07-01-2026]
2026
-
[54]
Verma, R., Mittal, S., Lei, Z., Chen, X. & Ukkusuri, S. V . Comparison of home detection algorithms using smartphone gps data.EPJ Data Sci.13, 6, 10.1140/epjds/s13688-023-00447-w (2024)
-
[55]
Zhong, C., Zhou, Z., Aslam, N. S., Wang, Y. & Enaya, A. Anonymised human location data in england for urban mobility research.Sci. Data12, 2040, 10.1038/s41597-025-06323-8 (2025)
-
[56]
Blumenstock, J. & Eagle, N. Mobile divides.Proc. 4th ACM/IEEE Int. Conf. on Inf. Commun. T echnol. Dev.1–10, 10.1145/2369220.2369225 (2010)
-
[57]
Schlosser, F ., Sekara, V ., Brockmann, D. & Garcia-Herranz, M. Biases in human mobility data impact epidemic modeling (2021). 2112.12521
arXiv 2021
-
[58]
Representativeness in GPS-based mobility data is source-specific and geographically uneven
Valavi, R., Elith, J., Lahoz-Monfort, J. J. & Guillera-Arroita, G. blockcv: An r package for generating spatially or environmentally separated folds for k-fold cross-validation of species distribution models.Methods Ecol. Evol.10, 225–232, https://doi.org/10.1111/2041-210X.13107 (2019). https://besjournals.onlinelibrary .wiley .com/doi/pdf/ 10.1111/2041-2...
discussion (0)
Sign in with ORCID, Apple, or X to comment. Anyone can read and Pith papers without signing in.