Sphere of Influence Centrality via Shapley Values: Empirical Approximation and Network Coverage Analysis
Pith reviewed 2026-06-25 22:01 UTC · model grok-4.3
The pith
Shapley values select just 26 nodes to influence half the Cora network under 3-hop reachability, far outperforming degree centrality.
A machine-rendered reading of the paper's core claim, the machinery that carries it, and where it could break.
Core claim
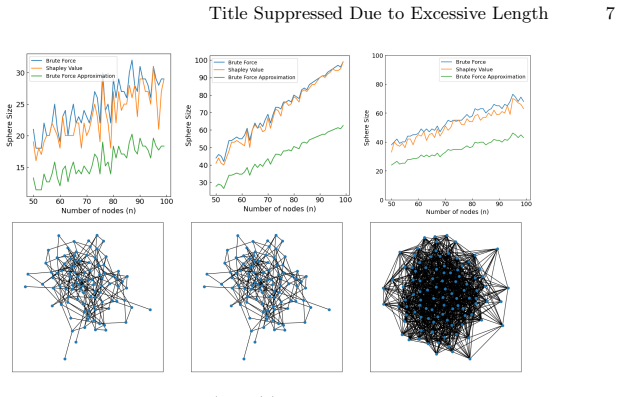
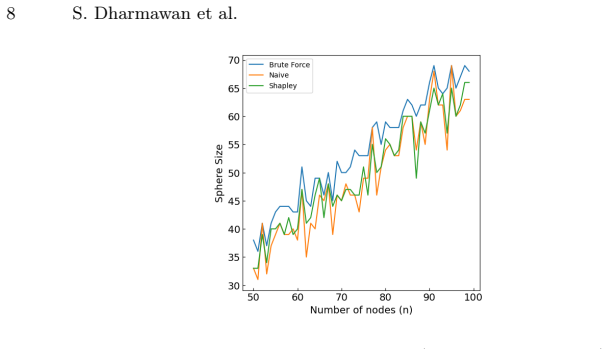
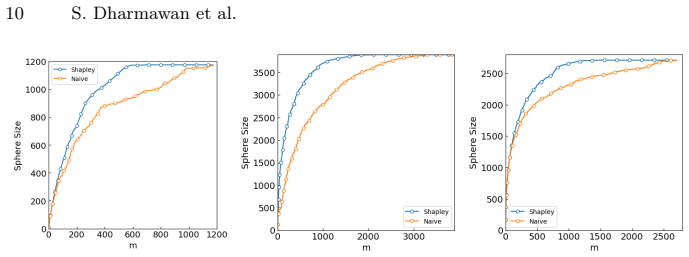
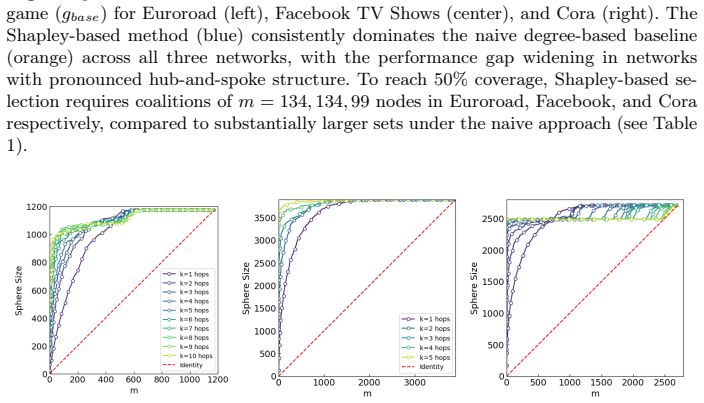
The Shapley-value-based framework for the sphere of influence problem selects m nodes to maximize network coverage under three reachability criteria. On the Euroroad, Facebook TV Shows, and Cora networks, practical approximation ratios approach 0.9 and exceed the (1-1/e) lower bound, while the Shapley approach dramatically outperforms a degree-based baseline, with the most striking case being 26 nodes (under 1% of Cora) sufficient to influence half the graph under 3-hop reachability.
What carries the argument
Shapley values computed for each node's marginal contribution to collective coverage in coalitions, using exact polynomial-time algorithms for the single-hop, k-hop, and multi-path reachability functions.
If this is right
- Shapley selection requires substantially smaller sets than degree centrality to achieve equivalent coverage levels on the tested networks.
- Approximation ratios stay close to 0.9 across all three reachability criteria.
- In hub-and-spoke topologies the gap versus the baseline widens markedly.
- Under 1% of nodes can suffice for 50% coverage in at least one real citation network with 3-hop rules.
Where Pith is reading between the lines
- The outperformance suggests that Shapley values capture overlapping or synergistic coverage effects that local degree counts miss.
- The method could be tested on synthetic networks with controlled topologies to isolate when the advantage appears.
- Exact Shapley computation may extend to other collective coverage tasks such as sensor placement or epidemic control on moderate-sized graphs.
Load-bearing premise
The three real-world networks and three reachability criteria are representative enough that the observed performance gap versus the degree baseline will generalize to other networks and influence settings.
What would settle it
Testing the same selection task on additional networks with different degree distributions or topologies and finding that the Shapley method no longer requires substantially fewer nodes than degree centrality to reach 50% coverage under 3-hop reachability.
Figures
read the original abstract
Node centrality is a fundamental problem in network analysis, yet classical metrics fail to capture the collective, coalitional nature of influence. We present a systematic empirical evaluation of the Shapley-value-based framework for the sphere of influence problem -- selecting $m$ nodes to maximize network coverage under three reachability criteria: single-hop, $k$-hop, and multi-path connectivity -- using exact polynomial-time algorithms due to Michalak et al. Evaluation across three diverse real-world networks (Euroroad, Facebook TV Shows, and Cora) demonstrates that practical approximation ratios consistently approach 0.9, substantially exceeding the theoretical $(1-1/e)$ lower bound, and that the Shapley-based approach dramatically outperforms a degree-based baseline, particularly in hub-and-spoke topologies. In the most striking case, Shapley-based selection identifies just 26 nodes (under 1\% of the Cora network) sufficient to influence half the graph under 3-hop reachability, compared to substantially larger sets required by the naive baseline.
Editorial analysis
A structured set of objections, weighed in public.
Referee Report
Summary. The paper presents a systematic empirical evaluation of a Shapley-value-based framework for the sphere-of-influence problem (selecting m nodes to maximize coverage under single-hop, k-hop, and multi-path reachability criteria). Using exact polynomial-time algorithms from prior work, it reports that practical approximation ratios on three real-world networks (Euroroad, Facebook TV Shows, Cora) consistently approach 0.9 (exceeding the (1-1/e) theoretical bound) and that the Shapley approach substantially outperforms a degree baseline, with the striking result that 26 nodes (<1% of Cora) suffice to influence half the graph under 3-hop reachability.
Significance. If the results hold, the work supplies concrete empirical evidence that coalitional (Shapley) centrality can deliver practical performance gains over simple degree heuristics for influence maximization under multiple reachability models, with the use of exact algorithms from Michalak et al. providing a reproducible baseline. The Cora 26-node result is a falsifiable, topology-specific prediction that could be tested on similar citation networks.
major comments (2)
- [Abstract] Abstract: the claim that results on Euroroad, Facebook TV Shows, and Cora demonstrate that the Shapley approach 'dramatically outperforms' the degree baseline 'particularly in hub-and-spoke topologies' is load-bearing for the central empirical contribution, yet the manuscript supplies no network statistics (degree distribution, diameter, clustering) or synthetic controls (preferential-attachment or small-world graphs) to establish that these three instances are representative of the structural regimes where the gap is asserted to be largest.
- [Evaluation section] Evaluation (assumed §4–5): the reported ratios (~0.9) and node counts (e.g., 26 nodes on Cora) rest exclusively on three networks without justification for representativeness or additional experiments that would test whether the observed performance gap versus degree baseline generalizes; this directly undermines the generality of the 'practical approximation ratios consistently approach 0.9' claim.
minor comments (1)
- [Abstract] The abstract refers to 'exact polynomial-time algorithms due to Michalak et al.' but does not restate the precise data-exclusion rules, error-bar computation, or baseline implementation details needed to reproduce the 0.9 ratio and 26-node figures.
Simulated Author's Rebuttal
We thank the referee for the constructive feedback on our empirical evaluation. We address each major comment below and indicate the revisions we will make to improve the manuscript.
read point-by-point responses
-
Referee: [Abstract] Abstract: the claim that results on Euroroad, Facebook TV Shows, and Cora demonstrate that the Shapley approach 'dramatically outperforms' the degree baseline 'particularly in hub-and-spoke topologies' is load-bearing for the central empirical contribution, yet the manuscript supplies no network statistics (degree distribution, diameter, clustering) or synthetic controls (preferential-attachment or small-world graphs) to establish that these three instances are representative of the structural regimes where the gap is asserted to be largest.
Authors: We agree that network statistics would help readers evaluate the structural context of our results. In the revised manuscript we will add a table reporting average degree, degree distribution summary, diameter, and clustering coefficient for each of the three networks. This will substantiate the observation that Cora exhibits hub-and-spoke characteristics. The three networks were chosen to span distinct domains (transportation, social media, citation), but we do not claim statistical representativeness of all topologies. We will qualify the abstract phrasing to make clear that the performance gap is observed on these instances, with the largest gap appearing on the citation network. We do not intend to add synthetic-graph experiments in this revision, as the study focuses on real-world data; if the referee considers this essential we can note it as future work. revision: partial
-
Referee: [Evaluation section] Evaluation (assumed §4–5): the reported ratios (~0.9) and node counts (e.g., 26 nodes on Cora) rest exclusively on three networks without justification for representativeness or additional experiments that would test whether the observed performance gap versus degree baseline generalizes; this directly undermines the generality of the 'practical approximation ratios consistently approach 0.9' claim.
Authors: The manuscript reports an empirical study on three concrete networks rather than a universal claim. The phrase 'practical approximation ratios consistently approach 0.9' describes the values obtained on the evaluated instances. We will add the network statistics mentioned above to provide context. The 26-node Cora result is presented as an observation for that specific network under 3-hop reachability. We will revise the abstract and conclusion to emphasize that the findings pertain to the three studied networks and do not assert broad generalization. Additional experiments on more networks or synthetic graphs lie outside the current scope but can be flagged as future work. revision: partial
Circularity Check
No circularity: empirical evaluation uses external algorithms and benchmarks
full rationale
The paper's central results consist of empirical measurements (approximation ratios, node counts for coverage, comparisons to degree baseline) computed on three external real-world networks using exact algorithms cited from Michalak et al. No equations, fitted parameters, or predictions are defined in terms of the target quantities; the (1-1/e) bound is the standard submodular guarantee, not derived internally. All load-bearing steps rely on independent external inputs rather than self-referential definitions or self-citation chains, satisfying the self-contained criterion.
Axiom & Free-Parameter Ledger
axioms (2)
- domain assumption The exact polynomial-time algorithms of Michalak et al. correctly compute Shapley values for the sphere-of-influence coverage games under the stated reachability criteria.
- domain assumption The three chosen networks (Euroroad, Facebook TV Shows, Cora) are representative of real-world networks for the purpose of comparing Shapley versus degree selection.
Reference graph
Works this paper leans on
-
[1]
Bojchevski, A., Günnemann, S.: Deep gaussian embedding of graphs: Unsupervised inductive learning via ranking (2018),https://arxiv.org/abs/1707.03815
Pith/arXiv arXiv 2018
-
[2]
Feige, U.: A threshold of ln n for approximating set cover. J. ACM45(4), 634–652 (Jul 1998).https://doi.org/10.1145/285055.285059,https://doi. org/10.1145/285055.285059
-
[3]
Theory Comput.11, 105–147 (2003),https://api
Kempe, D., Kleinberg, J.M., Tardos, É.: Maximizing the spread of influence through a social network. Theory Comput.11, 105–147 (2003),https://api. semanticscholar.org/CorpusID:7214363
2003
-
[4]
Leskovec, J., Krause, A., Guestrin, C., Faloutsos, C., VanBriesen, J., Glance, N.: Cost-effective outbreak detection in networks. In: Proceedings of the 13th ACM SIGKDD International Conference on Knowledge Discovery and Data Mining. p. 420–429. KDD ’07, Association for Computing Machinery, New York, NY, USA(2007).https://doi.org/10.1145/1281192.1281239,h...
-
[5]
Journal of Artificial Intelligence Research46, 607–650 (Apr 2013).https://doi
Michalak, T.P., Aadithya, K.V., Szczepanski, P.L., Ravindran, B., Jennings, N.R.: Efficient computation of the shapley value for game-theoretic network centrality. Journal of Artificial Intelligence Research46, 607–650 (Apr 2013).https://doi. org/10.1613/jair.3806,http://dx.doi.org/10.1613/jair.3806
-
[6]
Narayanam, R., Narahari, Y.: A shapley value-based approach to discover influen- tial nodes in social networks. IEEE Transactions on Automation Science and En- gineering8(1), 130–147 (2011).https://doi.org/10.1109/TASE.2010.2052042
-
[7]
Nemhauser, G.L., Wolsey, L.A., Fisher, M.L.: An analysis of approximations for maximizing submodular set functions–i. Math. Program.14(1), 265–294 (Dec 1978).https://doi.org/10.1007/BF01588971,https://doi.org/10.1007/ BF01588971
-
[8]
In: AAAI (2015),https://networkrepository.com
Rossi, R.A., Ahmed, N.K.: The network data repository with interactive graph analytics and visualization. In: AAAI (2015),https://networkrepository.com
2015
-
[9]
In: Proceedings of the 2019 IEEE/ACM International Confer- ence on Advances in Social Networks Analysis and Mining 2019
Rozemberczki, B., Davies, R., Sarkar, R., Sutton, C.: Gemsec: Graph embedding with self clustering. In: Proceedings of the 2019 IEEE/ACM International Confer- ence on Advances in Social Networks Analysis and Mining 2019. pp. 65–72. ACM (2019)
2019
-
[10]
Saxena, A., Iyengar, S.: Centrality measures in complex networks: A survey (2020), https://arxiv.org/abs/2011.07190
arXiv 2020
-
[11]
RAND Corporation, Santa Monica, CA (1952).https://doi.org/10.7249/P0295
Shapley, L.S.: A Value for N-Person Games. RAND Corporation, Santa Monica, CA (1952).https://doi.org/10.7249/P0295
-
[12]
In: Proceedings of the 7th International Joint Conference on Autonomous Agents and Multiagent Systems - Volume 3
Suri, N.R., Narahari, Y.: Determining the top-k nodes in social networks using the shapley value. In: Proceedings of the 7th International Joint Conference on Autonomous Agents and Multiagent Systems - Volume 3. p. 1509–1512. AAMAS ’08, International Foundation for Autonomous Agents and Multiagent Systems, Richland, SC (2008)
2008
-
[13]
Winter, E.: Chapter 53 the shapley value. In: Handbook of Game Theory with Economic Applications, Handbook of Game Theory with Economic Applications, vol. 3, pp. 2025–2054. Elsevier (2002). https://doi.org/https://doi.org/10.1016/S1574-0005(02)03016-3, https://www.sciencedirect.com/science/article/pii/S1574000502030163
discussion (0)
Sign in with ORCID, Apple, or X to comment. Anyone can read and Pith papers without signing in.