Wasserstein recurrence networks for multiscale time series pattern analysis
Pith reviewed 2026-06-25 21:48 UTC · model grok-4.3
The pith
The 1-Wasserstein distance between time series patterns is scale-invariant under Brownian motion, supplying a threshold for identifying recurrences at any scale.
A machine-rendered reading of the paper's core claim, the machinery that carries it, and where it could break.
Core claim
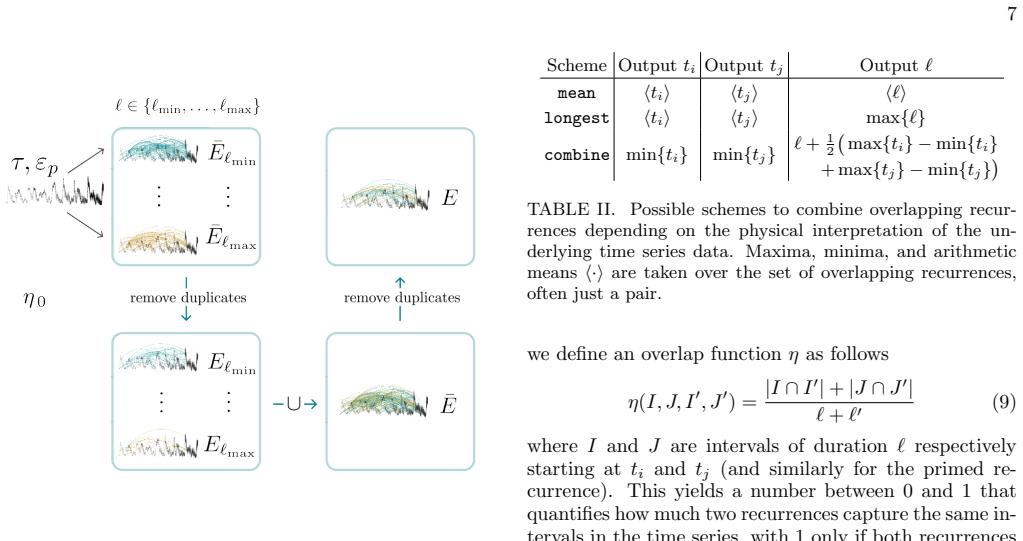
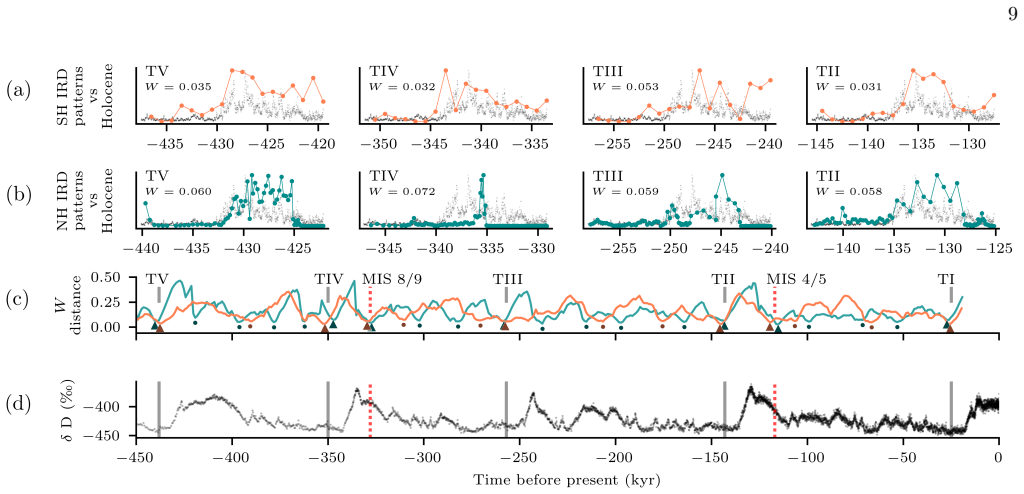
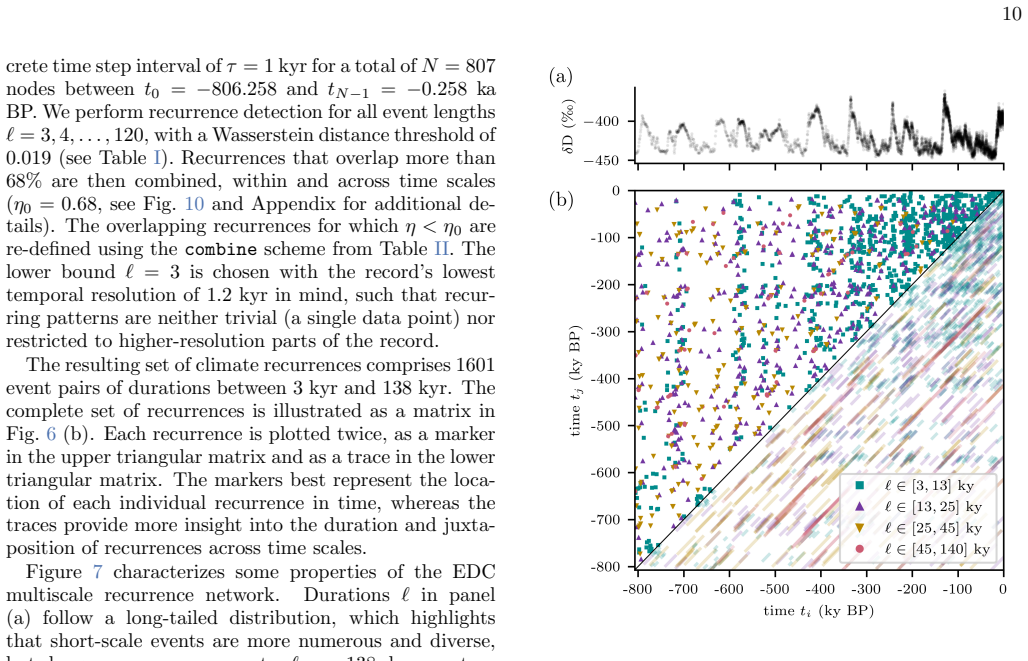
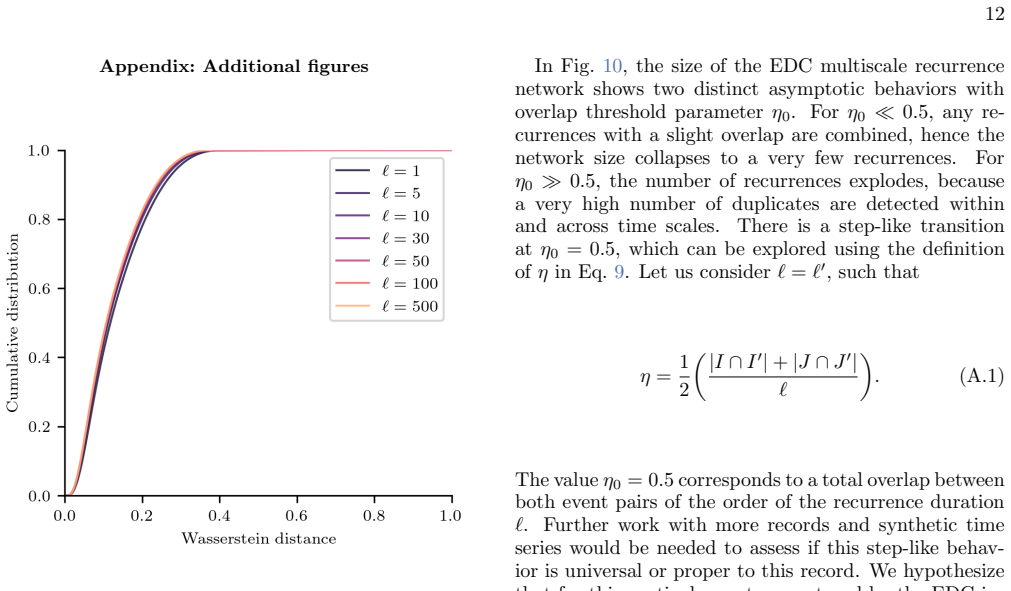
By demonstrating numerically the scale invariance of 1-Wasserstein distance distributions between patterns drawn from one-dimensional Brownian motion, the framework defines recurrences at any time scale as local minima of the distance that fall below the probability threshold given by that null model; non-overlapping recurrences can then be aggregated to produce a set of distinct multiscale recurring events, as illustrated on ice-rafted debris and ice-core records.
What carries the argument
The 1-Wasserstein distance applied to time-series segments via a mathematical transform, with recurrence thresholds taken from the scale-invariant distribution of distances in one-dimensional Brownian motion.
If this is right
- Recurrences can be identified consistently across scales from seasonal to multi-millennial within the same record.
- Non-overlapping aggregation produces a distinct collection of multiscale recurring events.
- The method applies directly to records with abrupt changes and irregular temporal resolution.
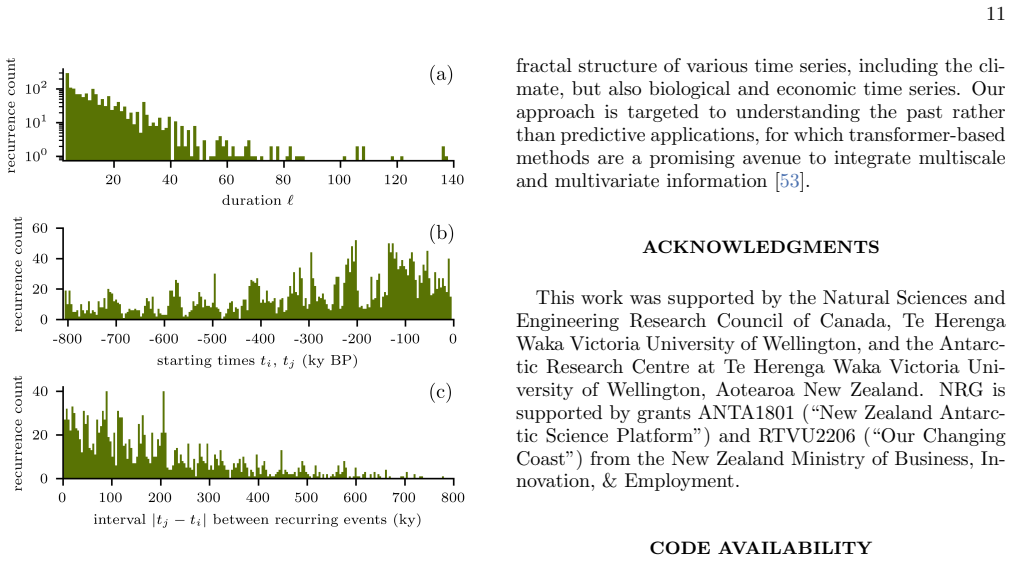
- Detected events in ice-core and debris records exhibit durations spanning more than two orders of magnitude.
Where Pith is reading between the lines
- The same Brownian-derived threshold rule could be tested on synthetic series that embed known repeating patterns at multiple scales.
- If the identified recurrences align with independently dated climate events, the framework would supply an objective way to compare recurrence statistics across different archives.
- Extension to multivariate or higher-dimensional series would require checking whether the scale-invariance property survives the change in distance definition.
Load-bearing premise
That the statistical properties of one-dimensional Brownian motion supply an appropriate null model and threshold for determining what counts as a recurrence in real paleoclimate time series.
What would settle it
Empirical 1-Wasserstein distance distributions computed on paleoclimate records that deviate markedly from the scale-invariant form predicted by Brownian motion would falsify the threshold rule.
Figures
read the original abstract
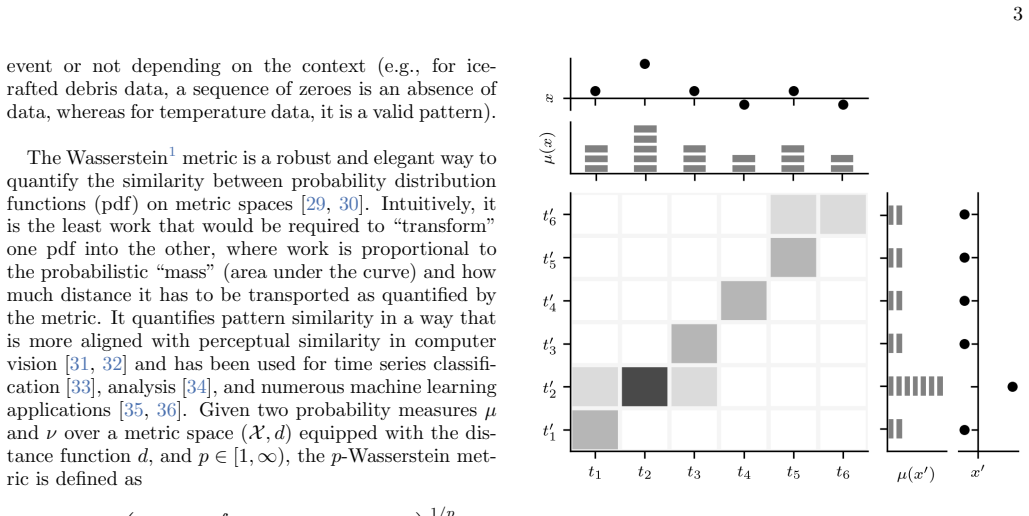
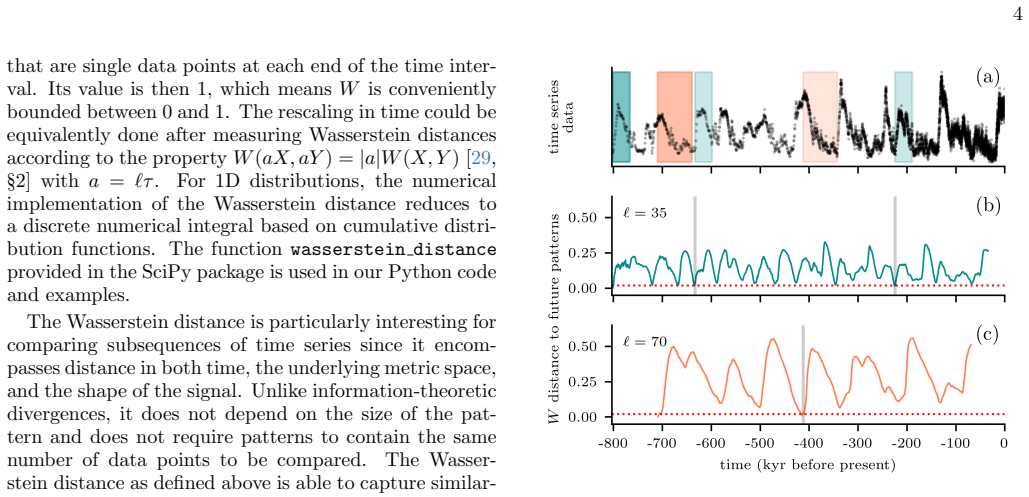
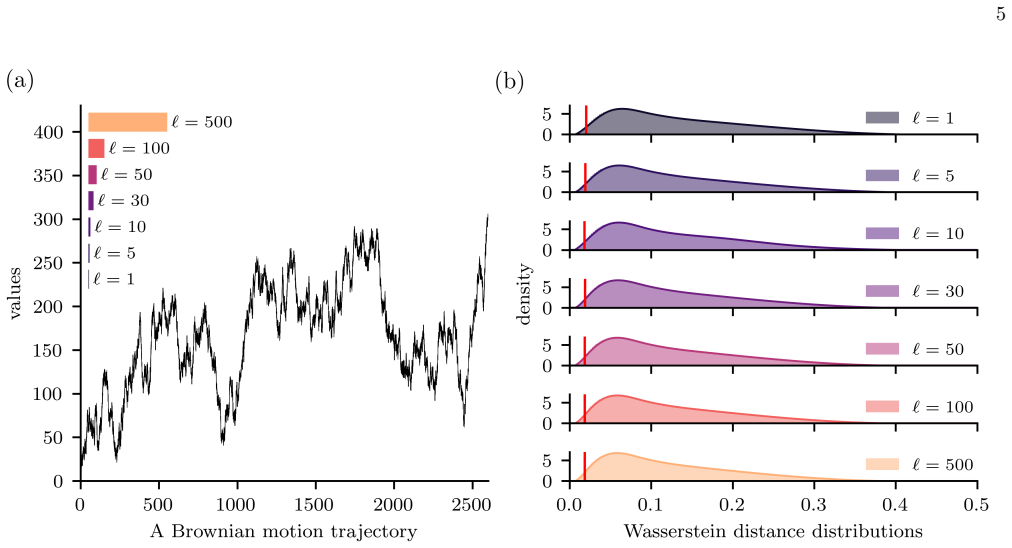
Time series data are often generated by systems which operate on multiple temporal scales, of which Earth's climate system is a paramount example. Variations in global climate are recorded in paleo-environmental archives as temporal patterns across a wide range of time scales, from seasonal or decadal to multi-millennial. In this context, recurrence analysis, where repeating patterns are identified in time series, is limited by the underlying properties of the distance function used and of the time series data themselves, especially in terms of temporal resolution and scale dependence. In this paper, we present a novel recurrence analysis framework designed for multiscale time series data with abrupt changes and irregular temporal resolution as found in paleoclimate records. We introduce a simple mathematical transform to use the $1-$Wasserstein distance for recurring pattern detection in time series. The scale invariance of $1-$Wasserstein distance distributions between patterns in Brownian motion is demonstrated numerically, which provides a principled threshold choice for recurrences. At any time scale, recurrences are defined as local minima of the distance, granted that they are below a threshold given by the probability of encountering patterns at least as similar in one-dimensional Brownian motion. Recurrences can be further combined according to a non-overlapping condition to yield a distinct set of multiscale recurring events. We provide examples of climatic applications from ice-rafted debris and ice core records, where detected recurrences have durations spanning over two orders of magnitude. Our method extends recurrence analysis to more complex time series data and provides new avenues for statistical identification and analyses of recurring events at multiple temporal scales.
Editorial analysis
A structured set of objections, weighed in public.
Referee Report
Summary. The manuscript introduces a recurrence analysis framework for multiscale time series with irregular resolution and abrupt changes, using a mathematical transform of the 1-Wasserstein distance. Recurrences are defined as local minima of this distance that fall below a threshold derived from the tail probability under one-dimensional Brownian motion, justified by a numerical demonstration of scale invariance in the W1 distance distributions for BM patterns. Recurrences are then combined under a non-overlapping condition to identify multiscale events. Applications are shown on ice-rafted debris and ice core records, with detected recurrences spanning over two orders of magnitude in duration.
Significance. If the BM-derived threshold is shown to be appropriate, the approach supplies a scale-invariant, numerically grounded method for recurrence detection in non-stationary paleoclimate series, extending recurrence analysis beyond standard distance functions and regular sampling. The explicit numerical demonstration of scale invariance under BM is a positive feature that supports the parameter-light threshold choice.
major comments (1)
- [Abstract (threshold definition)] Abstract and threshold construction: the claim that the threshold is 'principled' depends on 1D Brownian motion supplying a suitable null model whose distance statistics match those of the target paleoclimate series. Paleoclimate records typically contain trends, regime shifts, and long-memory correlations absent from standard BM; without explicit checks (e.g., comparison of empirical W1 distributions or surrogate tests preserving the series' autocorrelation structure), the threshold lacks calibrated meaning for the claimed applications.
minor comments (2)
- [Abstract] The 'simple mathematical transform' that enables use of the 1-Wasserstein distance on time series is referenced but not shown; including the explicit mapping or pseudocode would aid reproducibility.
- The title refers to 'recurrence networks' yet the abstract and central construction emphasize recurrence detection and combination; a short clarification of how the detected events form or are analyzed as a network would improve consistency.
Simulated Author's Rebuttal
We thank the referee for the constructive feedback. We address the single major comment below.
read point-by-point responses
-
Referee: [Abstract (threshold definition)] Abstract and threshold construction: the claim that the threshold is 'principled' depends on 1D Brownian motion supplying a suitable null model whose distance statistics match those of the target paleoclimate series. Paleoclimate records typically contain trends, regime shifts, and long-memory correlations absent from standard BM; without explicit checks (e.g., comparison of empirical W1 distributions or surrogate tests preserving the series' autocorrelation structure), the threshold lacks calibrated meaning for the claimed applications.
Authors: We agree that standard Brownian motion does not reproduce trends, regime shifts, or long-memory correlations typical of paleoclimate records, and that the manuscript does not include surrogate tests that preserve autocorrelation structure or direct comparisons of empirical W1 distributions. The BM reference is used solely to exploit the numerically demonstrated scale invariance of the W1 distance tail probabilities, thereby supplying a single, scale-consistent threshold without additional parameters. This is a modeling choice for threshold construction rather than a claim that BM statistics match the data. In revision we will (i) rephrase the abstract and methods to avoid the word 'principled' and instead describe the threshold as 'scale-invariant under a Brownian-motion reference,' (ii) add an explicit limitations paragraph noting the mismatch with paleoclimate autocorrelation, and (iii) outline how surrogate-based calibration could be performed in future applications. No new numerical checks will be added at this stage. revision: partial
Circularity Check
No significant circularity; threshold from external 1D Brownian motion null model
full rationale
The paper's central construction defines recurrences as local minima of 1-Wasserstein distances below a threshold taken from the tail probability under 1D Brownian motion, after numerically demonstrating scale invariance of the distance distribution on BM patterns. This uses an external statistical model as null benchmark rather than fitting parameters to the target paleoclimate series or reducing the result to the input data by construction. No self-citation load-bearing steps, uniqueness theorems imported from authors, ansatzes smuggled via citation, or renaming of known results are present. The derivation remains self-contained against the external BM benchmark; any mismatch with paleoclimate correlation structure is a question of model appropriateness, not circularity.
Axiom & Free-Parameter Ledger
axioms (1)
- domain assumption 1-Wasserstein distance distributions between patterns are scale-invariant in one-dimensional Brownian motion
Reference graph
Works this paper leans on
-
[1]
as unlikely as within purely uncorrelated noise
for 0< t 1 < t2 < . . . < t n−1 < t n, the increments B(t1), B(t2)−B(t 1), . . . , B(tn)−B(t n−1) are independent and normally distributed, with means 0 and variancest 1, t2 −t 1, . . . , tn −t n−1. It follows from the latter property that it is scale in- variant,i.e.a −1B(a2t) is also a Brownian motion for alla >0. This property and its analytical simpli...
-
[2]
Paleoclimate Perspectives on Contemporary Climate Change,
Sandy P. Harrison, Patrick J. Bartlein, Esmeralda Cruz- Silva, Olivia Haas, Stephen T. Jackson, Nikita Kaushal, Mengmeng Liu, Donatella Magri, Dominic T. Robson, Guido Vettoretti, and I. Colin Prentice, “Paleoclimate Perspectives on Contemporary Climate Change,” Annual Review of Environment and Resources50, 67–95 (2025)
2025
-
[3]
What can Palaeoclimate Mod- elling do for you?
A. M. Haywood, P. J. Valdes, T. Aze, N. Barlow, A. Burke, A. M. Dolan, A. S. von der Heydt, D. J. Hill, S. S. R. Jamieson, B. L. Otto-Bliesner, U. Salzmann, E. Saupe, and J. Voss, “What can Palaeoclimate Mod- elling do for you?” Earth Systems and Environment3, 1–18 (2019)
2019
-
[4]
Paleocli- mate data provide constraints on climate models’ large- scale response to past CO2 changes,
Daniel J. Lunt, Bette L. Otto-Bliesner, Chris Brier- ley, Alan Haywood, Gordon N. Inglis, Kenji Izumi, Masa Kageyama, Darrell Kaufman, Thorsten Mauritsen, Erin L. McClymont, Ulrich Salzmann, Sebastian Steinig, Jessica E. Tierney, Anni Zhao, and Jiang Zhu, “Paleocli- mate data provide constraints on climate models’ large- scale response to past CO2 changes...
2024
-
[5]
Ad- vances in Paleoclimate Data Assimilation,
Jessica E. Tierney, Emily J. Judd, Matthew B. Osman, Jonathan M. King, Olivia J. Truax, Nathan J. Steiger, Daniel E. Amrhein, and Kevin J. Anchukaitis, “Ad- vances in Paleoclimate Data Assimilation,” Annual Re- view of Earth and Planetary Sciences53, 625–650 (2025)
2025
-
[6]
Problems with the current prac- tice of spectral analysis in cyclostratigraphy: Avoiding false detection of regular cyclicity,
Graham P. Weedon, “Problems with the current prac- tice of spectral analysis in cyclostratigraphy: Avoiding false detection of regular cyclicity,” Earth-Science Re- views235, 104261 (2022)
2022
-
[7]
Cyclostratigraphy and the problem of astrochronologic testing,
Stephen R. Meyers, “Cyclostratigraphy and the problem of astrochronologic testing,” Earth-Science Reviews190, 190–223 (2019)
2019
-
[8]
Distinct roles for precession, obliquity, and eccentricity in Pleistocene 100-kyr glacial cycles,
Stephen Barker, Lorraine E. Lisiecki, Gregor Knorr, So- phie Nuber, and Polychronis C. Tzedakis, “Distinct roles for precession, obliquity, and eccentricity in Pleistocene 100-kyr glacial cycles,” Science387, eadp3491 (2025)
2025
-
[9]
An astronomi- cally dated record of Earth’s climate and its predictabil- ity over the last 66 million years,
Thomas Westerhold, Norbert Marwan, Anna Joy Drury, Diederik Liebrand, Claudia Agnini, Eleni Anagnos- tou, James S. K. Barnet, Steven M. Bohaty, David De Vleeschouwer, Fabio Florindo, Thomas Frederichs, David A. Hodell, Ann E. Holbourn, Dick Kroon, Vittoria Lauretano, Kate Littler, Lucas J. Lourens, Mitchell Lyle, Heiko P¨ alike, Ursula R¨ ohl, Jun Tian, R...
2020
-
[10]
A New Recurrence-Network-Based Time Series Analysis Approach for Characterizing System Dynamics,
Guangyu Yang, Daolin Xu, and Haicheng Zhang, “A New Recurrence-Network-Based Time Series Analysis Approach for Characterizing System Dynamics,” En- tropy21, 45 (2019)
2019
-
[11]
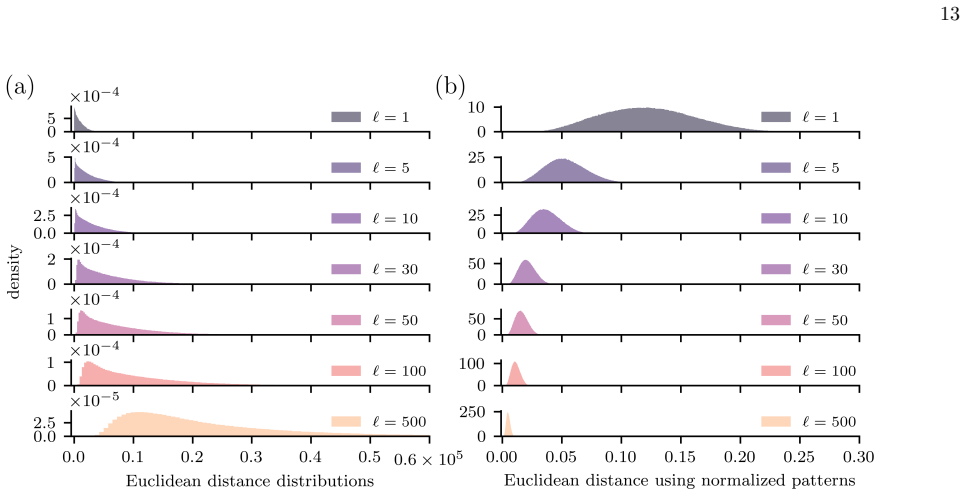
Varley and Olaf Sporns, “Network Anal- 13 FIG
Thomas F. Varley and Olaf Sporns, “Network Anal- 13 FIG. 9. (a) Euclidean distance distributions between patterns in Brownian motion at different time scales. (b) Euclidean distance distributions between patterns in Brownian motion when patterns are normalised using Eqs. (4-6) before computing the standard Euclidean distance. In both cases, the distributi...
-
[12]
Identification of dynam- ical transitions in marine palaeoclimate records by re- currence network analysis,
J. F. Donges, R. V. Donner, K. Rehfeld, N. Marwan, M. H. Trauth, and J. Kurths, “Identification of dynam- ical transitions in marine palaeoclimate records by re- currence network analysis,” Nonlinear Processes in Geo- physics18, 545–562 (2011)
2011
-
[13]
Complex network approach for recurrence analysis of time series,
Norbert Marwan, Jonathan F. Donges, Yong Zou, Reik V. Donner, and J¨ urgen Kurths, “Complex network approach for recurrence analysis of time series,” Physics Letters A373, 4246–4254 (2009)
2009
-
[14]
Recurrence Plots of Dynamical Systems,
J.-P. Eckmann, S. Oliffson Kamphorst, and D. Ruelle, “Recurrence Plots of Dynamical Systems,” Europhysics Letters4, 973 (1987)
1987
-
[15]
Recurrence plots for the analysis of com- plex systems,
Norbert Marwan, M. Carmen Romano, Marco Thiel, and J¨ urgen Kurths, “Recurrence plots for the analysis of com- plex systems,” Physics Reports438, 237–329 (2007)
2007
-
[16]
The Ap- plication of Recurrence Quantification Analysis in Detec- tion of Abrupt Climate Change,
Wen Zhang, Guoling Feng, and Qunqun Liu, “The Ap- plication of Recurrence Quantification Analysis in Detec- tion of Abrupt Climate Change,” Discrete Dynamics in Nature and Society2016, e2689429 (2016)
2016
-
[17]
A complex network approach to study the extreme precip- itation patterns in a river basin,
Ankit Agarwal, Ravi Kumar Guntu, Abhirup Banerjee, Mayuri Ashokrao Gadhawe, and Norbert Marwan, “A complex network approach to study the extreme precip- itation patterns in a river basin,” Chaos: An Interdisci- plinary Journal of Nonlinear Science32, 013113 (2022)
2022
-
[18]
Nonlinear detection of paleoclimate- variability transitions possibly related to human evolu- tion,
Jonathan F. Donges, Reik V. Donner, Martin H. Trauth, Norbert Marwan, Hans-Joachim Schellnhuber, and J¨ urgen Kurths, “Nonlinear detection of paleoclimate- variability transitions possibly related to human evolu- tion,” Proceedings of the National Academy of Sciences 108, 20422–20427 (2011)
2011
-
[19]
Classifying past climate change in the Chew Bahir basin, southern Ethiopia, using recurrence quantification analysis,
Martin H. Trauth, Asfawossen Asrat, Walter Duesing, Verena Foerster, K. Hauke Kraemer, Norbert Marwan, Mark A. Maslin, and Frank Schaebitz, “Classifying past climate change in the Chew Bahir basin, southern Ethiopia, using recurrence quantification analysis,” Cli- mate Dynamics53, 2557–2572 (2019)
2019
-
[20]
High predictability potential of highly synchro- nized widespread floods in monsoon regions,
Jianxin Zhang, Kai Liu, Ming Wang, Kaiwen Li, Fenying Cai, Josef Ludescher, J¨ urgen Kurths, and Norbert Mar- wan, “High predictability potential of highly synchro- nized widespread floods in monsoon regions,” Journal of 14 Hydrology668, 135006 (2026)
2026
-
[21]
How to avoid potential pitfalls in re- currence plot based data analysis,
Norbert Marwan, “How to avoid potential pitfalls in re- currence plot based data analysis,” International Journal of Bifurcation and Chaos21, 1003–1017 (2011)
2011
-
[22]
Ambiguities in recurrence-based com- plex network representations of time series,
Reik V. Donner, “Ambiguities in recurrence-based com- plex network representations of time series,” Physical Re- view E81(2010), 10.1103/PhysRevE.81.015101
-
[23]
Selection of recurrence threshold for signal detection,
S. Schinkel, O. Dimigen, and N. Marwan, “Selection of recurrence threshold for signal detection,” The European Physical Journal Special Topics164, 45–53 (2008)
2008
-
[24]
Recurrence threshold selection for ob- taining robust recurrence characteristics in different em- bedding dimensions,
K. Hauke Kraemer, Reik V. Donner, Jobst Heitzig, and Norbert Marwan, “Recurrence threshold selection for ob- taining robust recurrence characteristics in different em- bedding dimensions,” Chaos: An Interdisciplinary Jour- nal of Nonlinear Science28, 085720 (2018)
2018
-
[25]
Recurrence plot analysis of irregularly sampled data,
Ibrahim Ozken, Deniz Eroglu, Sebastian F. M. Breit- enbach, Norbert Marwan, Liangcheng Tan, Ugur Tir- nakli, and J¨ urgen Kurths, “Recurrence plot analysis of irregularly sampled data,” Physical Review E98, 052215 (2018)
2018
-
[26]
Local minima-based recurrence plots for continuous dynamical systems,
Aaron P. Schultz, Yong Zou, Norbert Marwan, and Michael T. Turvey, “Local minima-based recurrence plots for continuous dynamical systems,” International Journal of Bifurcation and Chaos21, 1065–1075 (2011)
2011
-
[27]
Short- and long-term variabil- ity of the Antarctic and Greenland ice sheets,
Edward Hanna, D´ aniel Top´ al, Jason E. Box, Sammie Buzzard, Frazer D. W. Christie, Christine Hvidberg, Mathieu Morlighem, Laura De Santis, Alessandro Sil- vano, Florence Colleoni, Ingo Sasgen, Alison F. Ban- well, Michiel R. van den Broeke, Robert DeConto, Jan De Rydt, Heiko Goelzer, Alexandra Gossart, G. Hilmar Gudmundsson, Katrin Lindb¨ ack, Bertie Mi...
2024
-
[28]
When Resources Collide: Towards a Theory of Coincidence in Information Spaces,
Markus Luczak-Roesch, Ramine Tinati, and Nigel Shad- bolt, “When Resources Collide: Towards a Theory of Coincidence in Information Spaces,” inProceedings of the 24th International Conference on World Wide Web, WWW ’15 Companion (Association for Computing Ma- chinery, New York, NY, USA, 2015) pp. 1137–1142
2015
-
[29]
What an Entangled Web We Weave: An Information-centric Approach to Time- evolving Socio-technical Systems,
Markus Luczak-Roesch, Kieron O’Hara, Jesse David Din- neen, and Ramine Tinati, “What an Entangled Web We Weave: An Information-centric Approach to Time- evolving Socio-technical Systems,” Minds and Machines 28, 709–733 (2018)
2018
-
[30]
Statistical As- pects of Wasserstein Distances,
Victor M. Panaretos and Yoav Zemel, “Statistical As- pects of Wasserstein Distances,” Annual Review of Statistics and Its Application6, 405–431 (2019)
2019
-
[31]
Berger, B
C´ edric Villani,Optimal Transport, edited by M. Berger, B. Eckmann, P. De La Harpe, F. Hirzebruch, N. Hitchin, L. H¨ ormander, A. Kupiainen, G. Lebeau, M. Ratner, D. Serre, Ya. G. Sinai, N. J. A. Sloane, A. M. Vershik, and M. Waldschmidt, Grundlehren Der Mathematischen Wissenschaften, Vol. 338 (Springer, Berlin, Heidelberg, 2009)
2009
-
[32]
The Earth Mover’s Distance as a Metric for Image Re- trieval,
Yossi Rubner, Carlo Tomasi, and Leonidas J. Guibas, “The Earth Mover’s Distance as a Metric for Image Re- trieval,” International Journal of Computer Vision40, 99–121 (2000)
2000
-
[33]
A linear transportation Lp distance for pattern recognition,
Oliver M. Crook, Mihai Cucuringu, Tim Hurst, Carola- Bibiane Sch¨ onlieb, Matthew Thorpe, and Konstanti- nos C. Zygalakis, “A linear transportation Lp distance for pattern recognition,” Pattern Recognition147, 110080 (2024)
2024
-
[34]
Wasser- stein distances in the analysis of time series and dynami- cal systems,
Michael Muskulus and Sjoerd Verduyn-Lunel, “Wasser- stein distances in the analysis of time series and dynami- cal systems,” Physica D: Nonlinear Phenomena240, 45– 58 (2011)
2011
-
[35]
The Wasserstein-Fourier Distance for Stationary Time Se- ries,
Elsa Cazelles, Arnaud Robert, and Felipe Tobar, “The Wasserstein-Fourier Distance for Stationary Time Se- ries,” IEEE Transactions on Signal Processing69, 709– 721 (2021)
2021
-
[36]
Computational Op- timal Transport with Applications to Data Sciences,
Peyr´ e Gabriel and Cuturi Marco, “Computational Op- timal Transport with Applications to Data Sciences,” Foundations and Trends in Machine Learning11, 355– 607 (2019)
2019
-
[37]
Optimal Mass Transport: Signal processing and machine-learning ap- plications,
Soheil Kolouri, Se Rim Park, Matthew Thorpe, De- jan Slepcev, and Gustavo K. Rohde, “Optimal Mass Transport: Signal processing and machine-learning ap- plications,” IEEE Signal Processing Magazine34, 43–59 (2017)
2017
-
[38]
Prescribing a System of Random Vari- ables by Conditional Distributions,
R. L. Dobrushin, “Prescribing a System of Random Vari- ables by Conditional Distributions,” Theory of Probabil- ity & Its Applications15, 458–486 (1970)
1970
-
[39]
On Wasserstein Two Sample Testing and Related Fam- ilies of Nonparametric Tests,
Aaditya Ramdas, Nicolas Garcia, and Marco Cuturi, “On Wasserstein Two Sample Testing and Related Fam- ilies of Nonparametric Tests,” (2015), arXiv:1509.02237 [math, stat]
Pith/arXiv arXiv 2015
-
[40]
(Springer, New York, NY, 1983)
David Freedman,Brownian Motion and Diffusion, 1st ed. (Springer, New York, NY, 1983)
1983
-
[41]
P Value and the Theory of Hypothesis Test- ing: An Explanation for New Researchers,
David Jean Biau, Brigitte M. Jolles, and Rapha¨ el Porcher, “P Value and the Theory of Hypothesis Test- ing: An Explanation for New Researchers,” Clinical Or- thopaedics and Related Research468, 885–892 (2010)
2010
-
[42]
Code for analysis and figures for pa- per
B´ eatrice D´ esy, “Code for analysis and figures for pa- per...” Zenodo (2026)
2026
-
[43]
Scientific method: Statistical errors,
Regina Nuzzo, “Scientific method: Statistical errors,” Na- ture506, 150–152 (2014)
2014
-
[44]
Time series analysis via network science: Concepts and algorithms,
Vanessa Freitas Silva, Maria Eduarda Silva, Pedro Ribeiro, and Fernando Silva, “Time series analysis via network science: Concepts and algorithms,” WIREs Data Mining and Knowledge Discovery11, e1404 (2021)
2021
-
[45]
Detecting strange attractors in turbu- lence,
Floris Takens, “Detecting strange attractors in turbu- lence,” inDynamical Systems and Turbulence, War- wick 1980, edited by David Rand and Lai-Sang Young (Springer, Berlin, Heidelberg, 1981) pp. 366–381
1980
-
[46]
Persistent influence of obliquity on ice age terminations since the Middle Pleis- tocene transition,
Petra Bajo, Russell N. Drysdale, Jon D. Woodhead, John C. Hellstrom, David Hodell, Patrizia Ferretti, An- tje H. L. Voelker, Giovanni Zanchetta, Teresa Rodrigues, Eric Wolff, Jonathan Tyler, Silvia Frisia, Christoph Sp¨ otl, and Anthony E. Fallick, “Persistent influence of obliquity on ice age terminations since the Middle Pleis- tocene transition,” Scien...
2020
-
[47]
Millennial-scale variability in Antarctic ice- sheet discharge during the last deglaciation,
M. E. Weber, P. U. Clark, G. Kuhn, A. Timmer- mann, D. Sprenk, R. Gladstone, X. Zhang, G. Lohmann, L. Menviel, M. O. Chikamoto, T. Friedrich, and C. Ohlwein, “Millennial-scale variability in Antarctic ice- sheet discharge during the last deglaciation,” Nature 510, 134–138 (2014)
2014
-
[48]
A 3.3-Million-Year Record of Antarctic Iceberg Rafted Debris and Ice Sheet Evolution Quantified by Machine Learning,
Claire E. Jasper, Blake Dyer, Brendan T. Reilly, Trevor Williams, Sidney Hemming, and Maureen E. Raymo, “A 3.3-Million-Year Record of Antarctic Iceberg Rafted Debris and Ice Sheet Evolution Quantified by Machine Learning,” Paleoceanography and Paleoclimatology39, e2024PA004897 (2024)
2024
-
[49]
Early Interglacial Legacy of Deglacial Climate Instabil- ity,
Stephen Barker, Gregor Knorr, Stephen Conn, Sian 15 Lordsmith, Dhobasheni Newman, and David Thornalley, “Early Interglacial Legacy of Deglacial Climate Instabil- ity,” Paleoceanography and Paleoclimatology34, 1455– 1475 (2019)
2019
-
[50]
Orbital and Millennial Antarctic Climate Variability over the Past 800,000 Years,
J. Jouzel, V. Masson-Delmotte, O. Cattani, G. Drey- fus, S. Falourd, G. Hoffmann, B. Minster, J. Nouet, J. M. Barnola, J. Chappellaz, H. Fischer, J. C. Gallet, S. Johnsen, M. Leuenberger, L. Loulergue, D. Luethi, H. Oerter, F. Parrenin, G. Raisbeck, D. Raynaud, A. Schilt, J. Schwander, E. Selmo, R. Souchez, R. Spahni, B. Stauffer, J. P. Steffensen, B. Ste...
2007
-
[51]
Marie Bouchet, Ama¨ elle Landais, Antoine Grisart, Fr´ ed´ eric Parrenin, Fr´ ed´ eric Pri´ e, Roxanne Jacob, Elise Fourr´ e, Emilie Capron, Dominique Raynaud, Vladimir Ya Lipenkov, Marie-France Loutre, Thomas Extier, Anders Svensson, Etienne Legrain, Patricia Mar- tinerie, Markus Leuenberger, Wei Jiang, Florian Rit- terbusch, Zheng-Tian Lu, and Guo-Min Y...
2023
-
[52]
Causal in- ference for time series,
Jakob Runge, Andreas Gerhardus, Gherardo Varando, Veronika Eyring, and Gustau Camps-Valls, “Causal in- ference for time series,” Nature Reviews Earth & Envi- ronment4, 487–505 (2023)
2023
-
[53]
Transfer entropy for finite data,
Alec Kirkley, “Transfer entropy for finite data,” Physical Review E112, L052304 (2025)
2025
-
[54]
A multiscale model for multivari- ate time series forecasting,
Vahid Naghashi, Mounir Boukadoum, and Ab- doulaye Banire Diallo, “A multiscale model for multivari- ate time series forecasting,” Scientific Reports15, 1565 (2025)
2025
discussion (0)
Sign in with ORCID, Apple, or X to comment. Anyone can read and Pith papers without signing in.