REVIEW 3 major objections 5 minor 5 references
This paper claims that coherent probabilistic forecasts for hierarchies of hundreds of thousands of retail series can be produced by forecasting only a small set of smooth aggregate series and then probabilistically splitting those forecast
Reviewed by Pith at T0; open to challenge. T0 means a machine referee read the full paper against a public rubric. the ladder, T0–T4 →
e2eTD forecasts a small set of aggregate series and disaggregates them via copula-based historical proportions, producing coherent probabilistic forecasts for huge retail hierarchies in minutes.
T0 review reviewed 2026-08-02 challenge →
load-bearing objection A solid, well-specified methods paper with a compelling accuracy/compute trade-off; the main soft spot is the stationary split-proportion assumption, which is acknowledged but not stress-tested. the 3 major comments →
End-to-end probabilistic hierarchical forecasting of large hierarchies via probabilistic top-down
The pith
A machine-rendered reading of the paper's core claim, the machinery that carries it, and where it could break.
The reading
Core claim
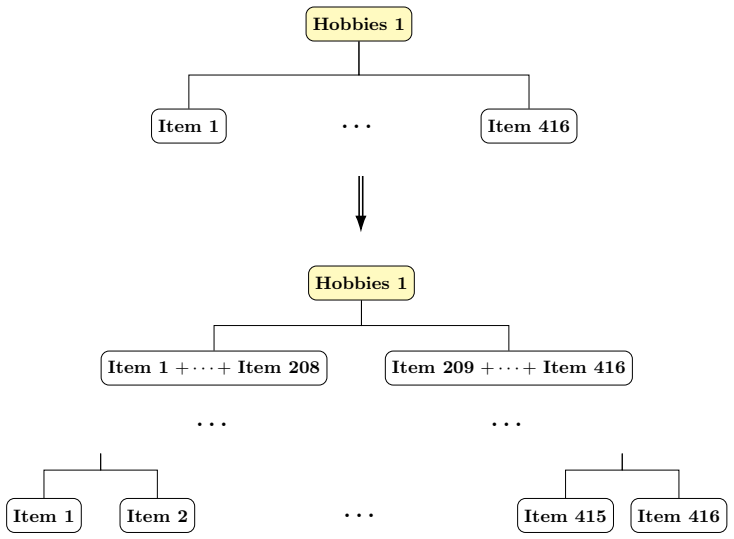
The central claim is that a top-down strategy can be made fully probabilistic and end-to-end: instead of forecasting the noisy bottom series, e2eTD fits univariate probabilistic models to a small subhierarchy of aggregate series, reconciles those upper forecasts, and then disaggregates every sample through a sequence of bivariate splits. At each split the count total is divided between two sibling groups by sampling from the in-sample joint distribution of those groups conditioned on their sum. Because the same sample index is carried through all splits, the bottom samples remain jointly dependent, so summing them gives coherent forecasts for every aggregation level. The empirical claim is t
What carries the argument
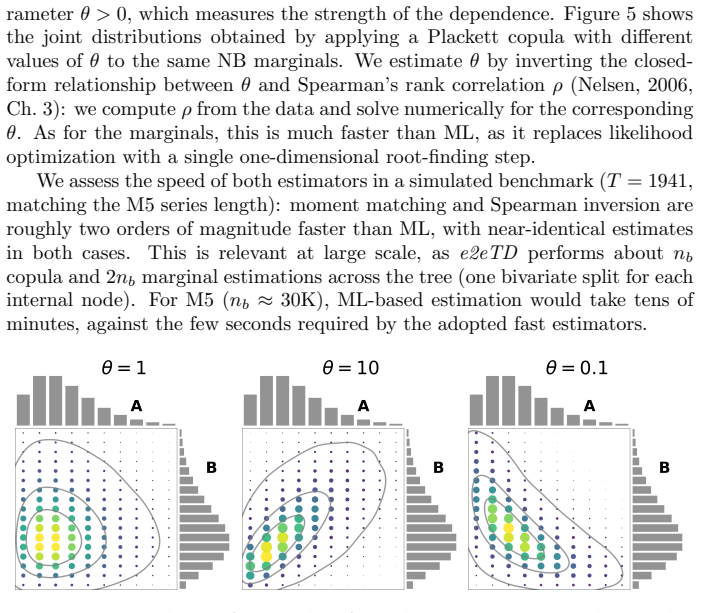
The load-bearing object is the probabilistic top-down sampling algorithm. For a parent total z, the set of feasible splits (a,b) with a+b=z is assigned probability proportional to the historical joint distribution p_{A,B}(a,b), estimated in-sample with Poisson or negative-binomial marginals and a bivariate Plackett copula whose dependence parameter is recovered from Spearman's rank correlation. A hierarchy is traversed by recursively applying this bivariate split along a binary partition of each group's descendants, and the procedure is made fast by computing conditional split weights once per distinct total value, reusing the same joint distributions across all forecast horizons, and parall
Load-bearing premise
The load-bearing premise is that the historical joint distribution of each pair of sibling series, estimated once from in-sample data with a 28-day half-life, remains a valid description of how aggregate counts will split across those siblings over the 28-day forecast horizon; if true split proportions shift, the bottom-level samples and every aggregate built from them will be miscalibrated even when the upper forecasts are perfect.
What would settle it
On a simulated hierarchy with two bottom series whose in-sample split proportion is 50/50 but whose true proportion shifts to 90/10 during the forecast window, run e2eTD and measure the coverage of the 90% predictive interval for each bottom series; if coverage falls well below nominal levels while the aggregate-level intervals remain calibrated, the stationarity of split proportions is the point of failure. Alternatively, use a public dataset with a known assortment change in the test period and compare e2eTD's bottom-level WSPL against a variant that re-estimates proportions on the most rece
If this is right
- At retail scale, coherent probabilistic forecasts no longer require fitting models to the majority of series: cost scales with the number of selected upper series plus the splitting work, so a hierarchy of hundreds of thousands of series can be refreshed on a laptop in minutes.
- Because every sample satisfies the aggregation constraints, decisions at SKU, store, and national levels can be drawn from one consistent predictive distribution, enabling quantile-based replenishment and safety-stock setting at every level.
- Bottom-level intermittency emerges naturally from splitting smooth aggregate forecasts, so the method avoids modeling intermittent bottom series directly while still delivering competitive upper-tail quantiles at the SKU level.
- Ablation results indicate the accuracy gains are concentrated in the probabilistic top-down mechanism rather than in a specific upper-level forecaster: replacing ETS with ARIMA or shrinking the upper subhierarchy degrades accuracy only mildly, whereas removing reconciliation or omitting regressors hurts more.
- If the historical joint distributions remain approximately stationary over the forecast horizon, the paper's results imply that static in-sample distributional information suffices to outperform much heavier end-to-end neural models on major retail benchmarks.
Where Pith is reading between the lines
- Editor's inference: the paper's stationarity assumption suggests a natural stress test—if assortment changes, promotions, or trend shift sibling split proportions within the 28-day horizon, bottom-level calibration should degrade; a time-varying proportion model (e.g., a shorter half-life or a trend in the copula parameter) is the obvious extension the authors leave open.
- Editor's inference: because the method only needs aggregate forecasts, it could be combined with any upper-level forecaster that handles exogenous regressors; one testable extension is plugging a quantile-regression or gradient-boosted forecaster at the top and checking whether the accuracy gap widens or narrows on datasets with strong promotional dynamics.
- Editor's inference: the binary-split reduction means the number of copula fits is roughly twice the number of bottom series, so for hierarchies with millions of series the per-node Plackett fit is the scaling bottleneck to watch; a shared or amortized estimate of the dependence structure would be the natural next step.
- Editor's inference: the paper evaluates only 28-day horizons, but the method's cost structure suggests it would also suit rolling weekly refreshes; a testable claim is that re-estimating the joint distributions every week with a 28-day half-life preserves accuracy while staying within the reported time budget.
Editorial analysis
A structured set of objections, weighed in public.
Referee Report
Summary. The paper proposes e2eTD, a scalable method for coherent probabilistic forecasting of large hierarchical/grouped retail time series. Instead of forecasting all bottom-level series, e2eTD fits univariate ETS models (with exogenous regressors) to a small selected subhierarchy of smooth upper series, reconciles the resulting Gaussian predictive distributions, and propagates integer samples down the hierarchy through a recursive probabilistic top-down algorithm. The split probabilities are obtained from in-sample joint distributions of aggregated sibling series, modeled with Poisson/NB marginals and a Plackett copula. Final coherent forecasts for every level are obtained by bottom-up summation of joint bottom-level samples. On M5 and Favorita, the method reports the lowest mean WSPL among five scalable baselines, a hypothetical 11th place in the M5 Uncertainty competition, and runtimes under 20 minutes on a standard laptop.
Significance. If robust, this is a meaningful practical contribution: e2eTD avoids forecasting intermittent bottom series, is simple and fast, and produces coherent sample paths across very large hierarchies. The manuscript is careful in specifying the algorithm, reports an ablation study, a runtime breakdown, and level-wise evaluation, and compares against several credible baselines. Its principal strengths are transparency and scalability rather than statistical novelty; the top-down split mechanism is new, but its core components (Gaussian reconciliation, count conditioning) build directly on the authors' prior work. The main caveats are the strong stationarity assumption on split distributions and the lack of uncertainty quantification in the empirical comparisons, both of which affect the central 'lowest WSPL across aggregation levels' claim.
major comments (3)
- [§4.2, §5.4, Table 7] The disaggregation engine conditions every bottom sample on a single joint distribution per binary split, estimated once in-sample with a 28-day decay half-life (§4.2). The upper-level ETS forecasts condition on weekday/holiday/SNAP/promotion regressors, but the split distributions do not. Retail disaggregation proportions are likely to vary with weekday and promotions; if they do, bottom-level samples (L10–L12 M5; L10–L16 Favorita) are drawn conditionally on the wrong distribution, and all levels below the lowest reconciled upper series inherit the error even when the reconciled totals are correct. The ablations in §5.4 change copula, reconciliation, subhierarchy, and regressors, but never condition the split on covariates, so they cannot detect this misspecification. Section 6 acknowledges time-varying proportions only as future work. I would like a diagnostic (e.g., holdout split-prop
- [§5.1, Tables 2–4] All WSPL comparisons are on a single 28-day test window with no interval estimate. On Favorita the differences between e2eTD and S-empD are small at several levels (e.g., 0.112 vs 0.114 at L1; 0.225 vs 0.241 at L7) and the mean difference is 0.013. Given that WSPL is an average over tens of thousands of series, a paired bootstrap over series or a multi-window evaluation would establish whether the reported ordering is stable. The hypothetical M5 rank of 11 is likewise a point estimate from one window. This is the main empirical evidence for the paper's central claim, so it needs an uncertainty assessment.
- [§4, step III] Step III draws samples from a Gaussian reconciled distribution and then 'round[s] and clip[s] to zero' the lowest-upper samples before passing them to the top-down sampler. Rounding and clipping alter the sample totals, so the final coherent forecasts are not exactly the reconciled upper forecasts; the magnitude and effect of this distortion is not reported. Since many lowest-upper totals are small counts, the clipping/rounding can be a substantial fraction of the total. Please quantify the distortion (e.g., mean absolute change before/after) and justify that it does not bias the WSPL comparisons, or use a count-consistent reconciliation.
minor comments (5)
- [§5] The number of Monte Carlo samples N per horizon is never stated; this matters for both reproducibility and quantile stability.
- [§5, competing methods] Typo: 'they they produced runtime errors' should be 'they produced runtime errors'.
- [§5.3, Table 5] HINT uses a GPU while all other methods are CPU-only; the paper notes this, but the headline runtime comparison still mixes hardware. Consider reporting a CPU-only time or making the hardware distinction more prominent in the main text.
- [§4.2] The simulated benchmark for moment matching vs ML says 'near-identical estimates' but no details or table are provided; please report the setup and results.
- [§5, Favorita preprocessing] The Favorita preprocessing (removing classes/items with non-integer sales, clamping returns) is sensible for a count-based method, but it transforms the dataset; the text calls Favorita 'the largest publicly available retail dataset' after this filtration, which should be stated more carefully.
Circularity Check
No significant circularity: the empirical claims are evaluated out-of-sample and the self-citations are components, not the basis of the central result.
full rationale
The e2eTD derivation chain is self-contained rather than circular. The upper-level forecasts come from ETS fitted on selected aggregate series, the reconciliation step is a standard Gaussian reconciliation (Zambon et al., 2024a), and the top-down split probabilities are obtained from in-sample joint distributions p_{A,B} with Poisson/NB marginals and a Plackett copula (Sect. 4.1–4.2). These split distributions are estimated once from training data and are not tuned to the target weighted scaled pinball loss; the reported WSPL numbers are computed on held-out test periods (M5 and Favorita, Sect. 5). The self-citations to Zambon et al. (2024a, 2024b, 2024c) are used for method components and related-work comparisons, not as the evidence that e2eTD achieves the claimed accuracy; the central empirical claim stands on external, out-of-sample evaluation against five competing methods and the M5 competition benchmark. The main acknowledged limitation is the approximate-stationarity assumption for bottom-level proportions, stated in Sect. 4.2 and repeated in Sect. 6 ('Our implementation assumes approximate stationarity and uses a simple weighting heuristic... more principled treatments could replace this, for instance by accounting for trend, seasonality, or time-varying parameters'). That is a robustness/generalizability concern, not a circular reduction: the paper does not define its prediction target in terms of its fitted input, nor does it rename a fitted quantity as a prediction. No equation in the paper reduces by construction to its own inputs, and no load-bearing argument depends on an unverified self-citation chain.
Axiom & Free-Parameter Ledger
free parameters (6)
- Per-split marginal parameters (Poisson rate or NB mean + dispersion) =
not reported; one set per split (~2 per split)
- Per-split Plackett copula θ =
not reported; one per split
- Recency half-life =
28 days
- Upper-level forecasting model parameters (ETS/ARIMA + regressors) =
automatic model selection per selected upper series
- Selected subhierarchy levels =
M5 L1–L9; Favorita L1,L2,L3,L5,L8,L9
- Number of probabilistic samples N per horizon =
not stated in the paper
axioms (7)
- domain assumption Selected upper aggregate series are well described by univariate ETS with exogenous regressors and approximately Gaussian forecast distributions.
- domain assumption For each binary split, the joint distribution of the two child series is approximately stationary and captured by Poisson/NB marginals coupled with a Plackett copula, estimated once in-sample.
- domain assumption Rounding and clipping the reconciled Gaussian samples to non-negative integers yields a valid predictive distribution for the lowest upper level.
- domain assumption Recursive binary splitting with pairwise conditional copulas produces a joint bottom-level sample whose cross-series dependence is adequate for the evaluation.
- domain assumption M5/Favorita data preprocessing (especially Favorita integer filtering, negative clamping, zero-sales dropping) does not change the conclusion about the original retail forecasting problem.
- standard math Standard probability results: Sklar's theorem, Plackett copula conditional sampling, Gaussian reconciliation formulas, and conditioning on A+B=z.
- domain assumption The weighted scaled pinball loss implementation matches the M5 Uncertainty competition scoring.
Cite this review
Pith. "Pith review of End-to-end probabilistic hierarchical forecasting of large hierarchies via probabilistic top-down." pith.science (2026). https://pith.science/paper/ZQ5B5N7W
@misc{pith2026260626774,
  author       = {Pith},
  title        = {Pith review of: End-to-end probabilistic hierarchical forecasting of large hierarchies via probabilistic top-down},
  year         = {2026},
  howpublished = {\url{https://pith.science/paper/ZQ5B5N7W}},
  note         = {Machine review of arXiv:2606.26774}
}
read the original abstract
Retail and supply chain operations rely on demand forecasts to drive decisions, from replenishment at the product level to capacity planning at the store level. These forecasts should be probabilistic, to allow risk-aware decisions, and coherent across the aggregation hierarchy, so that decisions taken at different levels are not based on conflicting demand forecasts. Producing such forecasts is computationally demanding; at retail scale, with hierarchies of hundreds of thousands of time series, this cost becomes a primary concern. Existing two-step forecast-then-reconcile procedures and end-to-end neural models scale poorly, rely on restrictive assumptions, or require specialized hardware and engineering effort. We propose e2eTD, a scalable method for coherent probabilistic forecasting of large hierarchical and grouped time series. e2eTD directly forecasts only a small subset of aggregate series (about 0.3\% of the hierarchy in our experiments), which are smoother and thus more predictable than the intermittent bottom series. The resulting forecast samples are propagated to the bottom level through a novel probabilistic top-down sampling algorithm, in which the historical disaggregation proportions are modeled as joint distributions, estimated in-sample. Since the bottom samples retain the cross-series dependence, summing them yields coherent forecasts for all aggregation levels. On the M5 and Favorita datasets, e2eTD achieves the lowest weighted scaled pinball loss across aggregation levels among all competing methods; it would have ranked 11th of 892 teams in the M5 Uncertainty competition. On a standard laptop, e2eTD runs in about five minutes on M5 ($\sim$40K series) and twenty minutes on Favorita ($\sim$300K series).
Figures




Reference graph
Works this paper leans on
-
[5]
Journal of Business & Economic Statistics doi:10.1080/ 07350015.2023.2181176
Probabilistic forecast reconciliation under the gaus- sian framework. Journal of Business & Economic Statistics doi:10.1080/ 07350015.2023.2181176. Wickramasuriya, S.L., Athanasopoulos, G., Hyndman, R.J.,
arXiv 2023
-
[2022]
Retail sales forecasting information systems: comparison between traditional methods and machine learning algorithms, in: Proceedings of the 2022 International Conference Information Systems (IADIS), pp. 30–38. Nelsen, R.B.,
2022
-
[2023]
URL:https://openreview.net/forum?id= xvSqgr3afE
HINT: Hierarchical Coherent Networks For Constrained Probabilis- tic Forecasting, in: ICML 2023 Workshop on Structured Probabilistic Infer- ence & Generative Modeling. URL:https://openreview.net/forum?id= xvSqgr3afE. Olivares, K.G., Meetei, O.N., Ma, R., Reddy, R., Cao, M., Dicker, L.,
2023
-
[2025]
arXiv preprint arXiv:2507.13556
Time series forecastability measures. arXiv preprint arXiv:2507.13556 . Wellens, A.P., Boute, R.N., Udenio, M.,
-
[2026]
URL:https://CRAN.R-project.org/package= Matrix, doi:10.32614/CRAN.package.Matrix
Matrix: Sparse and Dense Ma- trix Classes and Methods. URL:https://CRAN.R-project.org/package= Matrix, doi:10.32614/CRAN.package.Matrix. r package version 1.7-5. Boylan, J.E., Syntetos, A.A.,
This paper was first reviewed by deepseek-v4-flash on August 2, 2026.
discussion (0)
Sign in with ORCID, Apple, or X to comment. Anyone can read and Pith papers without signing in.