First results of sub-arcsecond scale objects identified with ASKAP using interplanetary scintillation
Pith reviewed 2026-06-29 02:21 UTC · model grok-4.3
The pith
ASKAP IPS at 823 MHz separates compact hot spots in radio lobes from nuclear AGN and CSO sources while showing peaked spectra below 1 GHz.
A machine-rendered reading of the paper's core claim, the machinery that carries it, and where it could break.
Core claim
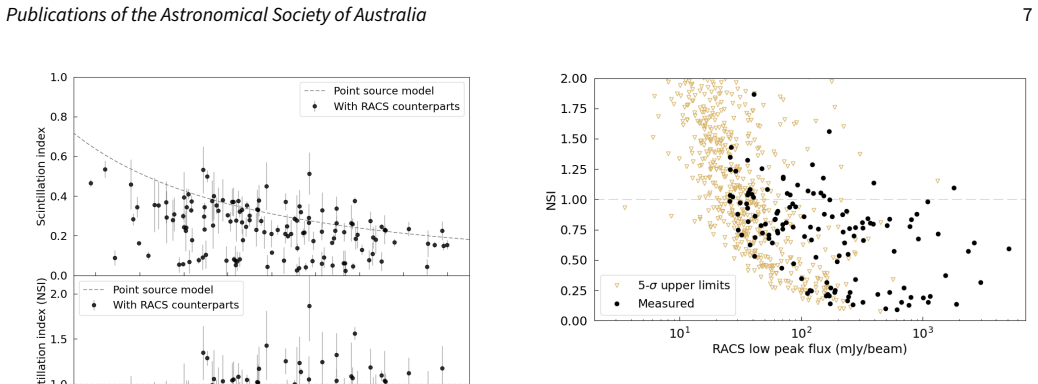
We present a catalogue of 131 compact (≲0.1 arcsec) sources detected at 823 MHz via their Interplanetary Scintillation (IPS). These measurements were made with the ASKAP telescope across its full field of view of 35 square degrees. ASKAP IPS cleanly separates two populations: compact hot spots embedded in extended lobes and IPS-unresolved sources which are AGN or CSO sources associated with the galactic nucleus. We also compare these results with the results from observations of IPS at 162 MHz with the Murchison Widefield Array, providing the spectra of compact components between 162 MHz and 888 MHz. These measurements further re-enforce the dominance of peaked-spectrum SEDs in the compact-s
What carries the argument
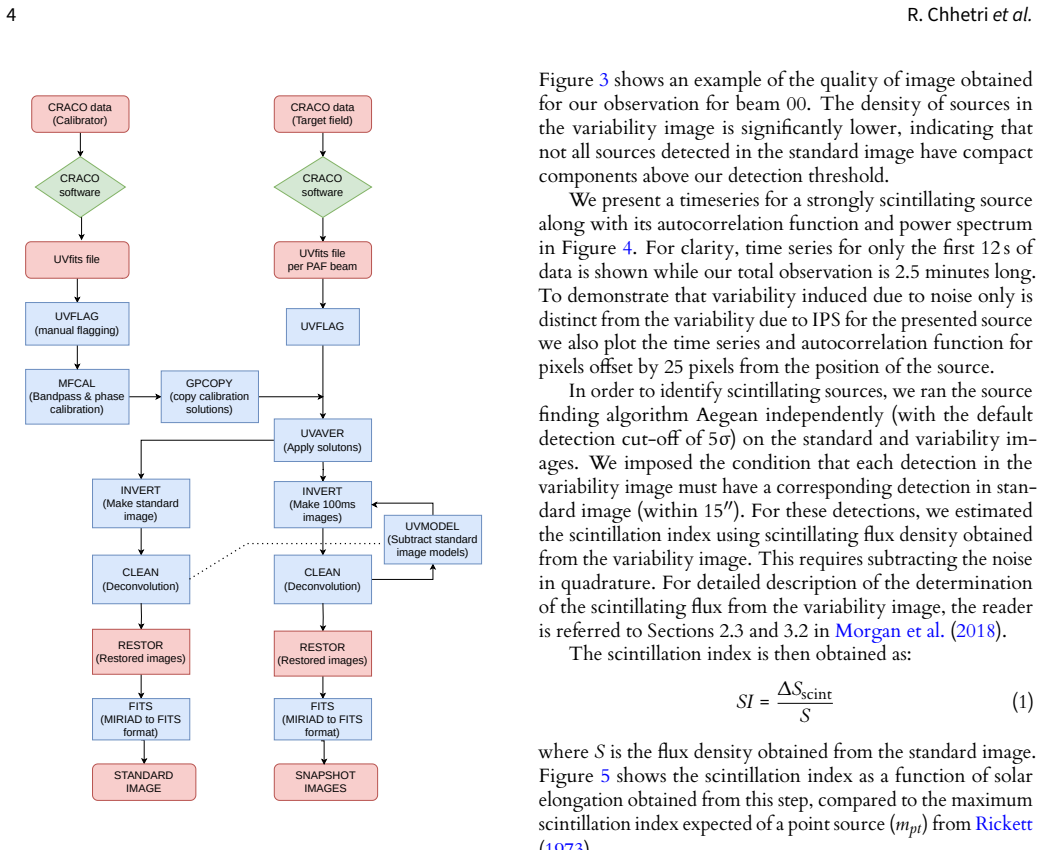
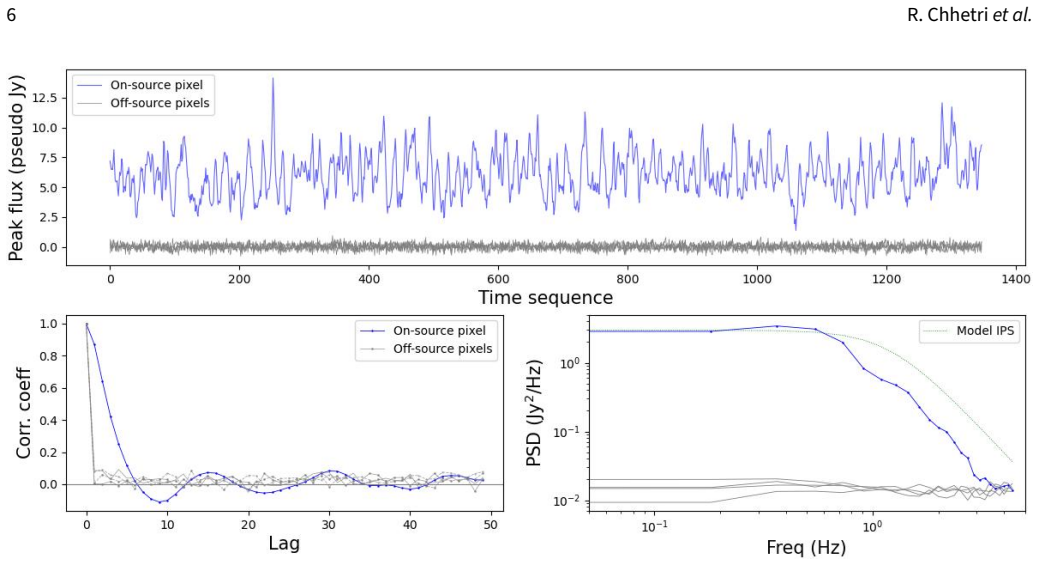
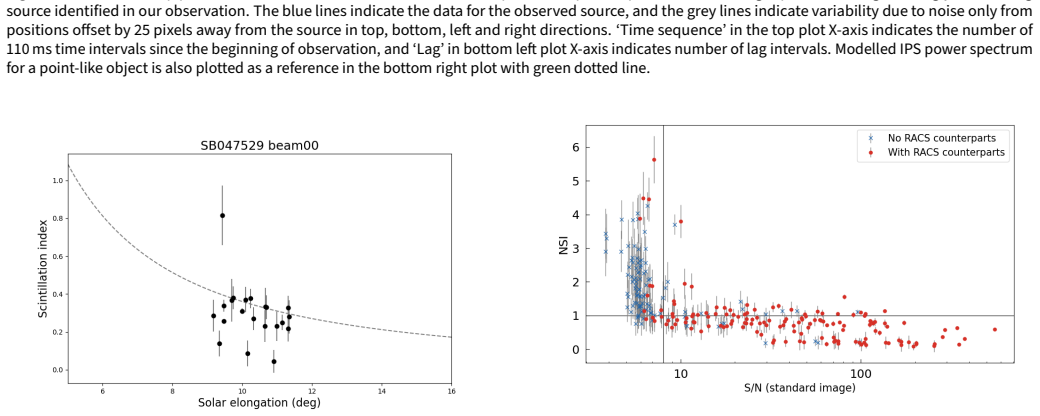
Interplanetary scintillation measured via 110 ms visibilities captured by the CRAFT/CRACO system on ASKAP, which isolates sub-arcsecond structure through rapid intensity variations induced by the solar wind.
If this is right
- The method distinguishes extended-lobe hot spots from nuclear sources in radio galaxies without requiring targeted very-long-baseline observations.
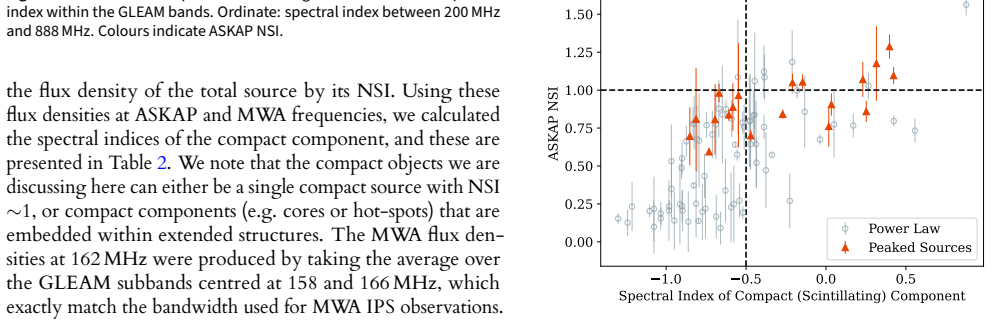
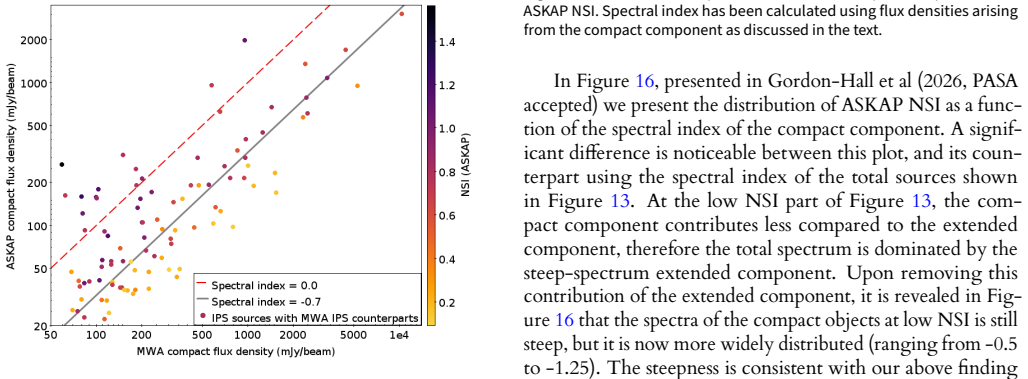
- Spectra of the compact components between 162 and 888 MHz show peaked spectral energy distributions as the dominant form below 1 GHz.
- This pilot enables a larger ASKAP IPS survey to build statistically significant samples of compact radio sources.
- The separation of populations supports studies of radio galaxy evolution by linking compact nuclear sources to early or restarting AGN activity.
Where Pith is reading between the lines
- The technique could flag candidate young or compact symmetric objects for targeted multi-frequency follow-up to measure their turnover frequencies.
- A full survey might reveal spatial clustering of peaked-spectrum sources relative to larger radio lobes, testing evolutionary links between the two populations.
- Extending IPS measurements to other frequencies could map how the compact fraction changes with redshift and environment.
- The approach offers a wide-field complement to VLBI for finding sub-arcsecond structure in future large radio surveys.
Load-bearing premise
The assumption that 110 ms visibilities from the CRAFT/CRACO system combined with standard IPS analysis accurately isolate sub-0.1 arcsec structure without significant contamination from extended emission, calibration residuals, or solar wind variability across the field.
What would settle it
Higher-resolution follow-up imaging that shows a large fraction of the IPS-selected sources exceed 0.1 arcsec in size or fail to exhibit the expected scintillation modulation would falsify the claim that the detections cleanly isolate the compact components.
Figures
read the original abstract
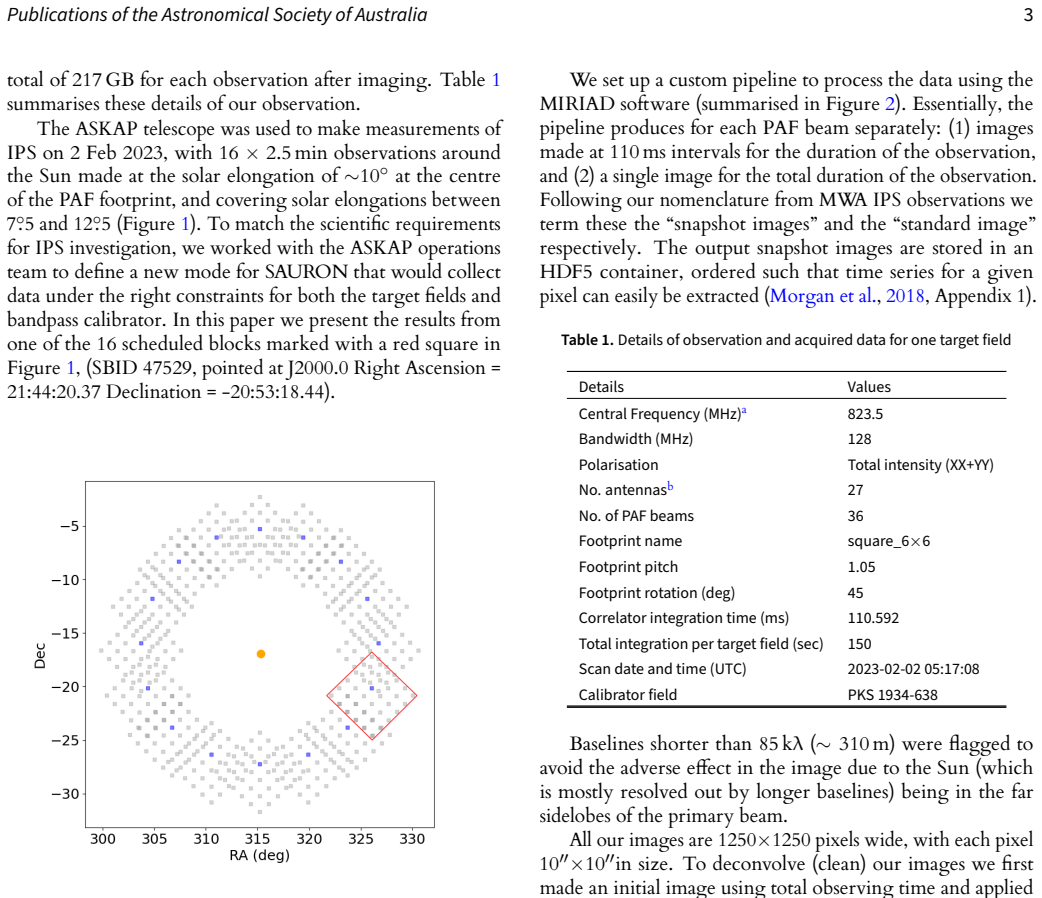
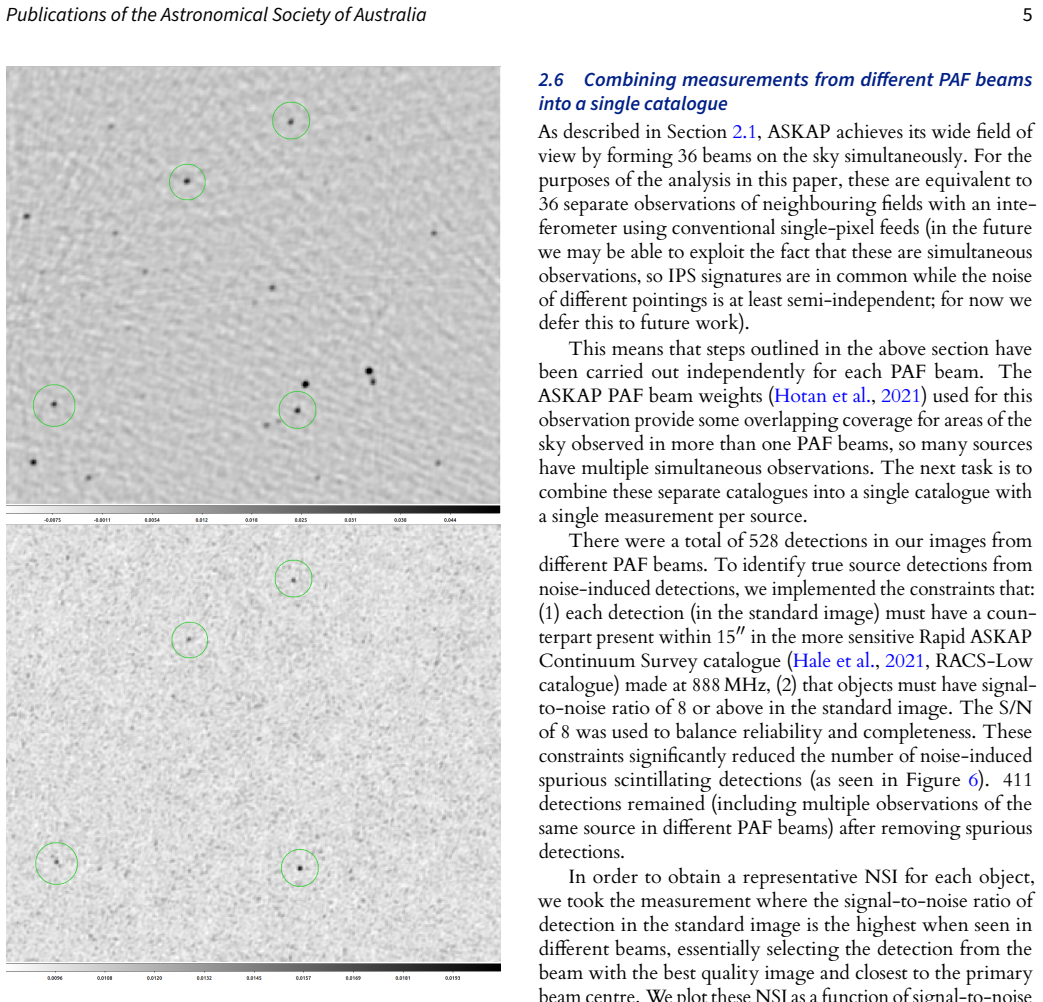
We present a catalogue of 131 compact $(\lesssim 0.1 \,arcsec)$ sources detected at 823 MHz via their Interplanetary Scintillation (IPS). These measurements were made with the ASKAP telescope, across its full field of view of 35 square degrees, utilising all 36 Phased Array Feed (PAF) beams. To bypass ASKAP's standard correlator's minimum integration limit of 10 s, we used the CRAFT data capture system (CRACO), with visibilities sampled every 110 ms. Here we present the data processing steps, the sources detected, and their IPS-inferred properties. ASKAP IPS cleanly separates two populations: compact hot spots embedded in extended lobes and IPS-unresolved sources which are AGN or CSO sources associated with the galactic nucleus. We also compare these results with the results from observations of IPS at 162 MHz with the Murchison Widefield Array, providing the spectra of compact components between 162 MHz and 888 MHz. These measurements further re-enforce the dominance of peaked-spectrum SEDs in the compact-source population at frequencies below 1 GHz. This pilot study using test data is a pathfinder for a more comprehensive ASKAP IPS survey which is underway.
Editorial analysis
A structured set of objections, weighed in public.
Referee Report
Summary. The paper presents a pilot catalogue of 131 compact (lesssim 0.1 arcsec) sources detected at 823 MHz via interplanetary scintillation (IPS) using ASKAP's full 35 sq deg field of view and the CRACO system for 110 ms visibilities. It claims that ASKAP IPS cleanly separates two populations (compact hot spots embedded in extended lobes versus IPS-unresolved AGN/CSO nuclei) and, via comparison to MWA IPS observations at 162 MHz, provides spectra of the compact components between 162 and 888 MHz that reinforce the dominance of peaked-spectrum SEDs below 1 GHz. The work is positioned as a pathfinder for a larger ASKAP IPS survey.
Significance. If the central measurements are robust, the results demonstrate the technical feasibility of wide-field sub-arcsecond IPS imaging with ASKAP and provide new low-frequency spectral constraints on compact radio sources, which could help characterize the population of AGN and compact symmetric objects. The MWA cross-comparison adds value by extending frequency coverage for SEDs.
major comments (2)
- [Abstract] Abstract: the claim that 'ASKAP IPS cleanly separates two populations' rests on unshown processing steps for the 110 ms CRACO visibilities and provides no visible error analysis, validation against known compact sources, or null tests on extended sources; any systematic bias in the scintillation indices directly undermines both the population separation and the spectral conclusions.
- [Abstract] Abstract (data processing steps): the assumption that standard IPS analysis on 110 ms visibilities isolates sub-0.1 arcsec structure without significant leakage from extended emission, calibration residuals, or solar-wind variability across the 35 sq deg field is not quantitatively tested or described, which is load-bearing for the headline separation result.
Simulated Author's Rebuttal
We thank the referee for their constructive review of our pilot ASKAP IPS manuscript. The comments correctly identify areas where the abstract claims would benefit from more explicit supporting material on processing and validation. We address each point below and will revise the manuscript to incorporate the requested details.
read point-by-point responses
-
Referee: [Abstract] Abstract: the claim that 'ASKAP IPS cleanly separates two populations' rests on unshown processing steps for the 110 ms CRACO visibilities and provides no visible error analysis, validation against known compact sources, or null tests on extended sources; any systematic bias in the scintillation indices directly undermines both the population separation and the spectral conclusions.
Authors: We agree that the abstract claim requires visible supporting evidence. The full manuscript describes the CRACO 110 ms visibility processing and IPS index derivation in the methods section. However, we acknowledge the absence of dedicated error analysis, cross-validation against known compact sources, and null tests on extended sources. We will add these elements, including uncertainty estimates on scintillation indices and validation results, to the revised manuscript. revision: yes
-
Referee: [Abstract] Abstract (data processing steps): the assumption that standard IPS analysis on 110 ms visibilities isolates sub-0.1 arcsec structure without significant leakage from extended emission, calibration residuals, or solar-wind variability across the 35 sq deg field is not quantitatively tested or described, which is load-bearing for the headline separation result.
Authors: The manuscript outlines the application of standard IPS analysis to the short-integration visibilities. We accept that quantitative tests for leakage, residuals, and field-wide solar-wind variability are not currently presented at the level requested. In revision we will expand the methods section with quantitative assessments of these effects, including any available simulations or consistency checks across the field. revision: yes
Circularity Check
No significant circularity: purely observational catalogue
full rationale
The paper reports an observational catalogue of 131 compact sources detected via IPS at 823 MHz using ASKAP/CRACO 110 ms visibilities across a 35 sq deg field. It describes processing steps, detected sources, IPS-inferred properties, a direct population separation into compact hot spots vs. unresolved AGN/CSO, and an external comparison to MWA 162 MHz IPS data for spectra. No equations, derivations, fitted parameters, or predictions are presented that reduce by construction to the input data or self-citations. The central claims rest on direct measurements and external benchmarks, making the work self-contained against the listed circularity patterns.
Axiom & Free-Parameter Ledger
axioms (1)
- domain assumption IPS variability on 110 ms timescales reliably traces sub-arcsecond structure when sampled with ASKAP PAF beams.
Reference graph
Works this paper leans on
-
[1]
Aditya, J. N. H. S., Y oon, H., Allison, J. R., et al. 2024, MNRAS, 527, 8511
2024
-
[2]
R., Sadler, E
Allison, J. R., Sadler, E. M., Amaral, A. D., et al. 2022, PASA, 39, e010
2022
-
[3]
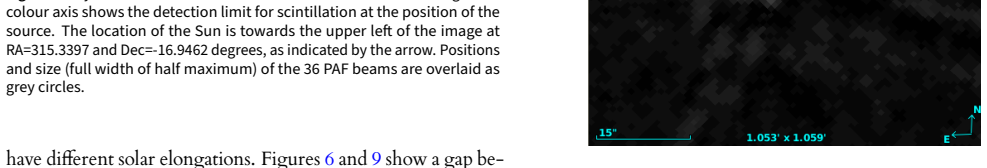
2000, A&AS, 143, 33
Bonnarel, F., Fernique, P., Bienaymé, O., et al. 2000, A&AS, 143, 33
2000
-
[4]
H., Best, P
Brookes, M. H., Best, P. N., Peacock, J. A., Röttgering, H. J. A., & Dunlop, J. S. 2008, MNRAS, 385, 1297
2008
-
[5]
R., Ekers, R
Callingham, J. R., Ekers, R. D., Gaensler, B. M., et al. 2017, ApJ, 836, 174
2017
-
[6]
D., Jones, P
Chhetri, R., Ekers, R. D., Jones, P. A., & Ricci, R. 2013, Monthly Notices of the Royal Astronomical Society, 434, 956
2013
-
[7]
2023, Advances in Space Research, 72, 5361
Chhetri, R., Morgan, J., Moss, V., et al. 2023, Advances in Space Research, 72, 5361
2023
-
[8]
1964, PhD thesis, Cambridge University
Clarke, M. 1964, PhD thesis, Cambridge University
1964
-
[9]
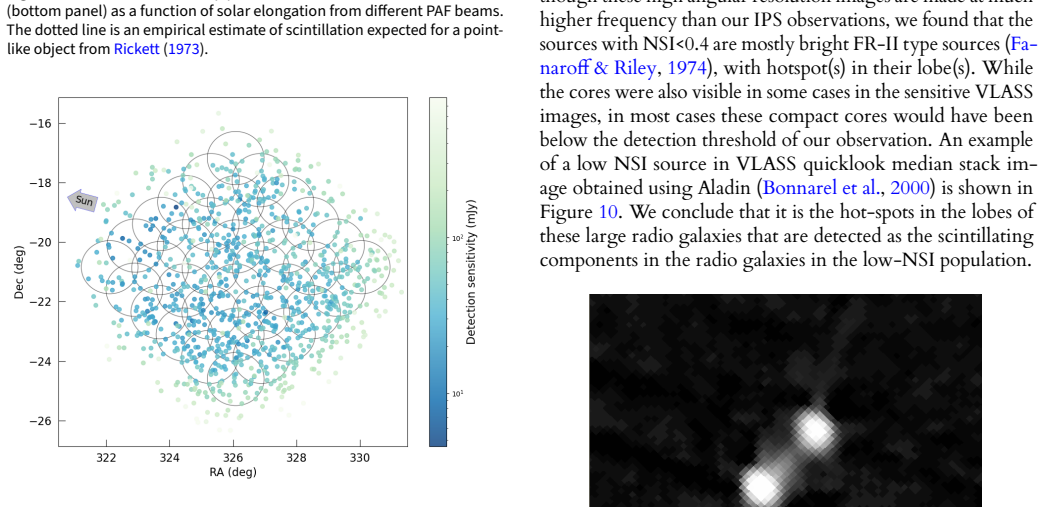
Fanaroff, B. L. & Riley, J. M. 1974, MNRAS, 167, 31P
1974
-
[10]
L., McConnell, D., Thomson, A
Hale, C. L., McConnell, D., Thomson, A. J. M., et al. 2021, Publications of the Astronomical Society of Australia, 38, e058
2021
-
[11]
J., Trott, C
Hancock, P. J., Trott, C. M., & Hurley-Walker, N. 2018, pasa, 35, e011
2018
-
[12]
F., & Wills, D
Hewish, A., Scott, P. F., & Wills, D. 1964, Nature, 203, 1214
1964
-
[13]
W., Bunton, J
Hotan, A. W., Bunton, J. D., Chippendale, A. P., et al. 2021, PASA, 38, e009
2021
-
[14]
R., Hancock, P
Hurley-Walker, N., Callingham, J. R., Hancock, P. J., et al. 2017, MNRAS, 464, 1146
2017
-
[15]
T., Jagannathan, P., Mooley, K
Intema, H. T., Jagannathan, P., Mooley, K. P., & Frail, D. A. 2017, A&A, 598, A78
2017
-
[16]
Jackson, C. A. & Wall, J. V. 1999, Monthly Notices of the Royal Astronomical Society, 304, 160, section 3 (as recommended by Tom): There is strong evolution of high luminosity radio sources (FRII). There is no evolution of low luminosity radio sources (FRI)
1999
-
[17]
2022, A&A, 658, A2
Jackson, N., Badole, S., Morgan, J., et al. 2022, A&A, 658, A2
2022
-
[18]
2007, PASA, 24, 174
Johnston, S., Bailes, M., Bartel, N., et al. 2007, PASA, 24, 174
2007
-
[19]
2008, Experimental Astronomy, 22, 151
Johnston, S., Taylor, R., Bailes, M., et al. 2008, Experimental Astronomy, 22, 151
2008
-
[20]
A., Chandler, C
Lacy, M., Baum, S. A., Chandler, C. J., et al. 2020, PASP, 132, 035001
2020
-
[21]
Macquart, J.-P., Bailes, M., Bhat, N. D. R., et al. 2010, PASA, 27, 272
2010
-
[22]
P., Godfrey, L
McKean, J. P., Godfrey, L. E. H., Vegetti, S., et al. 2016, MNRAS, 463, 3143
2016
-
[23]
I., Waszewski, A., Ekers, R., & Chhetri, R
Morgan, J., McCauley, P. I., Waszewski, A., Ekers, R., & Chhetri, R. 2023, Space Weather, 21, e2022SW003396
2023
-
[24]
S., Chhetri, R., & Ekers, R
Morgan, J. S., Chhetri, R., & Ekers, R. 2022, Publications of the Astronomical Society of Australia, 39, e063
2022
-
[25]
S., Macquart, J
Morgan, J. S., Macquart, J. P., Chhetri, R., et al. 2019, Publications of the Astronomical Society of Australia, 36, e002
2019
-
[26]
S., Macquart, J
Morgan, J. S., Macquart, J. P., Ekers, R., et al. 2018, Monthly Notices of the Royal Astronomical Society, 473, 2965
2018
-
[27]
M., Ekers, R
Murphy, T., Sadler, E. M., Ekers, R. D., et al. 2010, MNRAS, 402, 2403 O’Dea, C. P. 1998, Publications of the Astronomical Society of the Pacific, 110, 493
2010
-
[28]
Petrov, L., Phillips, C., Bertarini, A., Murphy, T., & Sadler, E. M. 2011, MNRAS, 414, 2528
2011
-
[29]
Readhead, A. C. S., Ravi, V., Blandford, R. D., et al. 2024, ApJ, 961, 242
2024
-
[30]
Rickett, B. J. 1973, Journal of Geophysical Research, 78, 1543
1973
-
[31]
J., Teuben, P
Sault, R. J., Teuben, P. J., & Wright, M. C. H. 1995, in Astronomical Society of the Pacific Conference Series, V ol. 77, Astronomical Data Analysis Software and Systems IV, ed. R. A. Shaw, H. E. Payne, & J. J. E. Hayes, 433
1995
-
[32]
W., Röttgering, H
Shimwell, T. W., Röttgering, H. J. A., Best, P. N., et al. 2017, A&A, 598, A104
2017
-
[33]
J., Röttgering, H
Sweijen, F., van Weeren, R. J., Röttgering, H. J. A., et al. 2022, Nature Astronomy, 6, 350
2022
-
[34]
J., Goeke, R., Bowman, J
Tingay, S. J., Goeke, R., Bowman, J. D., et al. 2013, PASA, 30, e007 van Haarlem, M. P., Wise, M. W., Gunst, A. W., et al. 2013, A&A, 556, A2
2013
-
[35]
W., Gupta, V., et al
Wang, Z., Bannister, K. W., Gupta, V., et al. 2025, Publications of the Astronomical Society of Australia, 42, e005
2025
-
[36]
2025, PhD thesis, Curtin University of Technology
Waszewski, A. 2025, PhD thesis, Curtin University of Technology
2025
-
[37]
S., Chhetri, R., et al
Waszewski, A., Morgan, J. S., Chhetri, R., et al. 2023, Space Weather, 21, e2023SW003570
2023
discussion (0)
Sign in with ORCID, Apple, or X to comment. Anyone can read and Pith papers without signing in.