Visualizing High-Dimensional Graph Embeddings via Informed Multi-View Projections
Pith reviewed 2026-07-01 07:03 UTC · model grok-4.3
The pith
Embedding graphs in high dimensions and optimizing 2D projections for readability metrics produces better visualizations than direct 2D layouts.
A machine-rendered reading of the paper's core claim, the machinery that carries it, and where it could break.
Core claim
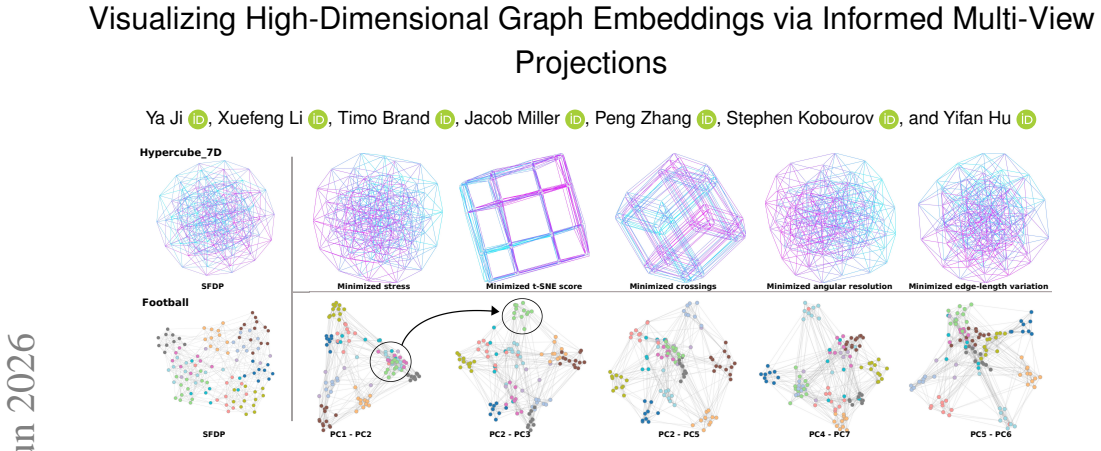
Graphs are embedded in high-dimensional space and informative 2D viewpoints are located by optimizing surrogate aesthetic and readability metrics, including a novel differentiable proxy for edge crossings. These optimized projections consistently outperform standard 2D layouts and can exceed the performance of methods that were explicitly designed to optimize the same metrics. An interactive exploration system, DataFly, supports seamless navigation among multiple candidate viewpoints, and a usability study indicates that the resulting views reveal structural patterns that remain hidden under conventional 2D visualization.
What carries the argument
A novel differentiable surrogate for edge crossings that enables gradient-based optimization of 2D viewpoints drawn from a high-dimensional graph embedding.
If this is right
- The same viewpoint search can surpass layout methods that were hand-designed to minimize the target metrics.
- Multiple candidate viewpoints can be generated and explored interactively without recomputing the embedding.
- Structural patterns that are occluded in any single 2D drawing become visible when users switch among the optimized projections.
Where Pith is reading between the lines
- The approach may extend naturally to other high-dimensional data types such as point clouds or manifolds where direct 2D projection loses structure.
- If the surrogate crossing metric correlates strongly with human perception, the same optimization pipeline could be reused for non-graph datasets.
- The method suggests that the choice of embedding dimension could be treated as a tunable parameter whose effect on downstream projection quality can be measured directly.
Load-bearing premise
A high-dimensional embedding exists whose 2D projections, once optimized on the surrogate metrics, preserve meaningful graph relationships without introducing distorting artifacts.
What would settle it
A controlled experiment in which the metric-optimized projections from high-dimensional embeddings score no better on edge crossings or angular resolution, or yield no improvement in user task performance, compared with standard 2D layout algorithms.
Figures
read the original abstract
Graphs are commonly visualized in 2D, where humans readily interpret spatial relationships, yet such layouts often distort higher-dimensional structure. We propose to embed graphs in high-dimensional space and search for informative 2D viewpoints that optimize aesthetic and readability metrics (e.g., edge crossings and angular resolution), enabled by a novel differentiable surrogate for edge crossings. Numerical experiments show that these viewpoints consistently outperform standard 2D layouts, and can even surpass methods explicitly designed to optimize these metrics. We further introduce DataFly, an interactive system for exploring multiple candidate viewpoints through seamless navigation. A usability study demonstrates that our approach reveals structural patterns that remain hidden in conventional 2D visualizations.
Editorial analysis
A structured set of objections, weighed in public.
Referee Report
Summary. The paper proposes embedding graphs in high-dimensional space and searching for informative 2D viewpoints that optimize aesthetic and readability metrics (e.g., edge crossings and angular resolution) via a novel differentiable surrogate for edge crossings. It claims that numerical experiments show these viewpoints consistently outperform standard 2D layouts and can surpass methods explicitly designed to optimize the metrics. The work also introduces the DataFly interactive system for exploring multiple candidate viewpoints and reports a usability study demonstrating that the approach reveals structural patterns hidden in conventional 2D visualizations.
Significance. If the experimental results hold with proper quantitative validation, the approach could offer a new paradigm for graph visualization by leveraging high-dimensional embeddings and metric-optimized projections, potentially improving interpretability. The differentiable surrogate for edge crossings represents a technical contribution that might enable gradient-based optimization in visualization tasks. However, the absence of any quantitative details, baselines, datasets, or error analysis prevents assessment of whether the central claims are supported.
major comments (1)
- [Abstract] Abstract: The abstract reports outperformance and a usability study but provides no quantitative details, baselines, or error analysis; without the full methods and results sections it is impossible to verify whether the central claim holds or if post-hoc choices affected the comparison.
Simulated Author's Rebuttal
We thank the referee for their review. The major comment concerns the level of detail in the abstract; we address this point below and clarify that the full manuscript supplies the requested quantitative information.
read point-by-point responses
-
Referee: [Abstract] Abstract: The abstract reports outperformance and a usability study but provides no quantitative details, baselines, or error analysis; without the full methods and results sections it is impossible to verify whether the central claim holds or if post-hoc choices affected the comparison.
Authors: Abstracts are intentionally concise summaries. The full manuscript contains a Methods section describing the high-dimensional embedding procedure and the differentiable edge-crossing surrogate, followed by an Experiments section that reports quantitative results on multiple graph datasets. These include explicit baselines (standard force-directed layouts and dedicated metric-optimization algorithms), measured values for edge crossings, angular resolution, and other aesthetics, together with statistical comparisons and error bars. The usability study section likewise details participant tasks, quantitative preference scores, and qualitative feedback. All comparisons were pre-specified; no post-hoc selection is described. revision: no
Circularity Check
No significant circularity identified
full rationale
The provided abstract and context contain no equations, fitting procedures, self-citations, or derivation steps that reduce a claimed result to its own inputs by construction. The novel differentiable surrogate and multi-view projections are presented as methodological contributions validated by experiments, with no visible self-definitional loops, fitted inputs renamed as predictions, or load-bearing self-citations. The central claims rest on empirical comparison rather than any internal reduction to prior fitted values or ansatzes from the same authors.
Axiom & Free-Parameter Ledger
Reference graph
Works this paper leans on
-
[1]
Ahmed, F
R. Ahmed, F. De Luca, S. Devkota, S. Kobourov, and M. Li. Multicriteria scalable graph drawing via stochastic gradient descent, (SGD)2.IEEE Transactions on Visualization and Computer Graphics, 28(6):2388–2399,
-
[2]
doi: 10.1109/TVCG.2022.3155564 2, 4, 6
-
[3]
E. Argyriou, M. Bekos, and A. Symvonis. Maximizing the total resolution of graphs. In U. Brandes and S. Cornelsen, eds.,Graph Drawing, vol. 6502 ofLecture Notes in Computer Science, pp. 62–67. Springer, 2011. doi: 10.1007/978-3-642-18469-7_6 2
-
[4]
G. D. Battista, A. Garg, G. Liotta, R. Tamassia, E. Tassinari, and F. Vargiu. An experimental comparison of four graph drawing algorithms.CGTA: Computational Geometry: Theory and Applications, 7:303–325, 1997. doi: 10.1016/S0925-7721(96)00005-3 4
-
[5]
M. Behrisch, B. Bach, M. Hund, M. Delz, L. von R"uden, J.-D. Fekete et al. Magnostics: Image-based search of interesting matrix views for guided network exploration.IEEE Transactions on Visualization and Computer Graphics, 23(1):31–40, 2017. doi: 10.1109/TVCG.2016.2598467 18
-
[6]
M. A. Bekos, H. Förster, C. Geckeler, L. Holländer, M. Kaufmann, A. M. Spallek et al. A heuristic approach towards drawings of graphs with high crossing resolution.The Computer Journal, 64(1):7–26, 2021. doi: 10. 1093/COMJNL/BXZ133 2
2021
-
[7]
E. Bertini and G. Santucci. Visual quality metrics. InProceedings of the 2006 AVI Workshop on BEyond Time and Errors: Novel Evaluation Methods for Information Visualization (BELIV), pp. 1–5. ACM, Venice, Italy, 2006. doi: 10.1145/1168149.1168159 18
-
[8]
Computer Graphics Forum28(2), 407–416 (2009).https://doi.org/10
A. Bezerianos, F. Chevalier, P. Dragicevic, N. Elmqvist, and J.-D. Fekete. Graphdice: A system for exploring multivariate social networks.Computer Graphics Forum, 29(3):863–872, 2010. doi: 10.1111/j.1467-8659.2009. 01687.x 2
-
[9]
U. Brandes and C. Pich. Eigensolver methods for progressive multidimen- sional scaling of large data. InProc. 14th Intl. Symp. Graph Drawing (GD ’06), vol. 4372 ofLNCS, pp. 42–53, 2007. doi: 10.1007/978-3-540-70904 -6_6 3
-
[10]
A. Buja, D. Cook, and D. F. Swayne. Interactive high-dimensional data visualization.Journal of Computational and Graphical Statistics, 5(1):78– 99, 1996. doi: 10.1080/10618600.1996.10474696 2
-
[11]
Castelein, Z
W. Castelein, Z. Tian, T. Mchedlidze, and A. C. Telea. Viewpoint- based quality for analyzing and exploring 3d multidimensional projec- tions. InVISIGRAPP (3: IVAPP), pp. 65–76, 2023. doi: 10.5220/ 0011652800003417 2
2023
-
[12]
Chimani, P
M. Chimani, P. Eades, P. Eades, S.-H. Hong, W. Huang, K. Klein et al. People prefer less stress and fewer crossings. In C. Duncan and A. Symvonis, eds.,Graph Drawing, vol. 8871 ofLNCS, pp. 523–524. Springer, 2014. 3
2014
-
[13]
Chimani, C
M. Chimani, C. Gutwenger, M. Jünger, G. W. Klau, K. Klein, and P. Mutzel. The open graph drawing framework (ogdf). In R. Tamas- sia, ed.,Handbook of Graph Drawing and Visualization, chap. 17, pp. 443–505. CRC Press, 2014. 3
2014
-
[14]
D. Cook, A. Buja, J. Cabrera, and C. Hurley. Grand tour and projection pursuit.Journal of Computational and Graphical Statistics, 4(3):155–172,
-
[15]
doi: 10.2307/1390769 2, 18
-
[16]
Cutura, S
R. Cutura, S. Holzer, M. Aupetit, and M. Sedlmair. Viscoder: A tool for visually comparing dimensionality reduction algorithms. InEuro. Symp. Artificial Neural Networks, Computational Intelligence and Ma- chine Learning, pp. 641–646, 4 2018. 2
2018
-
[17]
T. N. Dang and L. Wilkinson. Scagexplorer: Exploring scatterplots by their scagnostics. InProceedings of the IEEE Pacific Visualization Sympo- sium (PacificVis), pp. 73–80. IEEE, 2014. doi: 10.1109/PacificVis.2014. 6787139 2
-
[18]
T. Davis and Y . Hu. University of Florida Sparse Matrix Collection.ACM Transactions on Mathematical Software, 38:1–25, 2011. http://www. cise.ufl.edu/research/sparse/matrices/. doi: 10.1145/ 2049662.2049663 4
-
[19]
Devkota, R
S. Devkota, R. Ahmed, F. De Luca, K. E. Isaacs, and S. Kobourov. Stress- plus-x (SPX) graph layout. InProf. Springer International Symposium on Graph Drawing and Network Visualization, pp. 291–304, 2019. doi: 10. 1007/978-3-030-35802-0_23 2
2019
-
[20]
W. Didimo, G. Liotta, and S. Romeo. Topology-driven force-directed algorithms.Proc. of GD 2010, 6502:165–176, 09 2010. doi: 10.1007/978 -3-642-18469-7_15 2
work page doi:10.1007/978 2010
-
[21]
Dwyer, B
T. Dwyer, B. Lee, D. Fisher, K. I. Quinn, P. Isenberg, G. Robertson et al. A comparison of user-generated and automatic graph layouts.IEEE Transactions on Visualization and Computer Graphics, 15(6):961–968,
-
[22]
doi: 10.1109/TVCG.2009.109 6
-
[23]
P. Eades. A heuristic for graph drawing.Congressus Numerantium, 42:149–160, 1984. 2, 4
1984
-
[24]
M. Espadoto, R. M. Martins, A. Kerren, N. S. T. Hirata, and A. C. Telea. Toward a quantitative survey of dimension reduction techniques.IEEE Trans. Vis. Comput. Graph., 27(3):2153–2173, 2021. doi: 10.1109/TVCG. 2019.2944182 2
-
[25]
Fixed-rate compressed floating-point arrays,
R. Etemadpour, R. C. da Motta, J. G. de Souza Paiva, R. Minghim, M. C. F. de Oliveira, and L. Linsen. Perception-based evaluation of projection methods for multidimensional data visualization.IEEE Transactions on Visualization and Computer Graphics, 21(1):81–94, 2015. doi: 10. 1109/TVCG.2014.2346451 2
-
[26]
T. M. J. Fruchterman and E. M. Reingold. Graph drawing by force directed placement.Software - Practice and Experience, 21:1129–1164, 1991. doi: 10.1002/spe.4380211102 2, 4
-
[27]
Gaertler and M
M. Gaertler and M. Krug. Flying through a graph’s spectrum. In13th International Symposium (GD), pp. 528—-531, 2005. 2
2005
-
[28]
P. Gajer, M. T. Goodrich, and S. G. Kobourov. A multi-dimensional approach to force-directed layouts of large graphs. In J. Marks, ed.,Graph Drawing - 8th International Symposium, GD 2000, Proceedings, vol. 1984 ofLNCS, pp. 211–221. Springer-Verlag, 2001. doi: 10.1007/3-540-44541 -2_20 1, 2, 4
-
[29]
E. R. Gansner, Y . Koren, and S. North. Graph drawing by stress majoriza- tion. InProc. Springer International Symposium on Graph Drawing, pp. 239–250, 2004. doi: 10.1007/978-3-540-31843-9_25 2, 4
-
[30]
E. R. Gansner, Y . Koren, and S. C. North. Graph drawing by stress majorization. InProc. 12th Intl. Symp. Graph Drawing (GD ’04), vol. 3383 ofLNCS, pp. 239–250. Springer, 2004. doi: 10.1007/978-3-540 -31843-9_25 3
-
[31]
Goodfellow, Y
I. Goodfellow, Y . Bengio, and A. Courville.Deep Learning. MIT Press,
-
[32]
R. Gove. Gragnostics: Fast, interpretable features for comparing graphs. In23rd International Conference on Information Visualisation (IV), pp. 201–209. IEEE, 2019. doi: 10.1109/IV.2019.00042 18
-
[33]
http://graphviz.org
Graphviz. http://graphviz.org. 3
-
[34]
Hagberg, P
A. Hagberg, P. Swart, and D. Chult. Exploring network structure, dy- namics, and function using networkx. 01 2008. doi: doi.org/10.25080/ tcwv9851 3
2008
-
[35]
K. M. Hall. An r-dimensional quadratic placement algorithm.Manage- ment Science, 17:219–229, 1970. doi: 10.1287/mnsc.17.3.219 3
-
[36]
N. Henry, J.-D. Fekete, and M. J. McGuffin. NodeTrix: A hybrid visualiza- tion of social networks.IEEE Transactions on Visualization and Computer Graphics, 13(6):1302–1309, 2007. doi: 10.1109/TVCG.2007.70582 18
-
[37]
Hotelling
H. Hotelling. Analysis of a complex of statistical variables into principal components.Journal of Educational Psychology, 24:417–441, 498–520,
-
[38]
doi: 10.1037/h0071325 5, 7
-
[39]
Y . Hu. Efficient and high quality force-directed graph drawing.Mathe- matica Journal, 10:37–71, 2005. 3
2005
-
[40]
Y . Hu. Algorithms for visualizing large networks. In U. Naumann and O. Schenk, eds.,Combinatorial Scientific Computing, pp. 525–549. CRC Press, 2012. 3
2012
-
[41]
M. Y . Huh and K. Kim. Visualization of multidimensional data using modifications of the grand tour.Journal of Applied Statistics, 29(5):721– 728, 2002. doi: 10.1080/02664760120098784 2
-
[42]
The relativistic discriminator: a key element missing from standard GAN
A. Jolicoeur-Martineau. The relativistic discriminator: a key element missing from standard gan.arXiv preprint arXiv:1807.00734, 2018. 6
work page internal anchor Pith review Pith/arXiv arXiv 2018
-
[43]
L. Joos, G. J. Mooney, M. T. Fischer, D. A. Keim, F. Schreiber, H. C. Purchase et al. Show me your best side: Characteristics of user-preferred perspectives for 3d graph drawings. In33rd International Symposium on Graph Drawing and Network Visualization (GD 2025), vol. 357 ofLeibniz International Proceedings in Informatics (LIPIcs), pp. 37:1–37:19. Schlos...
-
[44]
Kamada and S
T. Kamada and S. Kawai. An algorithm for drawing general undirected graphs.Information Processing Letters, 31(1):7–15, 1989. doi: 10.1016/ 0020-0190(89)90102-6 2 10
1989
-
[45]
D. P. Kingma and J. Ba. Adam: A method for stochastic optimization. arXiv preprint arXiv:1412.6980, 2014. 4
work page internal anchor Pith review Pith/arXiv arXiv 2014
-
[46]
S. G. Kobourov. Force-directed drawing algorithms.Handbook of Graph Drawing and Visualization, pp. 383–408, 2013. doi: 10.1201/b15385-15 2, 3
-
[47]
Y . Koren. On spectral graph drawing. InCOCOON, 2003. doi: 10. 1007/3-540-45071-8_50 1
2003
-
[48]
J. B. Kruskal. Multidimensional scaling by optimizing goodness of fit to a nonmetric hypothesis.Psychometrika, 29:1–27, 1964. doi: 10.1007/ BF02289565 9
1964
-
[49]
U. Laa. High-dimensional data visualisation with the grand tour. In EPJ Web of Conferences, vol. 245, p. 06018. EDP Sciences, 2020. 24th International Conference on Computing in High Energy and Nuclear Physics (CHEP 2019), Section 6 - Physics Analysis, 6 pages, published online 16 November 2020. doi: 10.1051/epjconf/202024506018 2
-
[50]
M. Li, Z. Zhao, and C. Scheidegger. Visualizing neural networks with the grand tour.Distill, 2020. https://distill.pub/2020/grand-tour. doi: 10. 23915/distill.00025 2
2020
-
[51]
L. v. Maaten and G. Hinton. Visualizing data using t-SNE.Journal of Machine Learning Research, 9:2579–2605, 2008. 3, 9
2008
-
[52]
R. M. Martins, H. Heberle, G. Andery, F. Paulovich, et al. Multidi- mensional projections for visual analysis of social networks.Journal of Computer Science and Technology, 27(4):791–810, July 2012. doi: 10. 1007/s11390-012-1265-5 2
2012
-
[53]
UMAP: Uniform Manifold Approximation and Projection for Dimension Reduction
L. McInnes, J. Healy, and J. Melville. Umap: Uniform manifold approximation and projection for dimension reduction, 2018. cite arxiv:1802.03426Comment: Reference implementation available at http://github.com/lmcinnes/umap. 9
work page internal anchor Pith review Pith/arXiv arXiv 2018
-
[54]
G. J. Mooney, J. Miller, M. Wybrow, S. Kobourov, and H. C. Purchase. Stress in graph drawings: Perception, preference, and performance. In33rd International Symposium on Graph Drawing and Network Visualization (GD 2025), vol. 357 ofLeibniz International Proceedings in Informat- ics (LIPIcs), pp. 38:1–38:23. Schloss Dagstuhl – Leibniz-Zentrum für Informati...
-
[55]
Morariu, A
C. Morariu, A. Bibal, R. Cutura, B. Frénay, and M. Sedlmair. Predicting user preferences of dimensionality reduction embedding quality.IEEE Transactions on Visualization and Computer Graphics, 29(1):745–755,
-
[56]
doi: 10.1109/TVCG.2022.3209449 2
- [57]
-
[58]
F. V . Paulovich, A. Arleo, and S. van den Elzen. When dimensionality re- duction meets graph (drawing) theory: Introducing a common framework, challenges and opportunities.Computer Graphics Forum, 44(3):e70105,
-
[59]
doi: 10.1111/cgf.70105 2
-
[60]
H. C. Purchase. Which aesthetic has the greatest effect on human under- standing? In G. DiBattista, ed.,Proc. 5th Intl. Symp. Graph Drawing (GD ’97), vol. 1353 ofLNCS, pp. 248–261. Springer-Verlag, 1997. doi: 10.1007/3-540-63938-1_67 6
-
[62]
M. Radermacher, K. Reichard, I. Rutter, and D. Wagner. Geometric heuristics for rectilinear crossing minimization.Journal of Experimental Algorithmics (JEA), 24:1–21, 2019. doi: 10.1145/3325861 2, 6, 7
-
[63]
K. Smelser, K. Gunaratne, J. Miller, and S. Kobourov. How scale breaks “normalized stress” and KL divergence: Rethinking quality metrics.IEEE Transactions on Visualization and Computer Graphics, 2026. doi: 10. 1109/TVCG.2026.3657654 3
-
[64]
Embedding Projector: Interactive Visualization and Interpretation of Embeddings
D. Smilkov, N. Thorat, C. Nicholson, E. Reif, F. B. Viégas, and M. Wat- tenberg. Embedding projector: Interactive visualization and interpretation of embeddings.arXiv preprint arXiv:1611.05469, 2016. 2
work page internal anchor Pith review Pith/arXiv arXiv 2016
-
[65]
W. C. Ticona, N. Boukhelifa, and E. Lutton. Evographdice: Interactive evolution for visual analytics. InProceedings of the IEEE Congress on Evolutionary Computation, pp. 1–8, 2012. doi: 10.1109/CEC.2012. 6256553 2
-
[66]
W. S. Torgerson. Multidimensional scaling: I. theory and method.Psy- chometrika, 17:401–419, 1952. doi: 10.1007/BF02288916 3
-
[67]
W. Tutte. How to draw a graph.Proceedings of the London Mathematical Society, 13:743–768, 1963. 2
1963
-
[68]
S. van Wageningen, T. Mchedlidze, and A. C. Telea. Viewpoint optimiza- tion for 3d graph drawings.Computer Graphics Forum, 44(3), 2025. doi: 10.1111/CGF.70127 1, 2
-
[69]
X. Wang, K. Yen, Y . Hu, and H.-W. Shen. DeepGD: A deep learning framework for graph drawing using GNN.IEEE Computer Graphics and Applications, 41(5):32–44, 2021. doi: 10.1109/MCG.2021.3093908 4
- [70]
-
[71]
M. Wattenberg. Visual exploration of multivariate graphs. InProceedings of the international conference on human factors in computing systems (CHI’06), pp. 811–819, 2006. doi: 10.1145/1124772.1124891 1
-
[72]
Wiese, M
R. Wiese, M. Eiglsperger, and M. Kaufmann.yFiles — Visualization and Automatic Layout of Graphs, pp. 173–191. Springer Berlin Heidelberg,
-
[73]
J. X. Zheng, S. Pawar, and D. M. Goodman. Graph drawing by stochas- tic gradient descent.IEEE Transactions on Visualization and Com- puter Graphics, 25(09):2738–2748, sep 2019. doi: 10.1109/TVCG.2018. 2859997 2 11 APPENDIX A1 DIFFERENTIABLE SURROGATE FUNCTION FOR EDGE CROSSING We define a differentiable approximation for detecting whether two edges inters...
discussion (0)
Sign in with ORCID, Apple, or X to comment. Anyone can read and Pith papers without signing in.