REVIEW 3 major objections 6 minor 25 references
How Environment and Urbanization Shape Bird Diversity in Sri Lanka
T0 review · 3 major / 6 minor · reviewed 2026-07-12 · grok-4.5
Pith's one-line read Land-cover type predicts Sri Lankan bird richness better than greenness or climate alone; night lights favor a few generalists.
desk verdict Solid national multi-driver synthesis for Sri Lankan birds; H1 ranking of land cover over NDVI is directionally supported but residual effort and spatial autocorrelation keep the ecological claim modest. read the letter →
The pith
A machine-rendered reading of the paper's core claim, the machinery that carries it, and where it could break.
The reading
What carries the argument
Negative Binomial GLM on spatially thinned 5 km cells that jointly includes modal IGBP land-cover class, NDVI, mean temperature, aerosol terms, and ALAN, with hold-out Spearman rank agreement and district-level evenness/dominance metrics as the interpretive bridge for urbanization.
What would settle it
Repeat the same integrative Negative Binomial pipeline after adding checklist duration or full occupancy models with detectability; if land-cover contrasts lose significance or reverse while residual Moran’s I and effort terms absorb the signal, the claim that habitat class outranks continuous greenness as an ecological driver fails.
Extended reading notes
Core claim
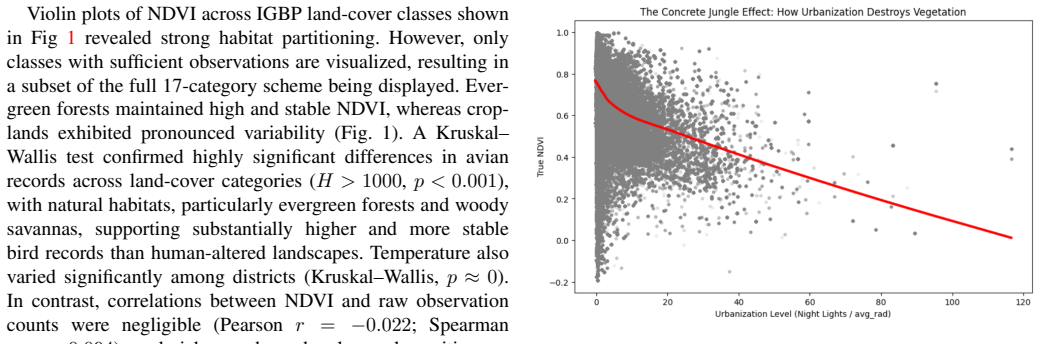
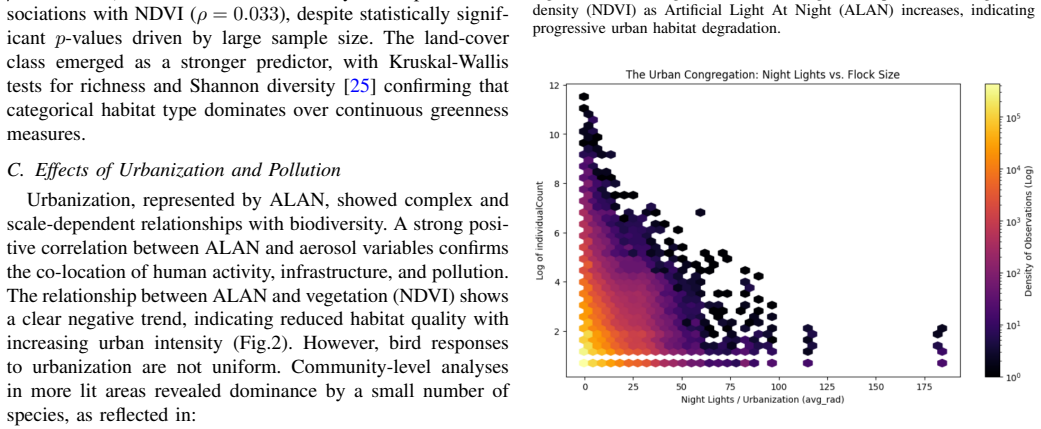
Land-cover type is a stronger predictor of cell-level bird species richness in Sri Lanka than continuous variables such as NDVI or temperature alone. In joint models, contrasts relative to evergreen broadleaf forest show lower expected richness for woody savannas, cropland, and cropland/natural mosaics; after land-cover adjustment, NDVI’s partial association is modest and negative. Artificial light at night tracks reduced community evenness and dominance by generalists at the district scale, while its positive cell-level richness coefficient collapses once checklist density is controlled.
Load-bearing premise
That one-observation-per-species-per-cell thinning, equal-cell rarefaction, and optional checklist-density controls are enough to turn citizen-science counts into ecological associations rather than maps of where people look for birds.
Signed reviews
Editorial analysis
A structured set of objections, weighed in public.
Referee Report
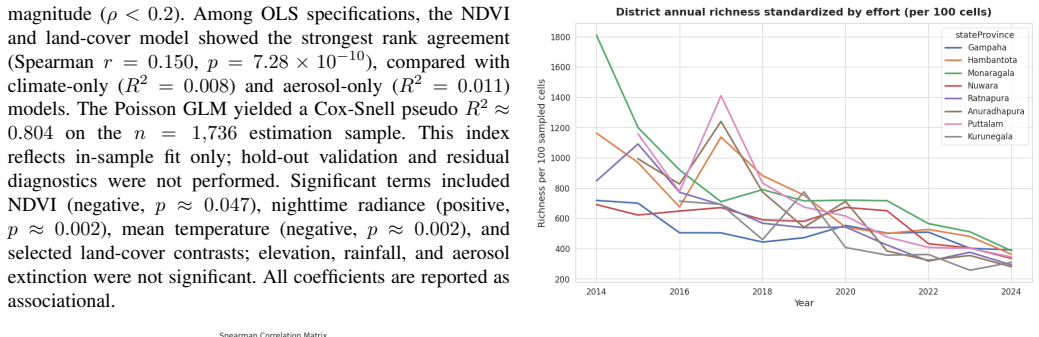
Summary. This manuscript integrates eBird/GBIF bird occurrence records (2014–2024) for Sri Lanka with remote-sensing and reanalysis products (MODIS NDVI and IGBP land cover, VIIRS ALAN, MERRA-2 climate/aerosols, SRTM elevation). After spatial thinning on 2/5/10 km grids and effort-corrected temporal metrics (rarefied richness, occupancy on a stable panel), the authors fit driver-family and integrative Negative Binomial GLMs on cell-level species richness (n = 1,736 cells at 5 km). They report that modal land-cover type is a stronger associate of richness than continuous NDVI or climate alone (H1), that ALAN is linked to reduced district-level evenness rather than cell-level richness after effort adjustment (H2), and that thinned species inventories are stable across grid resolutions (H3). Hold-out Spearman ρ ≈ 0.20 for the integrative model; McFadden pseudo-R² is near zero. Data and code are stated to be public.
Significance. A nationwide, multi-driver associational analysis of avian richness for Sri Lanka is useful given the island’s ecological heterogeneity and data constraints. The pipeline is transparent: multi-scale thinning, rarefaction, explicit comparison of habitat vs climate vs pollution vs urbanization families, Negative Binomial handling of overdispersion, and a checklist-density sensitivity check that correctly attenuates the ALAN term. Public data/code and multi-scale sensitivity are genuine strengths for reproducibility. If the land-cover ranking survives residual spatial and effort structure, the work would support landscape-scale conservation prioritization of evergreen forest and woody savanna relative to cropland mosaics. The contribution is primarily empirical and methodological rather than theoretical.
major comments (3)
- §IV-D / §V-A (H1): The claim that land cover is a stronger predictor than NDVI/climate rests on marginal ρ (0.081 vs 0.033), habitat-module Spearman ρ ≈ 0.150, and NB contrasts (classes 8, 12, 14 lower than evergreen forest reference). Moran’s I = 0.28 (p = 0.005) on Pearson residuals shows residual spatial autocorrelation; no SAR, GEE, or spatial random-effect model is reported. Land-cover classes also co-vary with the coastal sampling concentration (≈56% of records). Without a spatial model or a stronger effort covariate in the primary richness GLM, the land-cover ranking may partly reflect residual accessibility rather than habitat structure—the same confound the authors correctly document for ALAN (β falls from 0.066 to 0.009, p = 0.60 when checklist density is added). A spatial model or explicit residual-effort sensitivity for land-cover contrasts is needed before H1 can be treated
- §III-B / §IV-D: The primary richness model does not include checklist duration or a detectability correction; occupancy models are explicitly not fit. Spatial thinning (one observation per species per cell per district) and equal-cell rarefaction reduce but do not eliminate effort bias. Because the ALAN term collapses under checklist density, the same sensitivity should be reported for the land-cover contrasts that carry H1. If those contrasts also attenuate, the central ranking is not robust.
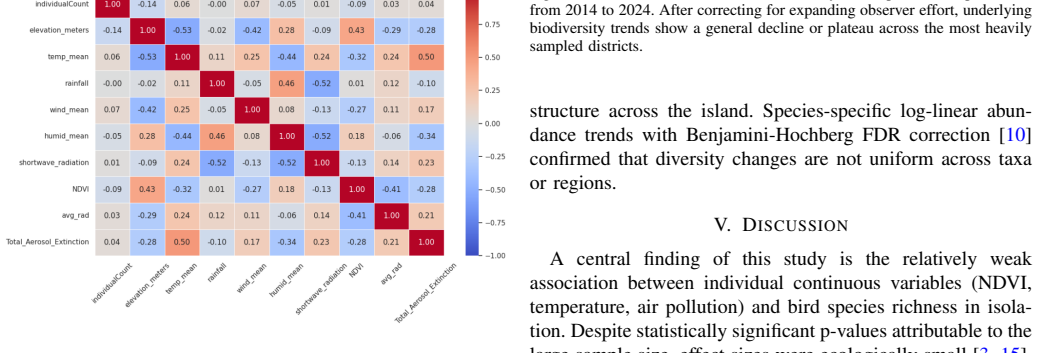
- §IV-D model skill: Hold-out Spearman ρ ≈ 0.20 and McFadden pseudo-R² ≈ 0.003 indicate very weak explanatory power. Climate- and aerosol-only R² ≈ 0.008–0.011. The abstract and conclusion still frame land cover as a “stronger predictor” and offer “actionable insights.” Language should be tightened to “stronger rank association among weak predictors” and conservation implications framed as associational, not causal, until residual spatial/effort structure is addressed.
minor comments (6)
- Abstract still lists “Poisson Generalized Linear Models” as the modelling approach; the primary model is Negative Binomial after severe overdispersion (χ²/df ≈ 38.5). Align abstract with §III-E.
- Fig. 1–5 captions and axis labels are adequate but several results (exact land-cover class counts meeting the ≥25-cell threshold, full coefficient table with SEs for all 11 classes) are only partially reported in text; a supplementary coefficient table would help.
- §III-E: Treatment coding with class 2 as reference is fine; state how many cells fall in each retained class so readers can judge contrast precision.
- §IV-C: Weak positive cell-level ALAN–richness ρ ≈ 0.11 is reported “for completeness but not interpreted ecologically”—good; ensure the abstract’s “reducing overall richness” phrasing does not overstate this.
- Typos/notation: “V ariables” spacing in a heading; “F .” section label; ensure NDVI/ALAN transform (Yeo–Johnson) is applied consistently before and after grid averaging.
- References: several arXiv preprints and classic diversity papers are appropriate; a brief note on any Sri Lanka–specific bird atlas or prior national assessments would situate novelty more clearly.
Circularity Check
No circularity: empirical associational study; richness and land-cover are independently measured, and model rankings are not forced by construction.
full rationale
The paper’s load-bearing claim (H1) is that modal IGBP land-cover type associates more strongly with cell-level bird species richness than continuous NDVI or climate alone. Species richness is defined as the count of unique species per thinned grid cell from eBird/GBIF; land cover, NDVI, ALAN, climate, and aerosols come from independent remote-sensing and reanalysis products. The ranking is obtained by comparing marginal Spearman ρ, driver-family models, and Negative Binomial GLM coefficients on a hold-out split—not by defining richness in terms of land-cover coefficients or by refitting a target and calling it a prediction. The authors explicitly frame the GLM as exploratory and associational (hold-out Spearman ρ≈0.20; McFadden pseudo-R²≈0.003), not as a first-principles derivation. Effort correction (spatial thinning, rarefaction, checklist-density sensitivity) and residual Moran’s I are validity/bias concerns, not circular reductions of outputs to inputs. No self-citation chain, uniqueness theorem, or ansatz from the same authors underwrites the central ranking. Pipeline choices (reference land-cover class, 5 km grid, treatment coding) are standard modeling decisions and do not make H1 true by definition. Score 0 is therefore appropriate.
Assumptions & free parameters
free parameters (5)
- Primary grid resolution
- Rarefaction iteration count
- Land-cover class inclusion threshold
- Train–test split seed and fraction
- Yeo–Johnson / log transforms
assumptions (5)
- domain assumption After spatial thinning and rarefaction, remaining cell richness and occupancy primarily reflect ecological conditions rather than residual observer accessibility.
- domain assumption VIIRS night-light radiance (ALAN) is a valid proxy for urbanization intensity at the scales analyzed.
- domain assumption Modal IGBP land-cover class within a grid cell represents structural habitat relevant to avian richness better than continuous NDVI alone.
- standard math Negative Binomial GLM is an appropriate primary model for overdispersed positive cell richness counts; Poisson+HC1 is only a sensitivity check.
- domain assumption Citizen-science eBird/GBIF records merged by month and coordinates to remote-sensing/reanalysis layers yield usable spatio-temporal matches.
Cite this review
Pith. "Pith review of How Environment and Urbanization Shape Bird Diversity in Sri Lanka." pith.science (2026). https://pith.science/paper/TWDYLNH2
@misc{pith2026260700582,
  author       = {Pith},
  title        = {Pith review of: How Environment and Urbanization Shape Bird Diversity in Sri Lanka},
  year         = {2026},
  howpublished = {\url{https://pith.science/paper/TWDYLNH2}},
  note         = {Machine review of arXiv:2607.00582}
}
read the original abstract
This study presents a comprehensive analysis of bird diversity across Sri Lanka by integrating spatial, temporal, and environmental data. Bird observation records were combined with environmental variables, including weather conditions, air pollution, the Normalized Difference Vegetation Index (NDVI), land cover, elevation, and Artificial Light At Night (ALAN), and rigorously preprocessed to ensure data quality. Spatial analyses were conducted on multiple grid scales (2 km, 5 km, 10 km) to evaluate patterns in species richness while minimizing sampling bias through spatial thinning. Temporal trends were assessed using effort-corrected metrics including rarefied richness and occupancy rates to account for variations in observation effort over time. Environmental drivers of bird diversity were examined using multivariate statistical models, including Poisson Generalized Linear Models (GLMs) and correlation analyses, to identify key associations between ecological factors and species richness. Additionally, community structure, dominance patterns, and beta diversity were analyzed to understand variations in species composition across regions and time. The study found that land-cover type is a stronger predictor of bird diversity than individual continuous variables such as NDVI or temperature alone. Urbanization, measured by ALAN, exhibits nuanced scale-dependent effects, supporting high abundances of a few generalist species while reducing overall richness. The findings provide actionable insights into the patterns and drivers of avian diversity in Sri Lanka, offering a scalable and reproducible framework for biodiversity research and conservation planning.
Figures


Figures from the paper (3 more)
Reference graph
Works this paper leans on
-
[1]
Increasing awareness of avian ecological function,
C. H. Sekercioglu, “Increasing awareness of avian ecological function,” Ecology Letters, 2006
2006
-
[2]
Modelling the european farmland bird indicator in response to forecast land-use change in europe,
P. Scholefield, L. Firbank, S. Butler, K. Norris, L. M. Jones, and S. Petit, “Modelling the european farmland bird indicator in response to forecast land-use change in europe,”Ecological Indicators, vol. 11, no. 1, pp. 46–51, 2011
2011
-
[3]
Using satellite data to assess spatial drivers of bird diversity,
M. L. Hunt, G. A. Blackburn, G. M. Siriwardena, and C. S. Rowland, “Using satellite data to assess spatial drivers of bird diversity,”Remote Sens. Ecol. Conserv., vol. 9, no. 4, pp. 483–500, 2023
2023
-
[4]
SatBird: Bird Species Distribution Modeling with Remote Sensing and Citizen Science Data,
M. Tenget al., “SatBird: Bird Species Distribution Modeling with Remote Sensing and Citizen Science Data,”arXiv preprint arXiv:2311.00936, 2023
arXiv 2023
-
[5]
The ebird enterprise: An integrated approach to development and application of citizen science,
B. L. Sullivanet al., “The ebird enterprise: An integrated approach to development and application of citizen science,”Biol. Conserv., vol. 169, pp. 31–40, 2014
2014
-
[6]
Remotely sensed indicators and open-access biodiversity data to assess bird diversity patterns in mediterranean rural landscapes,
I. Ribeiro, V . Proenca, P. Serra, J. Palma, C. Domingo-Marimon, X. Pons, and T. Domingos, “Remotely sensed indicators and open-access biodiversity data to assess bird diversity patterns in mediterranean rural landscapes,”Sci. Rep., vol. 9, p. 6826, 2019
2019
-
[7]
Using the satellite-derived ndvi to assess ecological responses to environmental change,
N. Pettorelli, J. O. Vik, A. Mysterud, J.-M. Gaillard, C. Tucker, and N. C. Stenseth, “Using the satellite-derived ndvi to assess ecological responses to environmental change,”Trends Ecol. Evol., vol. 20, no. 9, pp. 503–510, 2005
2005
-
[8]
Agricultural intensification and the collapse of europe’s farmland bird populations,
P. F. Donald, R. E. Green, and M. F. Heath, “Agricultural intensification and the collapse of europe’s farmland bird populations,”Proc. R. Soc. B, vol. 268, pp. 25–29, 2001
2001
Show all 25 references
-
[9]
EcoCast: A Spatio-Temporal Model for Continual Biodiversity and Climate Risk Forecasting,
H. A. Akande and A. A. Gidado, “EcoCast: A Spatio-Temporal Model for Continual Biodiversity and Climate Risk Forecasting,”arXiv preprint arXiv:2512.02260, 2025
2025
-
[10]
The ecological impacts of nighttime light pollution: A mechanistic appraisal,
K. J. Gaston, J. Bennie, T. W. Davies, and J. Hopkins, “The ecological impacts of nighttime light pollution: A mechanistic appraisal,”Biol. Rev., vol. 88, no. 4, pp. 912–927, 2013
2013
-
[11]
Urbanization, biodiversity, and conservation,
M. L. McKinney, “Urbanization, biodiversity, and conservation,”Bio- Science, vol. 52, no. 10, pp. 883–890, 2002
2002
-
[12]
Land use and avian species diversity along an urban gradient,
R. B. Blair, “Land use and avian species diversity along an urban gradient,”Ecol. Appl., vol. 6, no. 2, pp. 506–519, 1996
1996
-
[13]
Species abundance distributions: moving beyond single prediction theories to integration within an ecological framework,
B. J. McGillet al., “Species abundance distributions: moving beyond single prediction theories to integration within an ecological framework,” Ecol. Lett., vol. 10, no. 10, pp. 995–1015, 2007
2007
-
[14]
Global analysis of bird elevation diversity,
C. M. McCain, “Global analysis of bird elevation diversity,”Global Ecol. Biogeogr ., vol. 18, no. 3, pp. 346–360, 2009
2009
-
[15]
Viirs night-time lights,
C. D. Elvidge, K. Baugh, M. Zhizhin, F.-C. Hsu, and T. Ghosh, “Viirs night-time lights,”Int. J. Remote Sens., vol. 38, no. 21, pp. 5860–5879, 2017
2017
-
[16]
A new family of power transformations to improve normality or symmetry,
I.-K. Yeo and R. A. Johnson, “A new family of power transformations to improve normality or symmetry,”Biometrika, vol. 87, no. 4, pp. 954– 959, 2000
2000
-
[17]
Annual time series of global viirs nighttime lights derived from monthly averages: 2012 to 2019,
C. D. Elvidge, M. Zhizhin, T. Ghosh, F.-C. Hsu, and J. Taneja, “Annual time series of global viirs nighttime lights derived from monthly averages: 2012 to 2019,”Remote Sensing, vol. 13, no. 5, p. 922, 2021
2012
-
[18]
The distribution of the flora in the alpine zone,
P. Jaccard, “The distribution of the flora in the alpine zone,”New Phytologist, vol. 11, no. 2, pp. 37–50, 1912
1912
-
[19]
Quantifying biodiversity: procedures and pitfalls in the measurement and comparison of species richness,
N. J. Gotelli and R. K. Colwell, “Quantifying biodiversity: procedures and pitfalls in the measurement and comparison of species richness,” Ecol. Lett., vol. 4, no. 4, pp. 379–391, 2001
2001
-
[20]
Use of ranks in one-criterion variance analysis,
W. H. Kruskal and W. A. Wallis, “Use of ranks in one-criterion variance analysis,”Journal of the American Statistical Association, vol. 47, no. 260, pp. 583–621, 1952
1952
-
[21]
Controlling the false discovery rate: a practical and powerful approach to multiple testing,
Y . Benjamini and Y . Hochberg, “Controlling the false discovery rate: a practical and powerful approach to multiple testing,”J. R. Stat. Soc. B, vol. 57, no. 1, pp. 289–300, 1995
1995
-
[22]
A mathematical theory of communication,
C. E. Shannon, “A mathematical theory of communication,”Bell System Technical Journal, vol. 27, pp. 379–423, 623–656, 1948
1948
-
[23]
Diversity of planktonic foraminifera in deep-sea sediments,
W. H. Berger and F. L. Parker, “Diversity of planktonic foraminifera in deep-sea sediments,”Science, vol. 168, no. 3937, pp. 1345–1347, 1970
1970
-
[24]
Integrating field- and remote sensing data to perceive species heterogeneity across a climate gradient,
P. Sharmaet al., “Integrating field- and remote sensing data to perceive species heterogeneity across a climate gradient,”Sci. Rep., vol. 13, p. 22698, 2023
2023
-
[25]
A heteroskedasticity-consistent covariance matrix estimator and a direct test for heteroskedasticity,
H. White, “A heteroskedasticity-consistent covariance matrix estimator and a direct test for heteroskedasticity,”Econometrica, vol. 48, no. 4, pp. 817–838, 1980
1980
Reviewed July 12, 2026 · model on record in the stance chip above.
Discussion (0). Continue with ORCID to comment.