Mitigating Confirmation Bias through Hand-Drawing Videos
Pith reviewed 2026-07-03 18:52 UTC · model grok-4.3
The pith
Hand-drawn videos of bar charts help viewers interpret data accurately even when it conflicts with their prior beliefs.
A machine-rendered reading of the paper's core claim, the machinery that carries it, and where it could break.
Core claim
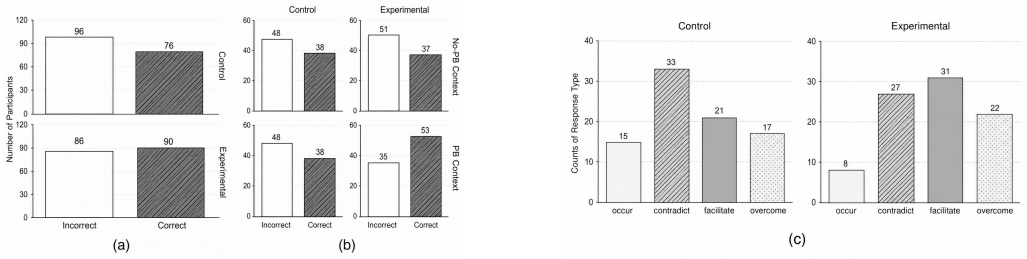
Observing the dynamic hand-drawing of a visualization supports more accurate reasoning and mitigates the influence of confirmation bias, as shown by improved interpretation accuracy even when data conflicts with prior beliefs, reduced belief-consistent errors, and increased belief-overriding responses.
What carries the argument
Hand-drawing videos that dynamically construct the visualization and thereby expose its construction process.
If this is right
- Accurate interpretation rises even when data challenges prior beliefs.
- Belief-consistent errors decrease when the drawing process is visible.
- Belief-overriding responses become more frequent with hand-drawn videos.
- Exposing the visualization construction process encourages more accurate reasoning across aligned and conflicting contexts.
Where Pith is reading between the lines
- The same construction-exposure principle could be tested on line graphs or scatter plots to check if the benefit generalizes beyond bar charts.
- Interface builders might add user-controlled playback speed to hand-drawing videos to see whether active pacing strengthens the bias-reduction effect.
- Educational tools could combine hand-drawing sequences with brief prompts that ask users to predict the next mark, turning passive watching into active engagement.
Load-bearing premise
Differences in interpretation accuracy are caused by the hand-drawing process itself rather than other uncontrolled factors such as video duration, motion, or participant attention.
What would settle it
An experiment that matches hand-drawn videos and static charts on duration, motion, and attention demands and still finds no accuracy difference in belief-conflicting conditions would falsify the central claim.
Figures
read the original abstract
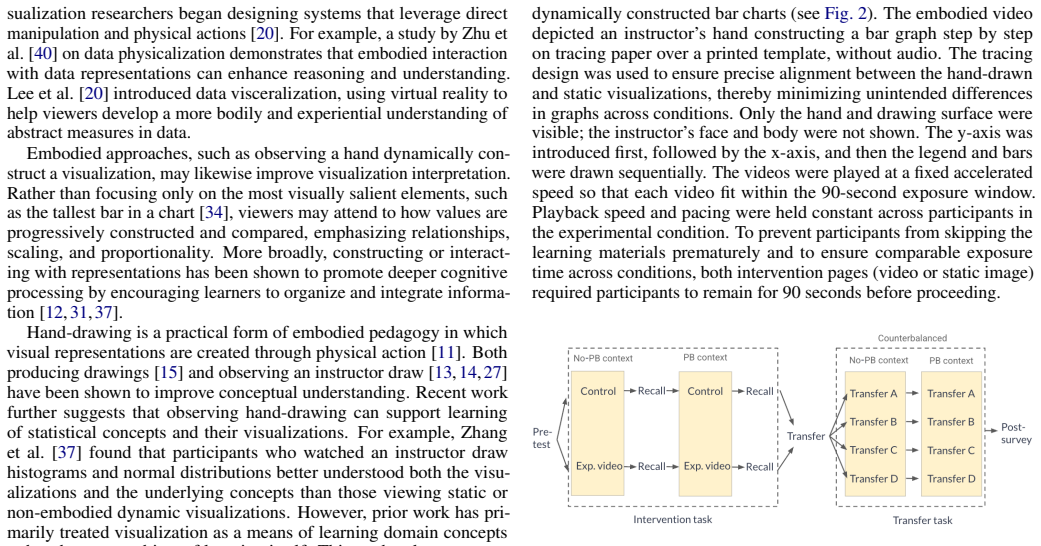
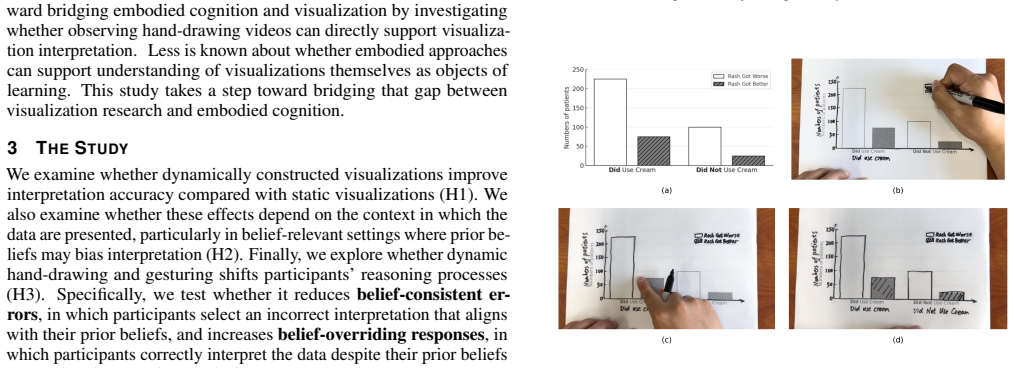
Understanding data visualizations is essential for informed decision-making, yet interpretation is often shaped and even distorted by prior beliefs. We investigate whether an embodied pedagogical approach, in which viewers observe the dynamic hand-drawing of a visualization, can mitigate confirmation bias and improve interpretation accuracy. We conducted a study comparing static bar charts to videos in which charts are constructed through hand-drawing, across contexts that either align with or challenge participants' prior beliefs. The results indicate that hand-drawn videos helped participants accurately interpret data, even when the data conflicted with their prior beliefs. This approach also reduced belief-consistent errors and increased belief-overriding responses. These findings suggest that exposing the construction process of a visualization supports more accurate reasoning and mitigates the influence of confirmation bias. Consequently, this work introduces a promising design space for bias-mitigating data interfaces.
Editorial analysis
A structured set of objections, weighed in public.
Referee Report
Summary. The paper claims that an embodied approach of observing dynamic hand-drawing of bar chart visualizations mitigates confirmation bias and improves interpretation accuracy compared to static charts. A user study compared the two formats across belief-aligned and belief-challenging contexts; results are reported to show higher accuracy, fewer belief-consistent errors, and more belief-overriding responses with hand-drawn videos, suggesting that exposing the construction process supports better reasoning.
Significance. If the causal link to the hand-drawing process can be isolated from confounds, the work would open a design space for bias-mitigating visualization interfaces with potential applications in data literacy tools and decision-support systems.
major comments (2)
- Abstract: The abstract reports positive results on accuracy and bias reduction but supplies no information on study design, sample size, controls, statistical methods, or exclusion criteria, preventing assessment of whether the data support the stated claims.
- Study design (throughout): The central comparison is limited to static bar charts versus hand-drawn construction videos; no matched-duration animated chart condition (e.g., computer-generated reveal or smooth animation) is described. This leaves motion, temporal change, and attention as uncontrolled confounds, directly weakening the attribution of effects specifically to the embodied hand-drawing process.
Simulated Author's Rebuttal
We thank the referee for the constructive feedback on our manuscript. We address each major comment below and indicate where revisions will be made to strengthen the work.
read point-by-point responses
-
Referee: Abstract: The abstract reports positive results on accuracy and bias reduction but supplies no information on study design, sample size, controls, statistical methods, or exclusion criteria, preventing assessment of whether the data support the stated claims.
Authors: We agree that the abstract omits key methodological details. This stems from typical length constraints, but we will revise the abstract to incorporate essential information including sample size, study design (between-subjects comparison of static charts vs. hand-drawing videos), statistical methods, and any exclusion criteria. Full details will continue to appear in the Methods section. revision: yes
-
Referee: Study design (throughout): The central comparison is limited to static bar charts versus hand-drawn construction videos; no matched-duration animated chart condition (e.g., computer-generated reveal or smooth animation) is described. This leaves motion, temporal change, and attention as uncontrolled confounds, directly weakening the attribution of effects specifically to the embodied hand-drawing process.
Authors: We acknowledge this as a valid limitation of the current design. The study intentionally contrasted a standard static format against an embodied hand-drawing process to test the pedagogical value of observing construction, rather than general animation. However, without a matched animated control, effects cannot be attributed solely to the hand-drawing aspect versus motion or temporal unfolding. In revision we will explicitly discuss this confound in the Limitations section, temper claims accordingly, and outline it as a direction for future controlled experiments. revision: partial
Circularity Check
Empirical user study with no derivation chain
full rationale
The paper reports direct results from a user study comparing static bar charts to hand-drawn videos, with claims based on observed accuracy, error rates, and response patterns. No equations, fitted parameters, predictions, ansatzes, or self-citation chains appear in the derivation of results; the central claims are presented as experimental observations without any reduction to inputs by construction.
Axiom & Free-Parameter Ledger
Reference graph
Works this paper leans on
-
[1]
L. W. Barsalou. Perceptual symbol systems.Behavioral and Brain Sci- ences, 22(4):577–660, 1999. doi: 10.1017/S0140525X99002149 1
-
[2]
L. W. Barsalou. Grounded cognition.Annual Review of Psychology, 59:617–645, 2008. doi: 10.1146/annurev.psych.59.103006.093639 1
- [3]
-
[4]
P. A. Carpenter and P. Shah. A model of the perceptual and conceptual processes in graph comprehension.Journal of Experimental Psychology: Applied, 4(2):75–100, 1998. doi: 10.1037/1076-898X.4.2.75 1
-
[5]
S. Chaiken and D. Maheswaran. Heuristic processing can bias system- atic processing: Effects of source credibility, argument ambiguity, and task importance on attitude judgment.Journal of Personality and Social Psychology, 66(3):460–473, 1994. doi: 10.1037/0022-3514.66.3.460 1
-
[6]
M. Chang, A. Malitek, K. Fukuda, and C. X. Bearfield. Early stage eye- fixations reveal belief-driven bias in correlation perception.Journal of Vision, 25(9):2132–2132, 2025. doi: 10.1167/jov.25.9.2132 1
-
[7]
Chuanromanee and R
K. Chuanromanee and R. Metoyer. A crowdsourced study of visual strategies for mitigating confirmation bias. InProc. VL/HCC, pp. 1–6,
-
[8]
doi: 10.1109/VL/HCC53370.2022.9833151 1
-
[9]
Clark.Supersizing the Mind: Embodiment, Action, and Cognitive Extension
A. Clark.Supersizing the Mind: Embodiment, Action, and Cognitive Extension. Oxford University Press, Oxford, 2008. doi: 10.1093/acprof: oso/9780195333213.001.0001 1
- [10]
-
[11]
J. S. B. T. Evans. Dual-processing accounts of reasoning, judgment, and social cognition.Annual Review of Psychology, 59:255–278, 2008. doi: 10.1146/annurev.psych.59.103006.093629 1
-
[12]
J. E. Fan, W. A. Bainbridge, R. Chamberlain, and J. D. Wammes. Drawing as a versatile cognitive tool.Nature Reviews Psychology, 2(9):556–568,
-
[13]
doi: 10.1038/s44159-023-00212-w 1, 2
-
[14]
L. Fiorella and R. E. Mayer.Learning as a Generative Activity: Eight Learning Strategies That Promote Understanding. Cambridge University Press, 2015. doi: 10.1017/CBO9781107707085 2
-
[15]
Fiorella and R
L. Fiorella and R. E. Mayer. Eight ways to promote generative learning. Educational Psychology Review, 28(4):717–741, 2016. doi: 10.1007/ s10648-015-9348-9 2
2016
-
[16]
L. Fiorella, A. T. Stull, S. Kuhlmann, and R. E. Mayer. Instructor presence in video lectures: The role of dynamic drawings, eye contact, and instructor visibility.Journal of Educational Psychology, 111(7):1162–1171, 2019. doi: 10.1037/edu0000325 2
-
[17]
L. Fiorella and Q. Zhang. Drawing boundary conditions for learning by drawing.Educational Psychology Review, 30(3):1115–1137, 2018. doi: 10.1007/s10648-018-9444-8 2
-
[18]
S. L. Franconeri, L. M. Padilla, P. Shah, J. M. Zacks, and J. Hullman. The science of visual data communication: What works.Psychologi- cal Science in the Public Interest, 22(3):110–161, 2021. doi: 10.1177/ 15291006211051956 1
2021
-
[19]
Kahneman.Thinking, Fast and Slow
D. Kahneman.Thinking, Fast and Slow. Farrar, Straus and Giroux, 2011. 1
2011
-
[20]
R. Koonchanok, G. Y . Tawde, G. R. Narayanasamy, S. Walimbe, and K. Reda. Visual belief elicitation reduces the incidence of false discov- ery. InProceedings of the 2023 CHI Conference on Human Factors in Computing Systems, art. no. 388, 17 pages, 2023. doi: 10.1145/3544548. 3580808 1
-
[21]
Z. Kunda. The case for motivated reasoning.Psychological Bulletin, 108(3):480–498, 1990. doi: 10.1037/0033-2909.108.3.480 1
-
[22]
B. Lee, D. Brown, B. Lee, C. Hurter, S. Drucker, and T. Dwyer. Data visceralization: Enabling deeper understanding of data using virtual reality. IEEE Transactions on Visualization and Computer Graphics, 27(2):1095– 1105, 2021. doi: 10.1109/TVCG.2020.3030435 2
-
[23]
S. Li, T. J. Davidson, C. X. Bearfield, and E. Wall. Confirmation bias: The double-edged sword of data facts in visual data communication. InProc. CHI, art. no. 1175, 16 pages, 2025. doi: 10.1145/3706598.3713831 1
-
[24]
M. Lisnic, Z. Cutler, M. Kogan, and A. Lex. Visualization guardrails: Designing interventions against cherry-picking in interactive data explor- ers. InProceedings of the 2025 CHI Conference on Human Factors in Computing Systems, pp. 1–19, 2025. doi: 10.1145/3706598.3713385 1
-
[25]
Munzner.Visualization Analysis and Design
T. Munzner.Visualization Analysis and Design. CRC Press, 2014. doi: 10 .1201/b17511 1
2014
-
[26]
R. S. Nickerson. Confirmation bias: A ubiquitous phenomenon in many guises.Review of General Psychology, 2(2):175–220, 1998. doi: 10. 1037/1089-2680.2.2.175 1
1998
-
[27]
S. Pinker. A theory of graph comprehension. In R. Freedle, ed.,Artificial Intelligence and the Future of Testing, pp. 73–126. Lawrence Erlbaum Associates, 1990. 1
1990
-
[28]
Qualtrics survey software
Qualtrics. Qualtrics survey software. https://www.qualtrics.com,
-
[29]
K. Quillin and S. Thomas. Drawing-to-learn: A framework for using draw- ings to promote model-based reasoning in biology.CBE—Life Sciences Education, 14(1):es2, 2015. doi: 10.1187/cbe.14-08-0128 2
-
[30]
P. Shah and J. Hoeffner. Review of graph comprehension research: Impli- cations for instruction.Educational Psychology Review, 14:47–69, 2002. doi: 10.1023/A:1013180410169 1
-
[31]
K. E. Stanovich and R. F. West. Individual differences in reasoning: Implications for the rationality debate?Behavioral and Brain Sciences, 23(5):645–665, 2000. doi: 10.1017/S0140525X00003435 1
-
[32]
A. Tversky and D. Kahneman. Judgment under uncertainty: Heuristics and biases.Science, 185(4157):1124–1131, 1974. doi: 10.1126/science. 185.4157.1124 3
-
[33]
P. Van Meter and J. Garner. The promise and practice of learner-generated drawing: Literature review and synthesis.Educational Psychology Review, 17(4):285–325, 2005. doi: 10.1007/s10648-005-8136-3 2
-
[34]
Ware.Information Visualization: Perception for Design
C. Ware.Information Visualization: Perception for Design. Morgan Kaufmann, 2000. doi: 10.1016/c2009-0-62432-6 1
-
[35]
M. Wilson. Six views of embodied cognition.Psychonomic Bulletin & Review, 9(4):625–636, 2002. doi: 10.3758/BF03196322 1
- [36]
-
[37]
C. Xiong, C. Stokes, Y .-S. Kim, and S. Franconeri. Seeing what you believe or believing what you see? belief biases correlation estimation. IEEE Transactions on Visualization and Computer Graphics, 2022. doi: 10.1109/TVCG.2022.3209405 1
-
[38]
I. Zhang, K. B. Givvin, J. M. Sipple, J. Y . Son, and J. W. Stigler. Instructed hand movements affect students’ learning of an abstract concept from video.Cognitive Science, 45(2):e12940, 2021. doi: 10.1111/cogs.12940 1
-
[39]
I. Zhang, X. Guo, and J. Y . Son. Watching videos of a drawing hand improves students’ understanding of the normal probability distribution. Memory & Cognition, 2025. doi: 10.3758/s13421-024-01526-7 2
-
[40]
I. Zhang, J. Y . Son, and J. W. Stigler. Toward a cognitive developmental theory of embodied learning in stem domains.Educational Psychologist, pp. 1–21, 2025. doi: 10.1080/00461520.2025.2576939 1
-
[41]
I. Y . Zhang, M. C. Tucker, and J. W. Stigler. Watching a hands-on activity improves students’ understanding of randomness.Computers & Education, 186:104545, 2022. doi: 10.1016/j.compedu.2022.104545 1
-
[42]
C. Zhu, R. Klapwijk, M. Silva-Ordaz, J. Spandaw, and M. J. de Vries. Cognitive and embodied mapping of data: An examination of children’s spatial thinking in data physicalization.Frontiers in Education, 8:1308117,
-
[43]
doi: 10.3389/feduc.2023.1308117 2 5
discussion (0)
Sign in with ORCID, Apple, or X to comment. Anyone can read and Pith papers without signing in.