REVIEW 4 major objections 4 minor 55 references
In the hydrodynamical simulations analyzed here, gas-poor galaxy clusters do not show a deficit in their integrated Sunyaev-Zeldovich signal at fixed mass, because their lower gas density is offset by higher temperature.
Reviewed by Pith at T0; open to challenge. T0 means a machine referee read the full paper against a public rubric. the ladder, T0–T4 →
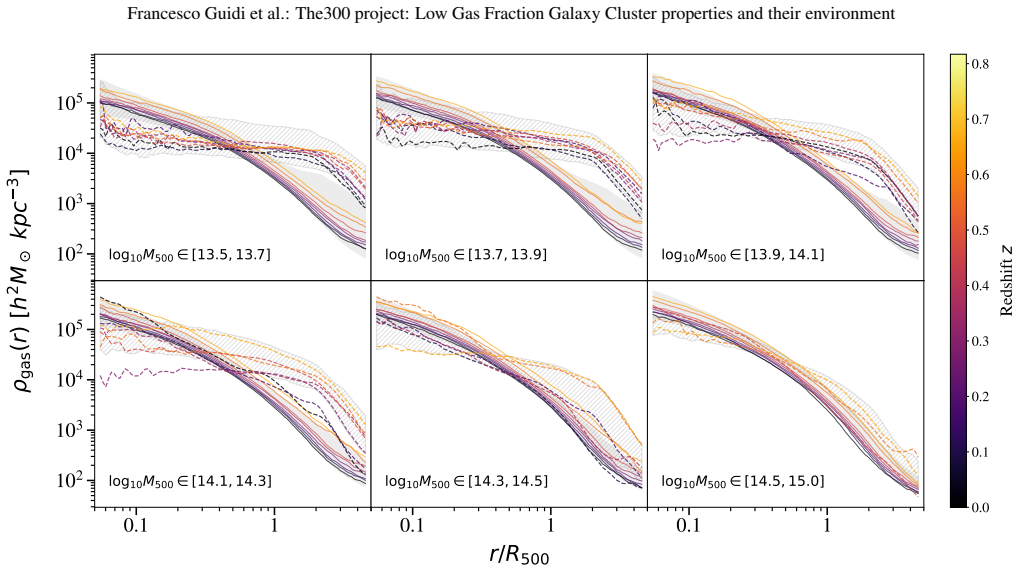
In the Three Hundred simulations, gas-poor clusters are preferentially low-mass, hotter, more diffuse, less connected to cosmic filaments, and their Compton-Y signal does not deviate from normal clusters because density loss is offset by heat gain.
T0 review reviewed 2026-08-02 challenge →
load-bearing objection Interesting simulation-vs-observation tension, but the central 'no Y deficit' claim needs a direct fixed-mass residual test before it can carry the weight the paper puts on it. the 4 major comments →
The Three Hundred project: Low Gas Fraction Galaxy Clusters properties and their environment
The pith
A machine-rendered reading of the paper's core claim, the machinery that carries it, and where it could break.
The reading
Core claim
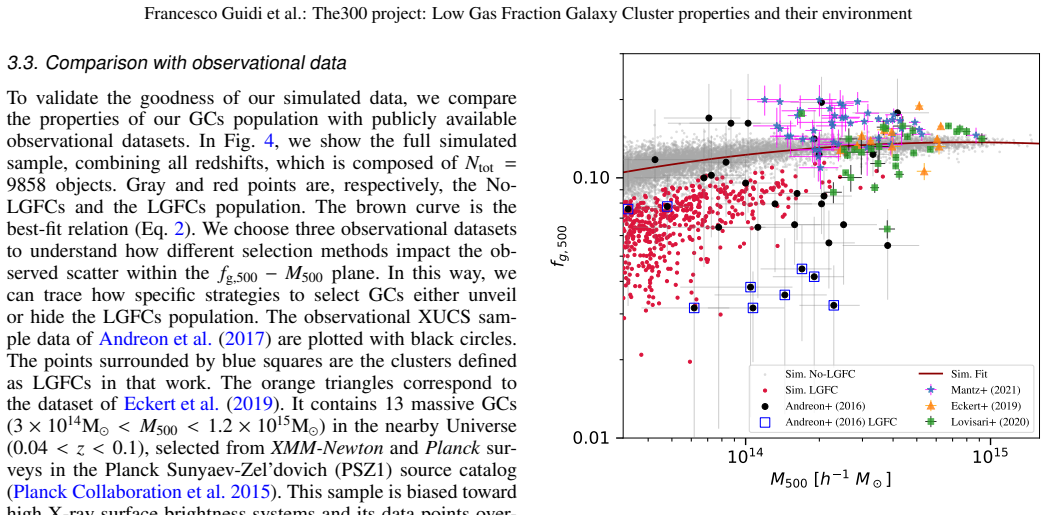
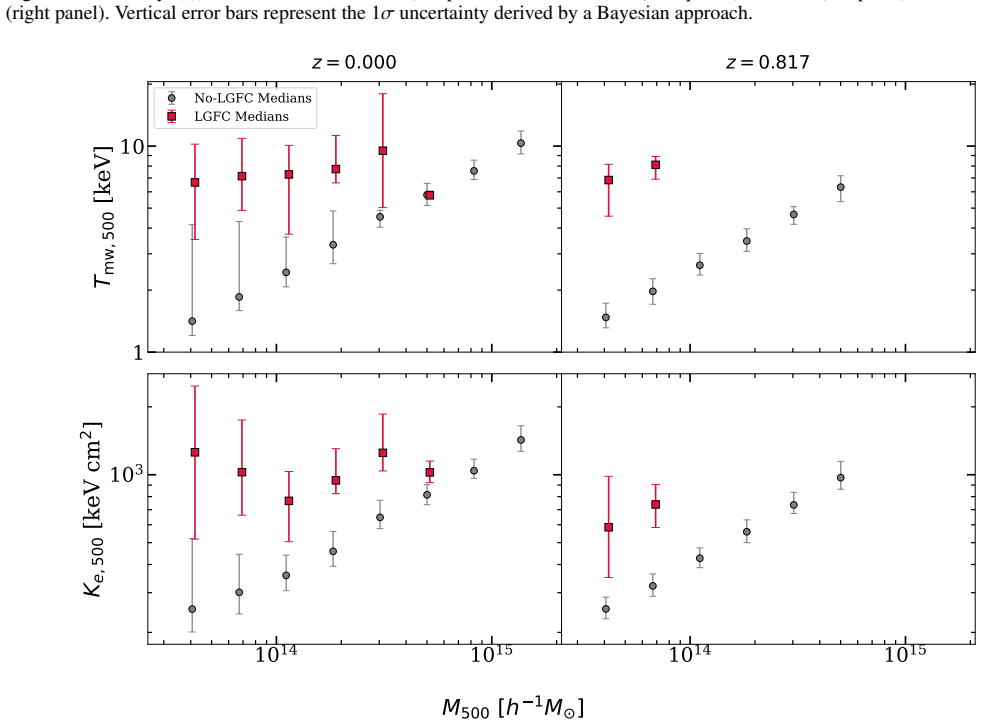
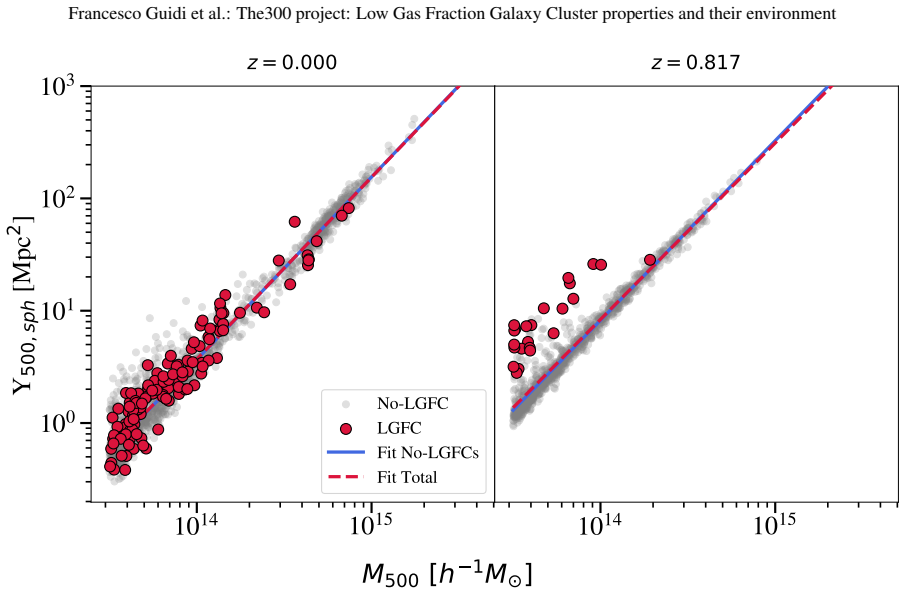
The paper's central claim is that low-gas-fraction clusters—selected as the 3σ negative tail of the gas-fraction–mass residuals—form a physically distinct population: at fixed mass they are hotter, more diffuse, higher-entropy, and less connected to cosmic-web filaments, and their fractional abundance grows toward low redshift and low mass. Yet when placed on the integrated Compton-Y–mass scaling relation, LGFCs do not stand out as negative outliers; the best-fit slope and normalization shift by no more than about one sigma when LGFCs are included (for example, at z=0 the slope changes from B=1.63±0.01 to 1.62±0.01, with normalization unchanged). The stated mechanism is that the integrated S
What carries the argument
The key objects are low-gas-fraction clusters, defined statistically as the most extreme negative outliers (below the local mean minus 3 times the positive-side scatter) in the f_g,500–M_500 relation. The load-bearing identity is the spherically integrated Compton parameter, Y_500,sph ∝ ∫ n_e T dV: in LGFCs the low gas density and high temperature partially cancel, so the pressure integral stays near the population average. Supporting analysis uses stacked radial gas-density and mass-weighted temperature profiles in narrow mass bins, the connectivity parameter k_500 (the number of filaments linked within R_500), and power-law fits to the Y–M relation with and without LGFCs. The cancellation
Load-bearing premise
That the low-mass galaxy clusters in the simulated sample are representative of real low-mass galaxy clusters; in fact, they are only the systems found near the most massive clusters, so the simulated LGFC population may be an artifact of this zoom-in environment.
What would settle it
Take a mass-complete, volume-limited sample (observational or simulated) spanning roughly 10^13.5 to 10^15 solar masses, identify low-gas-fraction clusters by the same residual criterion at fixed mass, and measure their integrated Y_500,sph. If a significant negative Y offset appears relative to the general population—as reported for the gravity-selected observational sample—then the density–temperature compensation seen here is not universal and the paper's central conclusion would fail.
If this is right
- Within the simulated model, galaxy cluster samples selected by SZ signal are not biased by the exclusion of low-gas-fraction clusters, since their inclusion leaves the Y–M scaling relation essentially unchanged.
- The fractional abundance of LGFCs grows from about 2.4% at z≈0.8 to about 9.6% at z=0 in this sample, so any effect on scaling relations becomes more significant at low redshift and for group-scale surveys.
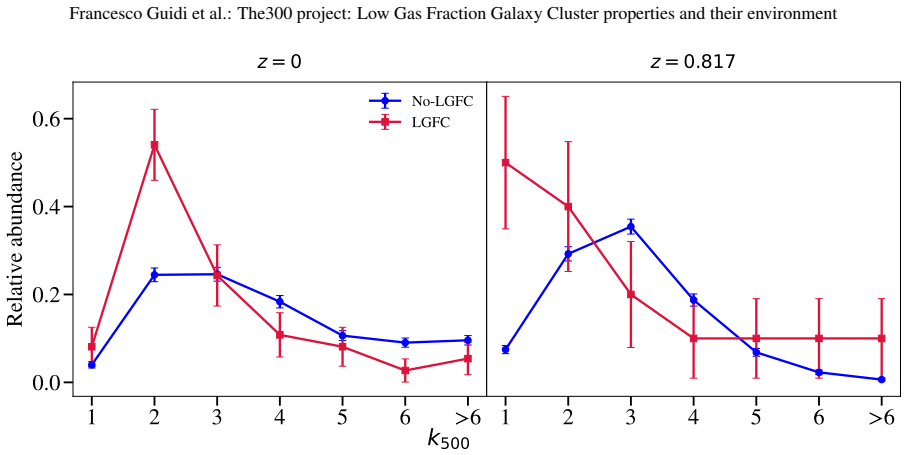
- LGFCs are preferentially low-mass and increasingly disconnected from filaments, suggesting that a reduced gas supply (environmental starvation), combined with internal feedback, can deplete the ICM without changing the integrated pressure.
- LGFCs show higher temperature and entropy at fixed mass, meaning they are not simply scaled versions of the average cluster population and must be treated as a non-self-similar component.
- Hydrostatic mass biases estimated from X-ray and SZ profiles are not significantly different between LGFCs and the rest of the population, so their presence does not add a distinct systematic error to mass estimates.
Where Pith is reading between the lines
- If the density–temperature compensation holds for real gas-poor clusters, SZ surveys may be robust to this selection effect, and the Y deficit reported for gravity-selected observational samples would point to stronger or more efficient feedback in real clusters than in the simulation code used here.
- Because the simulated low-mass objects are taken only from the vicinity of the most massive clusters, the LGFC population studied here may resemble groups that have been tidally or ram-pressure stripped; isolated low-mass field clusters, which dominate real survey volumes, could behave differently and are a direct test of this result.
- A testable prediction follows: simulation variants with stronger AGN feedback or with no feedback should bracket the behavior—stronger feedback could break the temperature compensation and reproduce the observed Y deficit, while weaker feedback should make LGFCs even less distinct.
- The same density deficit that leaves Y unchanged should make LGFCs extreme low-surface-brightness outliers in X-ray luminosity (since L_X ∝ n_e^2), so X-ray selected samples remain biased even if SZ samples do not.
Editorial analysis
A structured set of objections, weighed in public.
Referee Report
Summary. The paper analyzes The Three Hundred Gadget-X simulations to identify low-gas-fraction clusters (LGFCs) as negative outliers in the f_g,500–M_500 relation, and to study their abundance, environment, thermodynamic profiles, and scaling relations. LGFCs are found to be preferentially low-mass, to become more abundant toward z=0, to have lower central gas density and higher temperature, and to appear as positive entropy outliers. The central claim is that, contrary to recent observational work, LGFCs do not deviate from the No-LGFC population in the Y_sph,500–M_500 relation, so their inclusion leaves the fitted normalization and slope essentially unchanged. The authors also examine X-ray and SZ hydrostatic mass bias and find no LGFC-specific difference. The paper explicitly acknowledges that the simulated sample is mass-incomplete at low masses and environmentally biased, and cautions against direct generalization. The analysis is transparent but, for the key Y–M null result, relies on comparing global fit parameters rather than on a fixed-mass residual test.
Significance. If the main claim were fully established, it would be important: it would imply that, within the Gadget-X model, gas-poor clusters do not bias SZ scaling relations, contradicting the observational Y deficit reported by Andreon & Radovich (2025) and pointing toward feedback-model or selection explanations. The paper is methodologically transparent, uses a well-known public simulation suite, and presents useful profile and bias comparisons. However, the significance is currently limited by (i) the absence of a direct fixed-mass residual test for the Y–M claim, (ii) the partly constructed nature of the entropy-outlier statement, and (iii) the acknowledged environmental bias and mass incompleteness of the sample. These are fixable within the manuscript's scope, so the central idea remains viable.
major comments (4)
- [§5.3, Table 3, Fig. 9] The claim that LGFCs are 'not negative outliers' and do not bias the Y–M relation is supported only by comparing the best-fit A and B for the No-LGFC sample with the fit for the total sample. No fixed-mass residual distribution, binned median offset, outlier count, or significance test is presented. This matters because LGFCs are only ~9.6% of the sample at z=0 and are concentrated at low mass. A median Y deficit of ~20% among LGFCs would shift log-normalization by roughly 0.009 dex, comparable to the quoted ±0.01 uncertainty on A. Thus the unchanged A and the 0.01 change in B do not exclude a real negative offset. Please add a direct residual analysis (e.g., log Y − fit(No-LGFC) versus mass, with bootstrap/KS comparisons between LGFC and No-LGFC) and report the covariance between A and B.
- [§5.2, Eq. (7)] The statement that LGFCs are 'extreme positive outliers' in entropy is substantially constructed by the selection: since K_e ∝ n_e^{-2/3} T and LGFCs are selected as the lowest gas fraction at fixed mass, they have low mean n_e within R_500, so high K follows even at unchanged T. The paper separately reports a temperature enhancement, which is the physically independent part, but the entropy claim should be decomposed into the selection-driven density contribution and the temperature contribution, with the latter quantified at fixed mass. Otherwise the entropy result reads as a restatement of the selection rather than an independent finding.
- [§2.1, §7(iv), Abstract] The authors correctly and repeatedly state that the sample is 'strictly limited to groups around rich clusters', making it mass-incomplete at low masses and environmentally biased. This directly affects the reported growth of LGFC abundance with time (Fig. 3), the low-mass-end preference, the connectivity result (Fig. 7, which is not mass-matched), and the generalizability of the Y–M null result. The caveat is explicit, but the paper's abstract and Sect. 5.3 phrase the result as if it tests the observed LGFC population. Please either restrict the conclusions explicitly to the simulated sample and its selection geometry, or add a mass-complete/environment-controlled comparison to support the claimed generality.
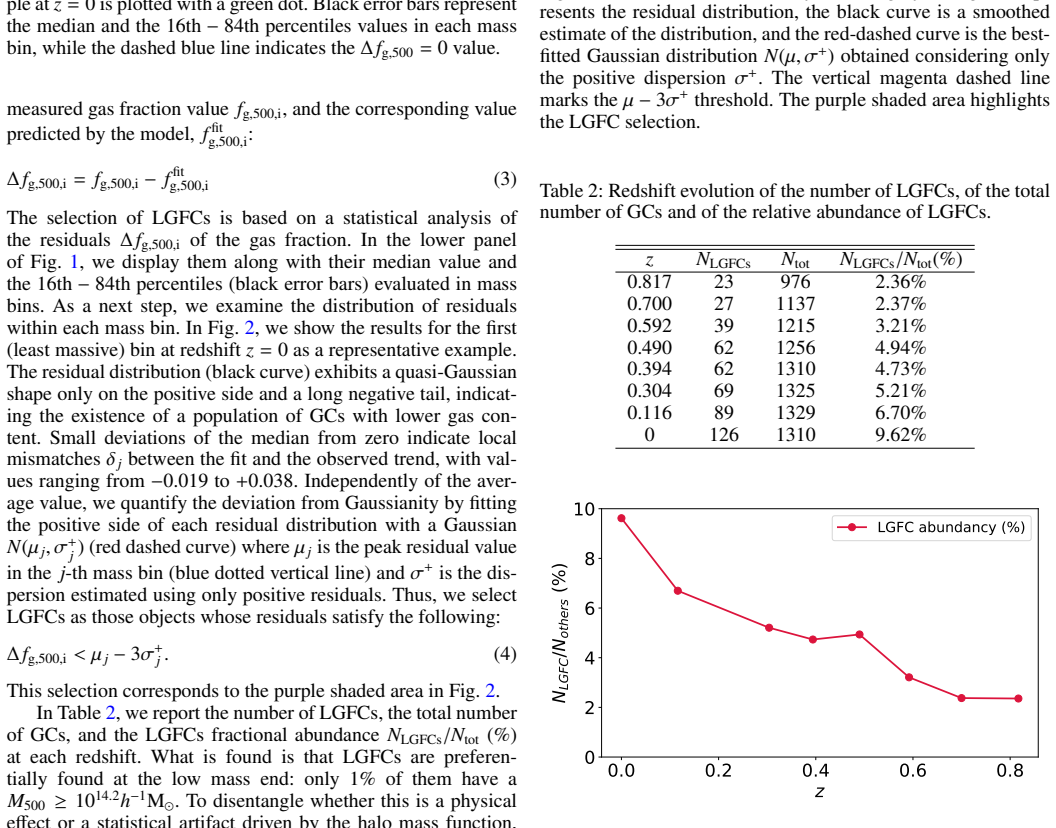
- [§3.2, Eq. (4)] The LGFC selection assumes that the positive side of each mass-bin residual distribution is Gaussian and that the negative tail is a distinct population. No goodness-of-fit test or mixture-model comparison is provided. Since the threshold µ−3σ+ defines the entire LGFC sample, the stability of the selection to the Gaussian assumption and to the binning choice should be demonstrated, especially because the final conclusions are sensitive to which objects are called LGFCs.
minor comments (4)
- [Fig. 6 caption] The caption says 'Same as Fig. 4.1' but should refer to Fig. 5. Also check cross-references throughout, as several appear to have been inserted by the production system.
- [§3.2, Table 2] The column header 'LGFC abundancy (%)' should be 'LGFC abundance (%)'. The increasing abundance toward z=0 would also benefit from a significance estimate beyond counting statistics, given the small numbers at high z.
- [§4.3] For z=0.817 the comparison uses z=1 connectivity from Santoni et al. (2024) because that is the closest snapshot. This redshift mismatch and the small LGFC number at z=0.817 should be stated more prominently, since the paper does note that the z=0.817 result is not statistically robust.
- [§5.3, Eq. (8)] The fitting procedure for Eq. (8) is not described: it is not stated whether the fit is ordinary least squares in log space, whether intrinsic scatter is modeled, or how the reported errors are derived. This matters for interpreting the parameter shifts in Table 3.
Circularity Check
Partial circularity: the entropy-excess claim for LGFCs is a restatement of the LGFC selection combined with the definition K ∝ n_e^{-2/3}T; the main Y_sph,500 null result is independent.
specific steps
-
self definitional
[Sect. 5.2 (Eq. 7) with Sect. 3.2 (Eqs. 3-4)]
"We compute the electron entropy K_e,500 by integrating within R500 its radial profile, given by: K_e(r)=n_e(r)^{-2/3} k_B T_mw(r) ... we select LGFCs as those objects whose residuals satisfy the following: Δf_g,500,i < μ_j−3σ+j."
At fixed M500, the selection variable f_g,500 is the gas mass fraction within R500, i.e. a volume-averaged electron density. Eq. 7 defines K ∝ n_e^{-2/3}T. Therefore any object selected as a negative f_g outlier automatically has high K at comparable T. Presenting 'LGFCs are extreme positive outliers' in entropy as a new finding is a restatement of the selection criterion plus Eq. 7, not an independent empirical result. The temperature enhancement is independently measured, but the entropy-excess claim itself is forced by the definition of LGFCs.
full rationale
The paper's central scientific claim is that LGFCs do not deviate from the Y_sph,500-M500 relation at fixed mass (Sect. 5.3, Table 3). That claim is based on direct 3D integration of Y from simulated particles, so it does not reduce to the LGFC selection; the unchanged fit parameters when adding LGFCs are a measured outcome, not an input. However, one highlighted result is partially circular: the entropy excess. LGFCs are defined as the most negative residuals in f_g,500 at fixed mass, and Eq. 7 defines entropy as K = n_e^{-2/3}T. Since f_g at fixed mass is proportional to n_e, selecting low-f_g objects guarantees high-K objects at comparable T. Calling them 'extreme positive outliers' in the K-M plane thus repeats the selection in new thermodynamic coordinates. The mass incompleteness and environmental bias of the sample are acknowledged by the authors and are a representativeness caveat, not a circularity. Self-citations to Rasia et al. (2025) and Santoni et al. (2024) are used for model choices and expected correlations, but the paper verifies the parabolic fit itself and does not rely on a uniqueness theorem; those citations are not load-bearing enough to raise the score further. Overall, the main Y result is independent, but the entropy-excess sub-claim is a construction from the selection, giving a partial circularity score of 4.
Axiom & Free-Parameter Ledger
free parameters (5)
- Parabolic fg-M500 fit coefficients A, B, C (Eq. 2) =
not tabulated in text; shown only as curves in Fig. A.1
- Per-mass-bin residual Gaussian parameters μj, σ+_j =
e.g., σ+ = 0.059 for the lowest mass bin at z=0 (Fig. 2)
- Y-M fit normalization A and slope B (Eq. 8) =
A = 0.39–0.60, B = 1.58–1.63 (Table 3)
- 3σ selection threshold =
3
- Gas temperature cut T > 0.3 keV for M_g =
0.3 keV
axioms (5)
- domain assumption The Gadget-X subgrid physics (cooling, star formation, chemical evolution, two-mode AGN feedback) reproduces the ICM thermodynamics of real clusters
- domain assumption The parabolic functional form for fg-M500 (Eq. 2) is the correct baseline at all masses and redshifts
- ad hoc to paper The positive side of each mass-bin residual distribution is Gaussian and represents the 'normal' population; the negative tail is a distinct physical population
- domain assumption MDPL2 zoom-in initial conditions plus Planck 2015 cosmology adequately model large-scale structure
- domain assumption AHF-derived M500 is an unbiased total mass estimator
Cite this review
Pith. "Pith review of The Three Hundred project: Low Gas Fraction Galaxy Clusters properties and their environment." pith.science (2026). https://pith.science/paper/VFY3Y55R
@misc{pith2026260712607,
  author       = {Pith},
  title        = {Pith review of: The Three Hundred project: Low Gas Fraction Galaxy Clusters properties and their environment},
  year         = {2026},
  howpublished = {\url{https://pith.science/paper/VFY3Y55R}},
  note         = {Machine review of arXiv:2607.12607}
}
read the original abstract
Galaxy cluster samples based on X-ray and Sunyaev-Zel'dovich (SZ) observations are affected by selection biases. These catalogs preferentially include systems with high gas content and surface brightness. Excluding objects with depleted gas content, low-gas-fraction clusters (LGFCs), could lead to an incomplete sampling. We aim to investigate the abundance and the properties of the LGFCs population using The Three Hundred hydrodynamical simulations, focusing on the Gadget-X code. In particular, we study outliers in the $f_{\mathrm{g},500} - M_{500}$ relation, environmental influences, and their behavior in key scaling relations, with a focus on the Compton-Y observable. We analyze a sample of $N_{\mathrm{tot}} = 9858$ simulated objects from The Three Hundred, in the redshift band $z \in [0;0.817]$. LGFCs are selected statistically as outliers of the $f_{\mathrm{g},500}-M_{500}$ relation. To analyze environmental effects, we compare the gas density and temperature radial profiles of LGFCs against the No-LGFCs population. Finally, we study how the temperature, entropy, and spherical Compton parameter scaling relations are affected by the inclusion of LGFCs. We find that LGFCs are preferentially found at the low-mass end and their abundance increases toward low redshift. Radial profiles of LGFCs show lower gas concentrations in the core regions and higher temperatures, suggesting a more diffuse and heated ICM. This behavior is also reflected in the entropy scaling relation, where LGFCs are extreme positive outliers. Contrary to observations, the $Y_{\mathrm{sph},500}$ values of LGFCs show no significant deviation from the general population. Nevertheless, we cannot rule out that these differences are partly driven by the mass incompleteness at the low-mass end and the environmental bias of our simulated sample.
Figures


Reference graph
Works this paper leans on
-
[1]
2026, The Open Journal of Astrophysics, 9
Aguena, M., Aiola, S., Allam, S., et al. 2026, The Open Journal of Astrophysics, 9
2026
-
[2]
2022, PASJ, 74, 247
Aihara, H., AlSayyad, Y ., Ando, M., et al. 2022, PASJ, 74, 247
2022
-
[3]
2014, A&A, 570, L10
Andreon, S. 2014, A&A, 570, L10
2014
-
[4]
Andreon, S., Moretti, A., Trinchieri, G., & Ishwara-Chandra, C. H. 2019, A&A, 630, A78
2019
-
[5]
& Radovich, M
Andreon, S. & Radovich, M. 2025, ApJ, 985, 78
2025
-
[6]
L., Moretti, A., & Trinchieri, G
Andreon, S., Serra, A. L., Moretti, A., & Trinchieri, G. 2016, A&A, 585, A147
2016
-
[7]
2024, A&A, 686, A284
Andreon, S., Trinchieri, G., & Moretti, A. 2024, A&A, 686, A284
2024
-
[8]
Andreon, S., Wang, J., Trinchieri, G., Moretti, A., & Serra, A. L. 2017, A&A, 606, A24
2017
-
[9]
Arnaud, M., Pointecouteau, E., & Pratt, G. W. 2005, A&A, 441, 893
2005
-
[10]
J., Kay, S
Barnes, D. J., Kay, S. T., Bahé, Y . M., et al. 2017, MNRAS, 471, 1088
2017
-
[11]
M., Murante, G., Arth, A., et al
Beck, A. M., Murante, G., Arth, A., et al. 2016, MNRAS, 455, 2110
2016
-
[12]
2017, MNRAS, 468, 531
Biffi, V ., Planelles, S., Borgani, S., et al. 2017, MNRAS, 468, 531
2017
-
[13]
2018, MNRAS, 476, 2689–2703
Biffi, V ., Planelles, S., Borgani, S., et al. 2018, MNRAS, 476, 2689–2703
2018
-
[14]
R., Kofman, L., & Pogosyan, D
Bond, J. R., Kofman, L., & Pogosyan, D. 1996, Nature, 380, 603
1996
-
[15]
2004, MNRAS, 348, 1078
Borgani, S., Murante, G., Springel, V ., et al. 2004, MNRAS, 348, 1078
2004
-
[16]
N., Hill, J
Burrows, D. N., Hill, J. E., Nousek, J. A., et al. 2005, Space Sci. Rev., 120, 165
2005
-
[17]
2018, MNRAS, 479, 973
Codis, S., Pogosyan, D., & Pichon, C. 2018, MNRAS, 479, 973
2018
-
[18]
2022, MNRAS, 514, 977
Cui, W., Davé, R., Knebe, A., et al. 2022, MNRAS, 514, 977
2022
-
[19]
2018, MNRAS, 480, 2898
Cui, W., Knebe, A., Yepes, G., et al. 2018, MNRAS, 480, 2898
2018
-
[20]
& Geller, M
Diaferio, A. & Geller, M. J. 1997, ApJ, 481, 633
1997
-
[21]
2016, MNRAS, 463, 1797
Dolag, K., Komatsu, E., & Sunyaev, R. 2016, MNRAS, 463, 1797
2016
-
[22]
2019, A&A, 621, A40
Eckert, D., Ghirardini, V ., Ettori, S., et al. 2019, A&A, 621, A40
2019
-
[23]
2022, MNRAS, 518, 4238
Gianfagna, G., Rasia, E., Cui, W., et al. 2022, MNRAS, 518, 4238
2022
-
[24]
1986, MNRAS, 222, 323
Kaiser, N. 1986, MNRAS, 222, 323
1986
-
[25]
2016, MNRAS, 457, 4340
Klypin, A., Yepes, G., Gottlöber, S., Prada, F., & Heß, S. 2016, MNRAS, 457, 4340
2016
-
[26]
Knollmann, S. R. & Knebe, A. 2009, ApJS, 182, 608 Le Brun, A. M. C., McCarthy, I. G., Schaye, J., & Ponman, T. J. 2014, MNRAS, 441, 1270
2009
-
[27]
2020, ApJ, 892, 102
Lovisari, L., Schellenberger, G., Sereno, M., et al. 2020, ApJ, 892, 102
2020
-
[28]
B., Morris, R
Mantz, A. B., Morris, R. G., Allen, S. W., et al. 2021, MNRAS, 510, 131
2021
-
[29]
G., Schaye, J., Bird, S., & Le Brun, A
McCarthy, I. G., Schaye, J., Bird, S., & Le Brun, A. M. C. 2017, MNRAS, 465, 2936
2017
-
[30]
G., Schaye, J., Bower, R
McCarthy, I. G., Schaye, J., Bower, R. G., et al. 2011, MNRAS, 412, 1965
2011
-
[31]
J., Nichol, R
Miller, C. J., Nichol, R. C., Reichart, D., et al. 2005, AJ, 130, 968
2005
-
[32]
2021, Publications of the Astronomical Society of Japan, 73, 817
Oguri, M., Miyazaki, S., Li, X., et al. 2021, Publications of the Astronomical Society of Japan, 73, 817
2021
-
[33]
2007, Monthly Notices of the Royal Astronomical Society, 382, 1289
Pacaud, F., Pierre, M., Adami, C., et al. 2007, Monthly Notices of the Royal Astronomical Society, 382, 1289
2007
-
[34]
2026, Astronomy and Computing, 55, 101082 Planck Collaboration, Adam, R., Aghanim, N., et al
Pilipenko, S., Yepes, G., Gottlöber, S., & Knollmann, S. 2026, Astronomy and Computing, 55, 101082 Planck Collaboration, Adam, R., Aghanim, N., et al. 2016, A&A, 596, A108 Planck Collaboration, Ade, P. A. R., Aghanim, N., et al. 2015, A&A, 581, A14 Planck Collaboration, Ade, P. A. R., Aghanim, N., et al. 2014, A&A, 571, A20
2026
-
[35]
W., Arnaud, M., & Pointecouteau, E
Pratt, G. W., Arnaud, M., & Pointecouteau, E. 2006, Astronomy & Astrophysics, 446, 429
2006
-
[36]
W., Arnaud, M., Pointecouteau, E., et al
Pratt, G. W., Arnaud, M., Pointecouteau, E., et al. 2011, Astronomy & Astro- physics, 536, A10
2011
-
[37]
W., Croston, J
Pratt, G. W., Croston, J. H., Arnaud, M., & Böhringer, H. 2009, A&A, 498, 361
2009
-
[38]
Press, W. H. & Schechter, P. 1974, The Astrophysical Journal, 187, 425
1974
-
[39]
2008, ApJ, 687, L53
Puchwein, E., Sijacki, D., & Springel, V . 2008, ApJ, 687, L53
2008
-
[40]
& Andreon, S
Puddu, E. & Andreon, S. 2022, MNRAS, 511, 2968
2022
-
[41]
2022, Astronomy & Astrophysics, 666, A22
Ragagnin, A., Andreon, S., & Puddu, E. 2022, Astronomy & Astrophysics, 666, A22
2022
-
[42]
2015, ApJ, 813, L17
Rasia, E., Borgani, S., Murante, G., et al. 2015, ApJ, 813, L17
2015
-
[43]
2025, A&A, 702, A182
Rasia, E., Tripodi, R., Borgani, S., et al. 2025, A&A, 702, A182
2025
-
[44]
2024, Astronomy & Astrophysics, 692, A44
Santoni, S., De Petris, M., Yepes, G., et al. 2024, Astronomy & Astrophysics, 692, A44
2024
-
[45]
2013, MNRAS, 429, 323
Sembolini, F., Yepes, G., De Petris, M., et al. 2013, MNRAS, 429, 323
2013
-
[46]
L., Diaferio, A., Murante, G., & Borgani, S
Serra, A. L., Diaferio, A., Murante, G., & Borgani, S. 2011, MNRAS, 412, 800
2011
-
[47]
2011, MNRAS, 414, 350
Sousbie, T. 2011, MNRAS, 414, 350
2011
-
[48]
2005, MNRAS, 364, 1105
Springel, V . 2005, MNRAS, 364, 1105
2005
-
[49]
& Hernquist, L
Springel, V . & Hernquist, L. 2003, MNRAS, 339, 289
2003
-
[50]
Sunyaev, R. A. & Zeldovich, Y . B. 1970, Astrophysics and Space Science, 7, 3
1970
-
[51]
2007, MNRAS, 382, 1050
Tornatore, L., Borgani, S., Dolag, K., & Matteucci, F. 2007, MNRAS, 382, 1050
2007
-
[52]
A., Ebeling, H., et al
Vikhlinin, A., Burenin, R. A., Ebeling, H., et al. 2009, The Astrophysical Journal, 692, 1033
2009
-
[53]
A., Simionescu, A., Nagai, D., et al
Walker, S. A., Simionescu, A., Nagai, D., et al. 2019, Space Sci. Rev., 215, 7
2019
-
[54]
2025, A&A, 694, A256
Zarattini, S., Andreon, S., & Puddu, E. 2025, A&A, 694, A256
2025
-
[55]
J., Nagamine, K., Oku, Y ., et al
Zhang, Z. J., Nagamine, K., Oku, Y ., et al. 2026, arXiv e-prints [arXiv:2503.12741] Article number, page 12 Francesco Guidi et al.: The300 project: Low Gas Fraction Galaxy Cluster properties and their environment Appendix A: Redshift evolution of thef gas,500 −M 500 relation In Fig. A.1 we report the redshift evolution of thef g,500−M 500 relation. We re...
arXiv 2026
This paper was first reviewed by deepseek-v4-flash on August 2, 2026.
discussion (0)
Sign in with ORCID, Apple, or X to comment. Anyone can read and Pith papers without signing in.