REVIEW 3 major objections 4 minor 58 references
Experimental determination of the Dalitz plot for positronium decay using the J-PET detection system
T0 review · 3 major / 4 minor · reviewed 2026-08-01 · deepseek-v4-flash
Pith's one-line read This paper presents the first measurement of the Dalitz plot for ortho-positronium decay into three photons, across nearly all of the allowed phase space.
desk verdict First Dalitz plot measurement is real, but the QED agreement is baked into the analysis via LO-based corrections. read the letter →
The pith
A machine-rendered reading of the paper's core claim, the machinery that carries it, and where it could break.
The reading
What carries the argument
The central object is the Dalitz plot in angular representation — a two-dimensional histogram of decay-event density over two independent angular variables that fully specify the three-photon final state. The mechanism that carries the argument is the event-selection and correction pipeline: three-photon hits are selected by timing, energy-deposition, and angular-correlation cuts; a template fit subtracts misreconstructed signal and background; and a Monte Carlo efficiency map, built by simulating events generated from the leading-order QED amplitude and passing them through the same selection, corrects the measured distribution bin by bin. The comparison of the corrected plot to leading-ord
What would settle it
Re-analyze the same 33 million events using an efficiency map and a misreconstructed-signal template generated from the next-to-leading-order QED matrix element instead of the leading-order one; if any bins of the corrected Dalitz plot shift by more than the quoted systematic uncertainties, the extraction is not independent of the theoretical input. Alternatively, a bin-by-bin deviation pattern in the corner regions that persists under independent variations of all selection cuts would show the true distribution does not match the assumed QED shape.
Extended reading notes
Core claim
On its own terms, the paper reports the first experimental determination of the Dalitz plot for ortho-positronium decay into three photons, covering almost the entire available phase space except for low-energy-photon configurations with relative angles larger than about 170 degrees. After subtracting misreconstructed signal and background using a template fit and correcting with a Monte Carlo efficiency map, the resulting angular distribution is consistent with both the leading-order QED matrix element and the O(alpha)-corrected prediction. The measured distribution contains 33.42 million identified o-Ps to 3-gamma events and has statistical uncertainty of about 3% and systematic uncertaint
Load-bearing premise
The measured Dalitz plot is corrected with an efficiency map, and the background is subtracted using templates, both built from Monte Carlo events generated with the leading-order QED matrix element; if the true differential distribution differs from leading order in a way that changes the per-bin acceptance, the correction pulls the measurement toward the predicted shape, so the 'consistent with QED' conclusion is at least partly a consequence of the analysis procedure rathe
Editorial extensions
If this is right
- The measurement provides the first nearly complete map of the o-Ps to 3-gamma differential decay rate, replacing the three discrete angular points measured in 1967.
- The data set a reference for future tests of higher-order QED corrections, since the difference between leading-order and O(alpha) predictions in the region of interest is about 1.5–2.5% and the current statistical uncertainty is about 3%.
- The result validates the J-PET detector concept for multiphoton final-state measurements, which is relevant to positronium imaging and discrete-symmetry searches that rely on correlated photon kinematics.
- The measurement quantifies the unmeasured corner of the Dalitz plot (low-energy photons with relative angles above 170 degrees), showing where detector thresholds currently limit sensitivity and where future detectors could extend coverage.
- Within uncertainties, the agreement with both leading-order and next-to-leading-order QED predictions supports the use of the standard Ore-Powell amplitude as a reliable input for positronium-related simulations and medical-imaging applications.
Reading between the lines
- Because the efficiency map and the misreconstructed-signal template are both generated from Monte Carlo events produced with the leading-order QED matrix element, the correction procedure will pull the measured Dalitz plot toward the leading-order shape if the true distribution differs bin-by-bin; the agreement with QED should therefore be read as a consistency check rather than a fully model-inde
- The same template-subtraction analysis could be rerun with a shape model that allows free deviations—for example, a bin-by-bin amplitude factor or an NLO-shape template—turning the measurement into a genuine fit for higher-order or symmetry-violating coefficients.
- If the projected order-of-magnitude statistical improvement is achieved, the 1.5–2.5% difference between LO and NLO predictions shown in the paper's comparison becomes resolvable, making the Dalitz plot a sensitive, multidimensional probe of O(alpha) QED corrections in positronium decay.
- The angular representation chosen here is well matched to a detector that measures photon directions with roughly 1-degree resolution but has an energy threshold near 30 keV; lowering that threshold in future detectors could extend the plot into the currently missing corner and directly test the expected suppression of the matrix element at the kinematic boundary.
Signed reviews
Editorial analysis
A structured set of objections, weighed in public.
Referee Report
Summary. The manuscript reports the first measurement of the Dalitz plot for ortho-positronium decay into three photons, performed with the J-PET detector. Using a 22Na source and a porous XAD-4 target, the authors identify 33 million o-Ps→3γ candidates. After event selection based on hit multiplicity, time-over-threshold, decay-plane distance, timing, and angular correlations, a one-dimensional fit (Eq. 4) separates reconstructed signal, misreconstructed signal, and background, with the two signal templates taken from Monte Carlo generated with the leading-order QED matrix element. The final angular Dalitz plot is corrected by an efficiency map obtained from the same Monte Carlo and is stated to be consistent with both leading-order and next-to-leading-order QED predictions, with about 3% statistical and 2-3% systematic uncertainty over most of the phase space.
Significance. If the result holds, this is the first nearly complete experimental map of the differential three-photon decay distribution of ortho-positronium, a quantity that has been poorly explored since the early angular measurements of Mills and Berko. The detector description, the large event sample, and the explicit treatment of backgrounds are strengths. However, the QED-consistency conclusion is weakened by the fact that the acceptance/efficiency correction and the misreconstructed-signal template are both derived from the leading-order theory under test. The measurement itself is valuable, but the paper currently overstates the independence of the QED test.
major comments (3)
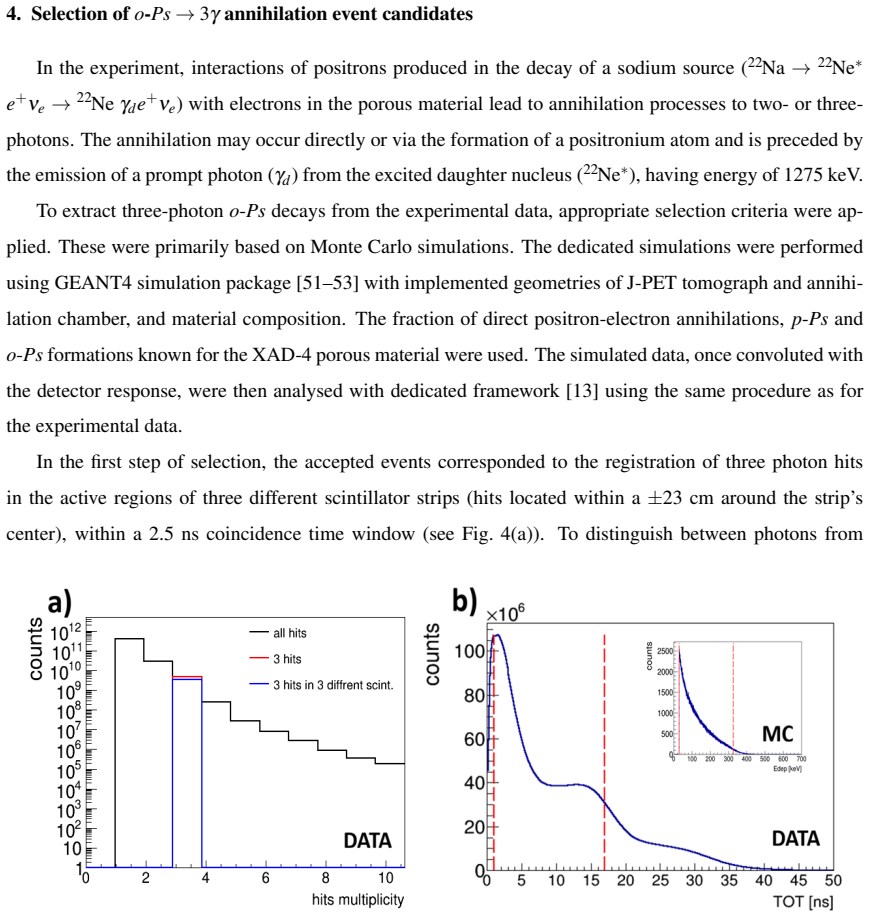
- [§5 and Eq. (4)] The acceptance/efficiency correction in §5 and the misreconstructed-signal template subtracted in the fit of Eq. (4) are both computed from Monte Carlo generated with the LO QED matrix element (Eq. 2; Fig. 8a). The final Dalitz plot is therefore corrected with a model-dependent map. If the true o-Ps→3γ distribution differs from LO, for example by the O(α) corrections shown in Fig. 2 to be 1.5–2.5% in the accessible region, the per-bin average efficiency and the misreconstructed fraction can shift. Because the same amplitude A is used for reconstructed and misreconstructed templates in Eq. (4), a deviation from LO can be partially absorbed by the fit normalization. The systematic uncertainties are estimated only by varying selection cuts; no variation of the generator model or closure test is reported. Thus the statement that the result is 'consistent with both the leading-order and next-
- [§5/§6] No quantitative comparison with theory is provided. The text says the distribution is in agreement with LO QED (Sec. 6) and consistent with NLO (abstract), but the paper reports no χ², residual distribution, or confidence level for data versus either LO or NLO predictions. Since the bin-by-bin uncertainties are about 3% statistical and 2–3% systematic, a residual plot with uncertainties (or a data table) is necessary to judge whether the agreement is good or merely not excluded. This is central to the consistency claim.
- [Eq. (4)] The statistical model in Eq. (4) is not standard as written. The denominator contains A²(N_sig_i + N_mis_i) + B² N_bcg_i. If N_sig_i and N_bcg_i are template counts scaled by A and B, the expected Poisson variance of the model contribution is A N_sig_i + B N_bcg_i, not A² times the template. If the templates are normalized to unit integrals, the meaning of A,B and this variance should be stated. As written, the χ² value and the fitted uncertainties depend on an arbitrary convention. Please clarify or correct the expression; otherwise the quoted statistical uncertainty of the extracted distribution is not well defined.
minor comments (4)
- [Fig. 2] The y-axis label says 'NLO−NLO+O(α)' while the caption/text describe the difference between LO and LO+O(α). Please make the notation consistent.
- [§5, Fig. 8] The right subpanels of Fig. 8 show systematic uncertainties for 'regions 1 and 2', but these regions are not defined in the text. Please define the boundaries of the regions or refer to the green region explicitly.
- [§2] There is a typo: 'Kracow' should be 'Kraków'.
- [General] For a first measurement of this kind, it would be helpful to provide a data table of the final Dalitz plot values (and uncertainties) as a supplement or in HEPData, so that the result can be used by theorists.
Circularity Check
Dalitz consistency partly inherits the LO QED model via acceptance and misreconstruction corrections.
-
fitted input called prediction
[Sec. 4 (Eq. 4) and Sec. 5 (efficiency correction; Fig. 8)]
"The distribution was corrected for overall detection and reconstruction efficiency map determined based on performed Monte Carlo simulation. The efficiency was calculated as the ratio of the number of reconstructed events to the number of generated events for each angular interval in the Dalitz spectrum. ... a) Generated Dalitz distribution based on the QED predictions for LO decay process with the same binning as that applied in experimental data analysis."
To the extent that the Monte Carlo used for the efficiency map and the misreconstructed-signal template is the same LO-QED simulation shown in Fig. 8a, Eq. (4) subtracts an LO-derived misreconstruction template while Sec. 5 divides by an LO-derived efficiency. The corrected Dalitz plot is thus (N_exp - A*N_mis-rec-sig - B*N_bcg)/epsilon_LO, with both the subtracted template and the efficiency computed from the model under test. Any true NLO deviation that changes the misreconstruction rate or per-bin acceptance is partially removed or reweighted toward the LO prediction. The quoted systematic uncertainties are obtained by varying selection cuts, not by changing the generator model, so the 'consistent with LO/NLO' conclusion is not an independent differential-QED test, although the raw dist
full rationale
The paper's first-measurement claim is largely independent of this issue: the raw background-subtracted Dalitz distribution (Fig. 8b) and the fitted normalization are data-driven, and the comparison to LO and NLO QED uses external matrix elements (Ore-Powell; Adkins). However, the efficiency correction and misreconstructed-signal subtraction are model-dependent in a way that biases the final corrected distribution toward the LO generator used in the simulation. Because the systematic error does not include a generator-model variation, the conclusion of consistency with QED is partially circular. The circularity is not complete—the data are not mathematically forced to match LO—so a moderate score of 4 is appropriate rather than a higher one. No other circular steps, self-citation chains, or imported uniqueness theorems appear in the derivation.
Assumptions & free parameters
free parameters (2)
- A (signal normalization)
- B (background normalization)
assumptions (5)
- domain assumption The LO QED matrix element (Eq. 2, Ore-Powell) correctly generates the o-Ps→3γ signal and misreconstructed-signal templates.
- domain assumption The GEANT4/J-PET detector simulation accurately reproduces the response, resolution, and per-strip efficiency.
- domain assumption TOT width is a valid energy proxy and the 1-17 ns range selects annihilation photons.
- domain assumption The known fractions of 2γ, p-Ps, o-Ps in XAD-4 and the source geometry used in MC match the real chamber.
- ad hoc to paper The fit in Eq. (4) with three templates fully describes the data after the 1D transform.
Cite this review
Pith. "Pith review of Experimental determination of the Dalitz plot for positronium decay using the J-PET detection system." pith.science (2026). https://pith.science/paper/K4A2NCRD
@misc{pith2026260719495,
  author       = {Pith},
  title        = {Pith review of: Experimental determination of the Dalitz plot for positronium decay using the J-PET detection system},
  year         = {2026},
  howpublished = {\url{https://pith.science/paper/K4A2NCRD}},
  note         = {Machine review of arXiv:2607.19495}
}
read the original abstract
We present the first measurements of the Dalitz plot for ortho-positronium annihilation to three photons. Our measurements, accurate to about 3% statistical and 2-3% systematic uncertainty in angular representation over almost the entire available phase space, were performed using the Jagiellonian Positron Emission Tomograph (J-PET) based on organic scintillator strips. Until now, the Dalitz plot for the three-body positronium decay has been poorly explored. The new measurements presented here are consistent with both the leading-order and next-to-leading order QED predictions for the Dalitz plot.
Figures


Figures from the paper (5 more)


Reference graph
Works this paper leans on
-
[1]
G. S. Adkins, D. B. Cassidy, J. Perez-Rios, Phys. Rep.975, 1 (2022)
2022
-
[2]
D. B. Cassidy, Eur. Phys. J. D72, 53 (2018). 14
2018
-
[3]
S. D. Bass, S. Mariazzi, P. Moskal, E. St˛ epie´n, Rev. Mod. Phys.95, 021002 (2023)
2023
-
[4]
S. D. Bass, Acta Phys. Polon. B50, 7 (2019)
2019
-
[5]
Czarnecki, D
A. Czarnecki, D. Dagia, T. Gao and R. Toor, Phys. Rev. D113, 073002 (2026)
2026
-
[6]
Piotrowska and F
M. Piotrowska and F. Giacosa, Acta Phys. Polon. A146, 699 (2024)
2024
-
[7]
Moskal, et al., Nature Communications12, 5658 (2021)
P. Moskal, et al., Nature Communications12, 5658 (2021)
2021
-
[8]
Moskal, et al., Nature Communications15, 78 (2024)
P. Moskal, et al., Nature Communications15, 78 (2024)
2024
Show all 58 references
-
[9]
Chug et al., Phys
N. Chug et al., Phys. Rev. D113, 032003 (2026)
2026
-
[10]
R. J. Daly et al., Phys. Rev. A112, 062801 (2025)
2025
-
[11]
Moskal, B
P. Moskal, B. Jasinska, E. St˛ epie´n, and S. D. Bass, Nat. Rev. Phys.1, 527 (2019)
2019
-
[12]
Moskal, et al., Sci
P. Moskal, et al., Sci. Adv.7, eabh4394 (2021)
2021
-
[13]
Moskal, et al., Sci
P. Moskal, et al., Sci. Adv.10, eadp2840 (2024)
2024
-
[14]
Moskal, Proc
P. Moskal, Proc. 2019 IEEE Nucl. Sci. Symp. Med. Imaging Conf. (NSS MIC), 1 (2019)
2019
-
[15]
Das, et al., IEEE Trans
M. Das, et al., IEEE Trans. Radiat. Plasma Med. Sci.10(4), 593 (2026)
2026
-
[16]
Das, et al., Scientific Reports16, 16230 (2026)
M. Das, et al., Scientific Reports16, 16230 (2026)
2026
-
[17]
Kubat, et al., Journal of Medical Physics (Article in Press), (2026)
K. Kubat, et al., Journal of Medical Physics (Article in Press), (2026)
2026
-
[18]
Kasperska, M
K. Kasperska, M. Skurzok and P. Moskal, Bio-Algorithms and Med-Systems21, 42 (2025)
2025
-
[19]
Moskal, et al., Sci
P. Moskal, et al., Sci. Adv.11, ads3046 (2025)
2025
-
[20]
Moskal, Bio-Algorithms and Med-Systems22, 56 (2026)
P. Moskal, Bio-Algorithms and Med-Systems22, 56 (2026)
2026
-
[21]
Sozzi,Discrete Symmetries and CP Violation, Oxford University Press (2008)
M. Sozzi,Discrete Symmetries and CP Violation, Oxford University Press (2008)
2008
-
[22]
Moskal, et al., Acta Phys
P. Moskal, et al., Acta Phys. Polon. B47, 509 (2016)
2016
-
[23]
A. Ore, J. L. Powell, Phys. Rev.75, 1696 (1949)
1949
-
[24]
Berestetskii, E
V . Berestetskii, E. Lifshitz, L. Pitaevskii,Relativistic Quantum Theory, Pergamon Press (1971). 15
1971
-
[25]
G. S. Adkins, Phys. Rev. A72, 032501 (2005)
2005
-
[26]
R. H. Dalitz, Phys. Rev.94(4), 1046 (1954)
1954
-
[27]
Amsler, Rev
C. Amsler, Rev. Mod. Phys.70, 1293 (1998)
1998
-
[28]
Adolphet al.[W ASA-at-COSY], Phys
C. Adolphet al.[W ASA-at-COSY], Phys. Lett. B677, 24 (2009)
2009
-
[29]
R. E. Mitchell, et al. (CLEO Collaboration), Phys. Rev. D79, 072008 (2009)
2009
-
[30]
Aaij, et al
R. Aaij, et al. (LHCb Collaboration), JHEP04, 063 (2019)
2019
-
[31]
Ablikim et al
M. Ablikim et al. (BES-III Collaboration), Phys. Lett. B710, 594 (2012)
2012
-
[32]
A. P. Mills and S. Berko, Phys. Rev. Lett.18, 420 (1967)
1967
-
[33]
R. S. Vallery, P. W. Zitzewitz and D. W. Gidley, Phys. Rev. Lett.90, 203402 (2003)
2003
-
[34]
Jinnouchi, S
O. Jinnouchi, S. Asai and T. Kobayashi, Phys. Lett. B572, 117 (2003)
2003
-
[35]
Kataoka, S
Y . Kataoka, S. Asai and T. Kobayashi, Phys. Lett. B671, 219 (2009)
2009
-
[36]
Adachi et al., J
S. Adachi et al., J. Phys. Conf. Ser.618, 012007 (2015)
2015
-
[37]
R. E. Sheldon, T. J. Babij, S. H. Reeder, S. D. Hogan and D. B. Cassidy, Phys. Rev. Lett.131, 043001 (2023)
2023
-
[38]
Gurung, T
L. Gurung, T. J. Babij, S. D. Hogan, and D. B. Cassidy, Phys. Rev. Lett.125, 073002 (2020)
2020
-
[39]
Gurung, T
L. Gurung, T. J. Babij, J. Perez-Rios, S. D. Hogan, and D. B. Cassidy, Phys. Rev. A103, 042805 (2021)
2021
-
[40]
L. d. Borges, E. Thorpe-Woods, E. Javary and P. Crivelli, Phys. Rev. A113, 032804 (2026)
2026
-
[41]
Moskal, et al., Nucl
P. Moskal, et al., Nucl. Instrum. Methods Phys. Res. A764, 317 (2014)
2014
-
[42]
Nied´ zwiecki et al., Acta Phys
S. Nied´ zwiecki et al., Acta Phys. Polon. B48, 1567 (2017)
2017
-
[43]
Das, et al., Bio-Algorithms and Med-Systems20, 101 (2024)
M. Das, et al., Bio-Algorithms and Med-Systems20, 101 (2024)
2024
-
[44]
Tiwari, S
S. Tiwari, S. Sharma and P. Moskal, Bio-Algorithms and Med-Systems21, 13 (2025)
2025
-
[45]
Radler, P
M. Radler, P. Moskal, Bio-Algorithms and Med-Systems21, 1 (2025). 16
2025
-
[46]
Gorgol, et al., Acta
M. Gorgol, et al., Acta. Phys. Polon. B51, 293 (2020)
2020
-
[47]
Pałka, et al., JINST12, P08001 (2017)
M. Pałka, et al., JINST12, P08001 (2017)
2017
-
[48]
Korcyl, et al., IEEE Trans
G. Korcyl, et al., IEEE Trans. Med. Imaging37, 2526 (2018)
2018
-
[49]
Kacprzak, et al., Bio-Algorithms and Med-Systems22, 36 (2026)
K. Kacprzak, et al., Bio-Algorithms and Med-Systems22, 36 (2026)
2026
-
[50]
Jasi ´nska, et al., Acta Phys
B. Jasi ´nska, et al., Acta Phys. Polon. B47, 453 (2016)
2016
-
[51]
Allison, et al., Nucl
J. Allison, et al., Nucl. Instrum. Methods Phys. Res. Sect. A835, 186 (2016)
2016
-
[52]
Allison, et al., IEEE Trans
J. Allison, et al., IEEE Trans. Nucl. Sci.53, 270 (2006)
2006
-
[53]
Agostinelli et al., Nucl
S. Agostinelli et al., Nucl. Instrum. Meth. A506, 250 (2003)
2003
-
[54]
Sharma, et al., EJNMMI Phys.7, 1 (2020)
S. Sharma, et al., EJNMMI Phys.7, 1 (2020)
2020
-
[55]
Fred and M
J. Fred and M. Winkler, MINUIT User’s Guide (2004)
2004
-
[56]
Sharma, et al., EJNMMI Phys.10, 28 (2023)
S. Sharma, et al., EJNMMI Phys.10, 28 (2023)
2023
-
[57]
Tayefi Ardebili, P
F. Tayefi Ardebili, P. Moskal, Bio-Algorithms and Med-Systems220, 1 (2024)
2024
-
[58]
Korcyl, M
G. Korcyl, M. Bakalarek, P. Moskal, Measurement257, 118528 (2026). 17
2026
Reviewed August 1, 2026 · model on record in the stance chip above.
Discussion (0). Continue with ORCID to comment.