REVIEW 3 major objections 4 minor 1 cited by
Mid-Infrared Colors Vary with Galactic Environment: Contrasting Star-Forming Disks, Young Centers, and Quiescent Star-Formation Deserts
T0 review · 3 major / 4 minor · reviewed 2026-08-01 · deepseek-v4-flash
Pith's one-line read This paper finds that mid-infrared colors of the diffuse interstellar medium in 71 nearby star-forming galaxies stay uniform across normal disks but change measurably in two extreme environments—young star-forming centers and quiescent bulg
desk verdict Solid 71-galaxy taxonomy with a well-validated CMZ story; the bulge neutral-PAH claim is intriguing but rests on a starlight-subtraction systematic the paper itself flags — referee-worthy, but that part should be framed as provisional. read the letter →
The pith
A machine-rendered reading of the paper's core claim, the machinery that carries it, and where it could break.
The reading
What carries the argument
The analysis uses starlight-subtracted MIRI band ratios, especially F770W/F2100W (calibrated to R*_PAH), F770W/F1130W, and F1000W/F2100W, with F300M used as the stellar template. The load-bearing comparisons are (1) far-infrared dust colors and F2100W/ΣMol as independent indicators of radiation intensity U, showing CMZ color suppression tracks U; and (2) the F335M-based 3.3 µm PAH feature plus 11.3 µm to break degeneracies between radiation hardness, PAH charge, and PAH size—this is what isolates neutral PAHs as the bulge explanation.
What would settle it
Take MIRI spectra (or medium-band photometry) of the 7.7, 11.3, and 3.3 µm features in the four bulges with full filter coverage; if the 7.7/11.3 decrement shrinks or vanishes once starlight is subtracted spectrally rather than photometrically via a scaled 3 µm image, the neutral-PAH interpretation fails. Similarly, if far-infrared colors and F2100W/ΣMol were to show CMZ U is not elevated, the radiation-intensity explanation fails.
Extended reading notes
Core claim
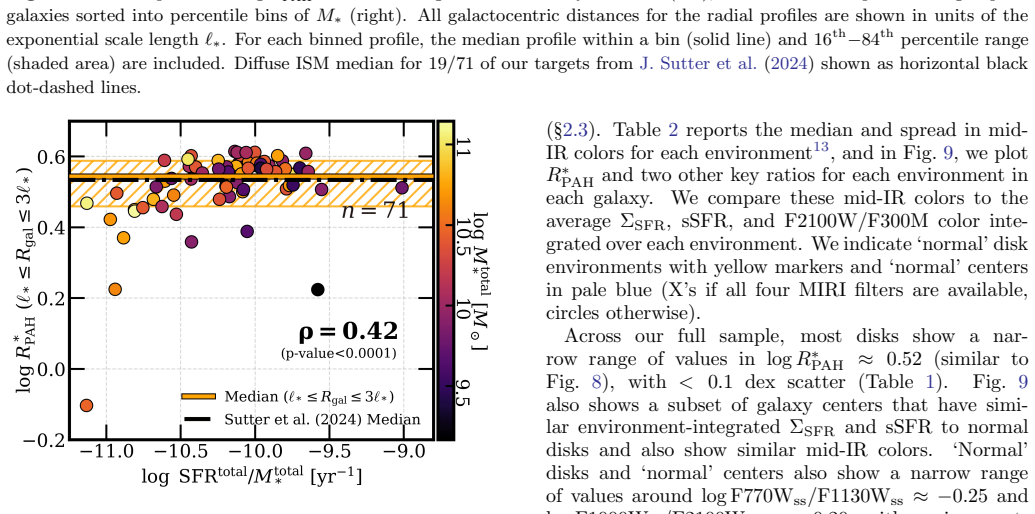
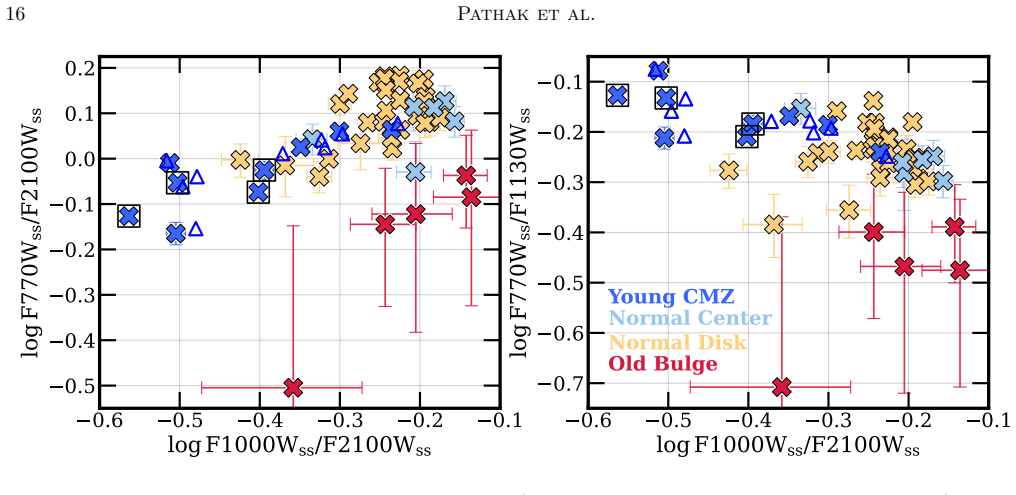
The central claim is that mid-infrared colors of the diffuse ISM are a reliable environmental classification tool: PAH band-ratio colors are nearly constant in normal disks (log F770W/F2100W ≈ 0.52, scatter <0.1 dex), but depart in opposite directions at the two extremes. In central molecular zones the PAH-to-continuum and 10 µm/21 µm colors are depressed by 0.2–0.4 dex because the local radiation intensity U is high, not because PAHs are destroyed; in quiescent bulges and star-formation deserts only the 7.7 µm band is suppressed, indicating more neutral PAHs. The paper also positions F2100W/ΣMol as a practical high-resolution tracer of U and shows a single continuous trend (ρ = 0.86) connec
Load-bearing premise
The claim that bulges host unusually neutral PAHs rests on the model-based starlight subtraction being accurate in exactly the old-stellar regions where the paper states that subtraction is the dominant source of uncertainty.
Editorial extensions
If this is right
- If correct, mid-IR PAH-band ratios in diffuse disks can serve as a stable baseline; deviations flag extreme environments.
- In star-forming centers, a depressed 7.7/21 color should not be read as PAH destruction; it mostly records a stronger radiation field.
- F2100W/ΣMol can be used as a kpc-scale U tracer, validated against far-infrared colors, useful where far-IR data are unavailable.
- Quiescent bulges join early-type galaxies: low 7.7/11.3 indicates neutral PAHs, so PAH charge must be included to estimate PAH mass in quiescent systems.
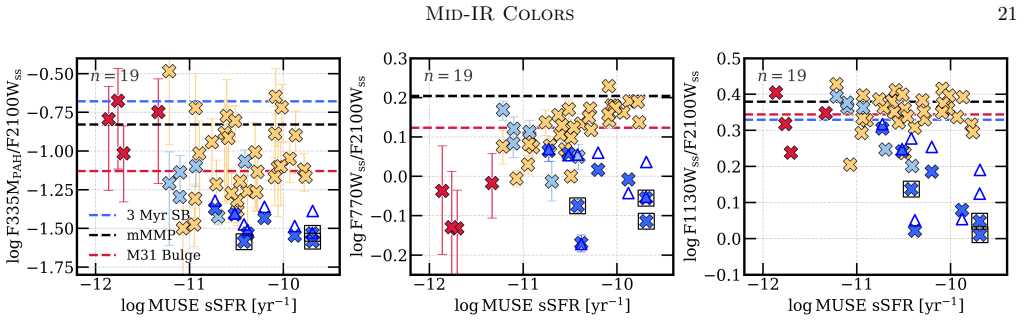
- All environments lie on a single 7.7/11.3 vs sSFR trend, so specific star-formation rate predicts PAH charge state in normal galaxies.
Reading between the lines
- Editorial inference: because the 7.7 µm band is suppressed in quiescent systems, PAH abundances inferred from 7.7 µm alone in bulges or early-type galaxies would be systematically underestimated; an 11.3 µm-based tracer would behave differently.
- Editorial inference: the F2100W/ΣMol tracer could be ported to high-redshift galaxies where far-IR photometry is absent but CO and mid-IR photometry exist.
- Editorial inference: the paper's 7.7/11.3–sSFR relation could be tested spectroscopically in individual bulges to see whether the neutral-PAH signature is spatially uniform or confined to the most FUV-poor pockets.
Editorial analysis
A structured set of objections, weighed in public.
Referee Report
Summary. This paper presents JWST/MIRI and NIRCam measurements of diffuse mid-infrared colors in 71 nearby star-forming galaxies from PHANGS-JWST, with a focus on how PAH-related band ratios vary with galactic environment. The authors report that standard PAH ratios are roughly constant across normal star-forming disks (log R*_PAH ≈ 0.52, <0.1 dex scatter), but that young central molecular zones (CMZs) show depressed PAH-to-continuum and 10/21 µm colors, which they attribute to high radiation-field intensity U, and that quiescent bulges/star-formation deserts show selectively low 7.7 µm emission, interpreted as evidence for more neutral PAHs. All environments are claimed to follow a continuous trend between F770W/F1130W and specific star-formation rate. The analysis includes careful treatment of backgrounds, nebular masking, and median-based color definitions, and the paper provides a machine-readable table of environment-integrated measurements.
Significance. If the conclusions hold, this would be an important reference result: the first large-sample JWST/MIRI census of diffuse mid-IR colors across environments, with a public catalog and several cross-checks (ratio-of-medians vs median-of-ratios, nebular masking, anchoring to WISE, far-IR validation). The CMZ interpretation of high U is supported by independent far-IR colors and F2100W/ΣMol, and the disk plateau is a clean, useful benchmark. The bulge neutral-PAH claim is more fragile, however, because it hinges on the starlight subtraction in exactly the regions where that subtraction is acknowledged to dominate the uncertainty, and because the discriminating data exist for only 4 of 13 bulges. The paper is therefore significant but requires a systematic-error demonstration before the bulge interpretation can be accepted.
major comments (3)
- [§2.1.2, §3.3.2, §4.4] The bulge-specific result (low F770Wss with normal F1130Wss and F335M_PAH, interpreted as neutral PAHs) rests on the F300M starlight subtraction, which the paper itself identifies as the dominant uncertainty in bulges. Since the F770W correction coefficient (0.22) is twice the F1130W coefficient (0.11), a correlated overestimate of the 7.7 µm stellar component will suppress F770Wss relative to F1130Wss preferentially in F300M-bright bulges. The quoted ±0.08 is CIGALE model scatter, not a systematic error term; if the true old-population SED shifts the factor from 0.22 toward ~0.14, the bulge F770W deficit shrinks substantially and the neutral-PAH signature weakens. I request a systematic-error demonstration: vary the scaling factor within a plausible SED range, or cross-check with an independent stellar template, and show how the bulge F770W/F1130W contrast responds. Without this, the ce
- [§2.3, Table 2, Fig. 9] The young-CMZ sample is selected by median F2100W > 10 MJy/sr, and the headline contrasts (R*_PAH, F770W/F2100W, F1130W/F2100W, F1000W/F2100W) all have F2100W in the denominator. A selection cut on a quantity that appears in the measured ratio necessarily contributes to the apparent contrast; the abstract's '0.2–0.4 dex lower' is therefore not an independent measurement of the physical suppression. The supporting far-IR colors (Fig. 12) and F2100W/ΣMol do argue for high U, so this is not fatal, but the paper should quantify the selection covariance—e.g., re-derive the CMZ contrast after selecting centers on ΣSFR or F770W rather than F2100W, and report the induced offset. In addition, the abstract's 0.2–0.4 dex range appears to exceed the environment medians in Table 2 (e.g., log F770Wss/F2100Wss: disks 0.11 vs CMZs −0.03, a 0.14 dex difference); please clarify whether the headline refers
- [§4.4, Table 2, Figs. 14–15] The neutral-PAH interpretation rests on a small and partially unpublished dataset: F770Wss/F1130Wss is available for only 4 of 13 bulges, and the F335M_PAH maps (from a submitted paper) are used with a matched-pixel detection criterion of ≥25% coverage. Moreover, the D21 models do not reproduce the observed bulge colors even in the limiting 100%-neutral-PAH case (Figs. 11 and 15), so the model comparison brackets but does not independently confirm the charge interpretation. The claim should be explicitly framed as 'consistent with more neutral PAHs, subject to starlight-subtraction systematics and small-number statistics,' with a clear call for spectroscopic follow-up, rather than presented as a secure physical conclusion.
minor comments (4)
- [Abstract, §3.3.1] Please reconcile the stated 0.2–0.4 dex CMZ contrasts with the median values reported in Table 2; if the range applies only to the most extreme dense diffuse regions, state that explicitly.
- [§2.4, Fig. 9 captions] For 32 galaxies without MUSE, sSFR is proxied by F2100W/F300M. Since the two populations are plotted together, the figure captions and Table 3 should always flag which sSFR estimator is used for each point.
- [§4.4] The F335M_PAH maps from H. Koziol et al. (submitted) are central to the size/charge disentanglement. Please provide public access or a detailed reproducibility statement, since the submitted reference is not yet citable.
- [General] The manuscript contains several typographical/layout artifacts (e.g., 'T able', 'Y oung', 'V ary', 'F335MP AH') and should be copy-edited before resubmission.
Circularity Check
CMZ color contrasts are partly built into the F2100W-based selection; bulge neutral-PAH interpretation rests on acknowledged starlight-subtraction systematics but is not a circular reduction.
-
self definitional
[§2.4 (CMZ selection), §3.3.1 and Table 1 (CMZ R*_PAH result), Eq. 1]
"We select young star-forming centers as galaxy center regions within the M. Querejeta et al. (2021) mask where the median F2100W intensity is >10 MJy sr−1. ... CMZs on average show 0.15 dex lower R∗PAH than normal star-forming disks ... R∗PAH = 2.57 F770Wss/F2100Wss (Eq. 1)."
The definition of a 'young CMZ' uses exactly the quantity that appears in the denominator of the headline colors. With F2100W > 10 MJy/sr enforced for CMZs while disks have lower F2100W, ratios such as R*_PAH = F770W/F2100W and F1000W/F2100W are depressed even for unchanged PAH/continuum numerators; part of the 0.15–0.4 dex CMZ contrast is therefore a construction of the selection. This is only partial: the numerator bands are independently measured, and the paper's high-U interpretation is additionally validated by Herschel far-IR colors and F2100W/ΣMol.
-
other
[§3.2 and Fig. 9 (R*_PAH–sSFR correlation)]
"Fig. 9 shows a moderate correlation between environment-integrated sSFR and R∗PAH in ‘normal’ disks (ρ= 0.47). ... log R∗PAH ... as a function of ... log F2100W/F300M (bottom row)."
For the 32 galaxies without MUSE, sSFR is represented by F2100W/F300M (§2.4), while R*_PAH = 2.57 F770W/F2100W. The shared F2100W factor in the two variables can create or inflate an apparent correlation without any change in PAH physics. This is a secondary, partial artifact: the paper also reports correlations against MUSE sSFR for 42 galaxies, and its headline F770W/F1130W–sSFR trend does not share F2100W.
full rationale
The paper's core claims are observational measurements rather than fitted predictions, and the main physical interpretations are cross-checked with independent data: the high-U attribution for CMZs is validated against Herschel far-IR colors and F2100W/ΣMol, while the bulge neutral-PAH inference is drawn from multiple color ratios (F770W/F1130W, F335M_PAH/F1130W) rather than from a fitted parameter renamed as a result. The starlight-subtraction factors adopted from J. Sutter et al. (2024) are an external CIGALE-based calibration, and the paper itself flags that subtraction is the dominant uncertainty in bulges; a possible systematic error there is a correctness risk, not a circular step. Self-citations (Sutter et al. 2024; Koziol et al. submitted) are used for calibration and maps but do not smuggle in the environment result. The genuine partial circularity is that the CMZ class is selected by F2100W > 10 MJy/sr while the headline colors put F2100W in the denominator, so part of the depression is built into the classification; similarly, the R*_PAH-vs-sSFR correlation shares F2100W when the sSFR proxy is F2100W/F300M. These issues do not collapse the paper: the numerator bands are independently measured, the far-IR checks provide outside support, and the central F770W/F1130W-vs-sSFR trend is not affected by the shared-variable artifact. Score 4 reflects partial, not total, circularity.
Assumptions & free parameters
free parameters (5)
- R*_PAH scaling constant =
2.57
- Starlight subtraction scaling factors =
F770W: 0.22±0.08; F1000W: 0.14±0.02; F1130W: 0.11±0.02; F2100W: 0.032±0.005 (× F300M)
- Young-center/CMZ selection threshold =
median F2100W > 10 MJy/sr (≈ ΣSFR > 0.03 M☉/yr/kpc²)
- Bulge/desert selection threshold =
log F2100W/F300M ≤ −0.3 (≈ sSFR ≲ 7×10⁻¹² /yr)
- Nebular masking thresholds =
F2100W > 3 MJy/sr (non-MUSE galaxies); broken-power-law break x_b fit per CMZ
assumptions (6)
- domain assumption F300M emission is a pure stellar template that can be scaled to predict and remove starlight in F770W, F1000W, F1130W, and F2100W
- domain assumption Draine et al. (2021) model SEDs (PAH emission + dust continuum, standard charge/size grids, SB3/mMMP/M31 radiation fields) are a valid grid for interpreting the observed filter ratios
- domain assumption F2100W/ΣMol tracks the radiation field intensity U (F2100W ∝ U × N(H) × D/G at U ≲ 10)
- domain assumption Median statistics over 0.″9 pixels suppress HII region contamination in normal disks
- domain assumption The empirical R*_PAH calibration and the 7.7/21-µm-based PAH fraction interpretation extrapolate to extreme environments
- standard math JWST photometric calibration uncertainty ~5% (7% on colors) and Rigby et al. (2023) error model
Cite this review
Pith. "Pith review of Mid-Infrared Colors Vary with Galactic Environment: Contrasting Star-Forming Disks, Young Centers, and Quiescent Star-Formation Deserts." pith.science (2026). https://pith.science/paper/UJHA27SY
@misc{pith2026260719512,
  author       = {Pith},
  title        = {Pith review of: Mid-Infrared Colors Vary with Galactic Environment: Contrasting Star-Forming Disks, Young Centers, and Quiescent Star-Formation Deserts},
  year         = {2026},
  howpublished = {\url{https://pith.science/paper/UJHA27SY}},
  note         = {Machine review of arXiv:2607.19512}
}
abstract
We present $50{-}100\,$pc-resolution JWST/MIRI and NIRCam measurements of mid-infrared (mid-IR) color variations in the diffuse interstellar medium (ISM) of 71 nearby star-forming galaxies from the PHANGS-JWST survey. Mid-IR emission traces the dust column density, intensity ($U$) and hardness of the interstellar radiation field, and the physical state (charge, size) and abundance of polycyclic aromatic hydrocarbons (PAHs). Mid-IR colors that trace PAH band-ratios remain fairly constant in the diffuse ISM of star-forming disks. However, they show stark variations in extreme environments: highly star-forming central molecular zones (CMZs) and star-formation deserts/quiescent bulges. In CMZs, PAH-to-continuum ($3.3/21$, $7.7/21$, and $11.3/21\,\mu$m) and the $10/21\,\mu$m continuum colors are $0.2{-}0.4$ dex lower than in normal disks. We attribute this to higher $U$ based on the far-IR dust colors and the high $21\,\mu{\rm m}/\Sigma_{\rm Mol}$, which we suggest to be a good tracer of $U$ outside star-forming regions. Meanwhile, star-formation deserts show low $7.7\,\mu$m PAH emission, resulting in low $7.7/21\,\mu$m and $7.7/11.3\,\mu$m, while all other mid-IR colors remain typical. This suggests the presence of more neutral PAHs in star-formation deserts, where low $7.7\,\mu$m likely reflects ISM conditions similar to early-type and elliptical galaxies. All environments form part of a continuous trend in $7.7/11.3\,\mu$m vs.\ specific star-formation rate.
Figures


Figures from the paper (13 more)







Forward citations
Cited by 1 Pith paper
-
Variations in the 3.3 ${\mu}$m Polycyclic Aromatic Hydrocarbon Feature Across Nearby Galaxies Driven by Metallicity and Radiation Field Spectrum
The 3.3 um PAH feature grows relative to 7.7 and 11.3 um features at low metallicity, with secondary radiation-field-driven variations, indicating smaller PAH populations in low-metallicity environments.
Reference graph
Works this paper leans on
-
[1]
Allamandola, L. J., Hudgins, D. M., & Sandford, S. A. 1999, ApJL, 511, L115, doi: 10.1086/311843
doi:10.1086/311843 1999
-
[2]
Allamandola, L. J., Tielens, A. G. G. M., & Barker, J. R. 1989, ApJS, 71, 733, doi: 10.1086/191396
doi:10.1086/191396 1989
-
[3]
Aniano, G., Draine, B. T., Hunt, L. K., et al. 2020, ApJ, 889, 150, doi: 10.3847/1538-4357/ab5fdb Astropy Collaboration, Robitaille, T. P., Tollerud, E. J., et al. 2013, A&A, 558, A33, doi: 10.1051/0004-6361/201322068 Astropy Collaboration, Price-Whelan, A. M., Sip˝ ocz, B. M., et al. 2018, AJ, 156, 123, doi: 10.3847/1538-3881/aabc4f
-
[4]
Bakes, E. L. O., & Tielens, A. G. G. M. 1994, ApJ, 427, 822, doi: 10.1086/174188
doi:10.1086/174188 1994
-
[5]
T., Chandar, R., Kreckel, K., et al
Barnes, A. T., Chandar, R., Kreckel, K., et al. 2026, A&A, 706, A95, doi: 10.1051/0004-6361/202555751
-
[6]
Baron, D., Sandstrom, K. M., Rosolowsky, E., et al. 2024, ApJ, 968, 24, doi: 10.3847/1538-4357/ad39e5
-
[7]
Baron, D., Sandstrom, K. M., Sutter, J., et al. 2025, ApJ, 978, 135, doi: 10.3847/1538-4357/ad972a
-
[8]
Belfiore, F., Leroy, A. K., Sun, J., et al. 2023a, A&A, 670, A67, doi: 10.1051/0004-6361/202244863
Show all 92 references
-
[9]
K., Williams, T
Belfiore, F., Leroy, A. K., Williams, T. G., et al. 2023b, A&A, 678, A129, doi: 10.1051/0004-6361/202347175
-
[10]
J., Draine, B
Bendo, G. J., Draine, B. T., Engelbracht, C. W., et al. 2008, MNRAS, 389, 629, doi: 10.1111/j.1365-2966.2008.13567.x
2008
-
[11]
2019, A&A, 622, A103, doi: 10.1051/0004-6361/201834156
Boquien, M., Burgarella, D., Roehlly, Y., et al. 2019, A&A, 622, A103, doi: 10.1051/0004-6361/201834156
2019 doi
-
[12]
M., Long Kelvin Lee, K., Bryan Changala, P., et al
Burkhardt, A. M., Long Kelvin Lee, K., Bryan Changala, P., et al. 2021, ApJL, 913, L18, doi: 10.3847/2041-8213/abfd3a
2021 doi
-
[13]
2025,, 1.19.1 Zenodo, doi: 10.5281/zenodo.6984365
Bushouse, H., Eisenhamer, J., Dencheva, N., et al. 2025,, 1.19.1 Zenodo, doi: 10.5281/zenodo.6984365
2025 doi
-
[14]
C., Adamo, A., et al
Calzetti, D., Kennicutt, R. C., Adamo, A., et al. 2025, ApJ, 991, 198, doi: 10.3847/1538-4357/adfbe0
2025 doi
-
[15]
A., Clayton, G
Cardelli, J. A., Clayton, G. C., & Mathis, J. S. 1989, ApJ, 345, 245, doi: 10.1086/167900
1989 doi
-
[16]
2023, ApJL, 944, L12, doi: 10.3847/2041-8213/acac94
Chastenet, J., Sutter, J., Sandstrom, K., et al. 2023, ApJL, 944, L12, doi: 10.3847/2041-8213/acac94
2023 doi
-
[17]
K., et al
Chastenet, J., Sandstrom, K., Leroy, A. K., et al. 2025, ApJS, 276, 2, doi: 10.3847/1538-4365/ad8a5c
2025 doi
-
[18]
K., Sandstrom, K., et al
Chown, R., Leroy, A. K., Sandstrom, K., et al. 2025a, ApJ, 983, 64, doi: 10.3847/1538-4357/adbd40
-
[19]
K., Bolatto, A
Chown, R., Leroy, A. K., Bolatto, A. D., et al. 2025b, ApJ, 987, 91, doi: 10.3847/1538-4357/add73a
-
[20]
2025c, A&A, 698, A86, doi: 10.1051/0004-6361/202452940
Chown, R., Okada, Y., Peeters, E., et al. 2025c, A&A, 698, A86, doi: 10.1051/0004-6361/202452940
-
[21]
A., Boquien, M., Turner, J
Dale, D. A., Boquien, M., Turner, J. A., et al. 2023, AJ, 165, 260, doi: 10.3847/1538-3881/accffe
2023 doi
-
[22]
A., Bendo, G
Dale, D. A., Bendo, G. J., Engelbracht, C. W., et al. 2005, ApJ, 633, 857, doi: 10.1086/491642
2005 doi
-
[23]
A., Cohen, S
Dale, D. A., Cohen, S. A., Johnson, L. C., et al. 2009, ApJ, 703, 517, doi: 10.1088/0004-637X/703/1/517
2009 doi
-
[24]
A., Graham, G
Dale, D. A., Graham, G. B., Barnes, A. T., et al. 2025, AJ, 169, 133, doi: 10.3847/1538-3881/ada89f
2025 doi
-
[25]
P., Smith, J
Donnelly, G. P., Smith, J. D. T., Draine, B. T., et al. 2024, ApJ, 965, 75, doi: 10.3847/1538-4357/ad2169
2024 doi
- [26]
- [27]
-
[28]
T., Li, A., Hensley, B
Draine, B. T., Li, A., Hensley, B. S., et al. 2021, ApJ, 917, 3, doi: 10.3847/1538-4357/abff51
2021 doi
-
[29]
T., Dale, D
Draine, B. T., Dale, D. A., Bendo, G., et al. 2007, ApJ, 663, 866, doi: 10.1086/518306
2007 doi
-
[30]
T., Aniano, G., Krause, O., et al
Draine, B. T., Aniano, G., Krause, O., et al. 2014, ApJ, 780, 172, doi: 10.1088/0004-637X/780/2/172
2014 doi
-
[31]
V., Leroy, A
Egorov, O. V., Leroy, A. K., Sandstrom, K., et al. 2025, arXiv e-prints, arXiv:2509.13845, doi: 10.48550/arXiv.2509.13845
2025 doi
-
[32]
2022, A&A, 659, A191, doi: 10.1051/0004-6361/202141727 Mid-IR Colors27
Emsellem, E., Schinnerer, E., Santoro, F., et al. 2022, A&A, 659, A191, doi: 10.1051/0004-6361/202141727 Mid-IR Colors27
2022 doi
-
[33]
W., Gordon, K
Engelbracht, C. W., Gordon, K. D., Rieke, G. H., et al. 2005, ApJL, 628, L29, doi: 10.1086/432613
2005 doi
-
[34]
Galliano, F., Galametz, M., & Jones, A. P. 2018, ARA&A, 56, 673, doi: 10.1146/annurev-astro-081817-051900
2018 doi
-
[35]
C., Tielens, A
Galliano, F., Madden, S. C., Tielens, A. G. G. M., Peeters, E., & Jones, A. P. 2008, ApJ, 679, 310, doi: 10.1086/587051
2008 doi
-
[36]
1998, ApJ, 498, 579, doi: 10.1086/305576
Genzel, R., Lutz, D., Sturm, E., et al. 1998, ApJ, 498, 579, doi: 10.1086/305576
1998 doi
-
[37]
R., Stuber, S
Gleis, D. R., Stuber, S. K., Schinnerer, E., et al. 2026, A&A, 707, A121, doi: 10.1051/0004-6361/202557430
2026 doi
-
[38]
D., Clayton, G
Gordon, K. D., Clayton, G. C., Decleir, M., et al. 2023, ApJ, 950, 86, doi: 10.3847/1538-4357/accb59
2023 doi
-
[39]
D., Bohlin, R., Sloan, G
Gordon, K. D., Bohlin, R., Sloan, G. C., et al. 2022, AJ, 163, 267, doi: 10.3847/1538-3881/ac66dc
2022 doi
-
[40]
2025, arXiv e-prints, arXiv:2511.06481, doi: 10.48550/arXiv.2511.06481
Gregg, B., Calzetti, D., Adamo, A., et al. 2025, arXiv e-prints, arXiv:2511.06481, doi: 10.48550/arXiv.2511.06481
2025 doi
-
[41]
2012, MNRAS, 426, 892, doi: 10.1111/j.1365-2966.2012.21696.x
Groves, B., Krause, O., Sandstrom, K., et al. 2012, MNRAS, 426, 892, doi: 10.1111/j.1365-2966.2012.21696.x
2012
-
[42]
2023, MNRAS, 520, 4902, doi: 10.1093/mnras/stad114
Groves, B., Kreckel, K., Santoro, F., et al. 2023, MNRAS, 520, 4902, doi: 10.1093/mnras/stad114
2023 doi
-
[43]
2004, ApJS, 154, 253, doi: 10.1086/422640
Helou, G., Roussel, H., Appleton, P., et al. 2004, ApJS, 154, 253, doi: 10.1086/422640
2004 doi
-
[44]
K., Thuan, T
Hunt, L. K., Thuan, T. X., Izotov, Y. I., & Sauvage, M. 2010, ApJ, 712, 164, doi: 10.1088/0004-637X/712/1/164
2010 doi
-
[45]
Huchra, J. P. 2003, AJ, 125, 525, doi: 10.1086/345794
2003 doi
-
[46]
H., Masci, F., Tsai, C
Jarrett, T. H., Masci, F., Tsai, C. W., et al. 2013, AJ, 145, 6, doi: 10.1088/0004-6256/145/1/6
2013 doi
-
[47]
J., H¨ onig, S
Jensen, J. J., H¨ onig, S. F., Rakshit, S., et al. 2017, MNRAS, 470, 3071, doi: 10.1093/mnras/stx1447
2017 doi
-
[48]
2005, ApJL, 632, L83, doi: 10.1086/497913
Kaneda, H., Onaka, T., & Sakon, I. 2005, ApJL, 632, L83, doi: 10.1086/497913
2005 doi
-
[49]
C., & Evans, N
Kennicutt, R. C., & Evans, N. J. 2012, ARA&A, 50, 531, doi: 10.1146/annurev-astro-081811-125610
2012 doi
-
[50]
1986, Highlights of Astronomy, 7, 833
Turnshek, D. 1986, Highlights of Astronomy, 7, 833
1986
-
[51]
C., Sandstrom, K
Lee, J. C., Sandstrom, K. M., Leroy, A. K., et al. 2023, ApJL, 944, L17, doi: 10.3847/2041-8213/acaaae
2023 doi
-
[52]
Leger, A., & Puget, J. L. 1984, A&A, 137, L5
1984
-
[53]
K., Sandstrom, K
Leroy, A. K., Sandstrom, K. M., Lang, D., et al. 2019, ApJS, 244, 24, doi: 10.3847/1538-4365/ab3925
2019 doi
-
[54]
K., Schinnerer, E., Hughes, A., et al
Leroy, A. K., Schinnerer, E., Hughes, A., et al. 2021, ApJS, 257, 43, doi: 10.3847/1538-4365/ac17f3
2021 doi
-
[55]
K., Sandstrom, K., Rosolowsky, E., et al
Leroy, A. K., Sandstrom, K., Rosolowsky, E., et al. 2023, ApJL, 944, L9, doi: 10.3847/2041-8213/acaf85
2023 doi
-
[56]
2020, Nature Astronomy, 4, 339, doi: 10.1038/s41550-020-1051-1
Li, A. 2020, Nature Astronomy, 4, 339, doi: 10.1038/s41550-020-1051-1
2020 doi
-
[57]
2020, MNRAS, 494, 642, doi: 10.1093/mnras/staa681
Maragkoudakis, A., Peeters, E., & Ricca, A. 2020, MNRAS, 494, 642, doi: 10.1093/mnras/staa681
2020 doi
- [58]
-
[59]
S., Mezger, P
Mathis, J. S., Mezger, P. G., & Panagia, N. 1983, A&A, 128, 212
1983
-
[60]
E., Schinnerer, E., van de Ven, G., et al
Meidt, S. E., Schinnerer, E., van de Ven, G., et al. 2014, ApJ, 788, 144, doi: 10.1088/0004-637X/788/2/144 Mu˜ noz-Mateos, J. C., Gil de Paz, A., Zamorano, J., et al. 2009, ApJ, 703, 1569, doi: 10.1088/0004-637X/703/2/1569 O’Halloran, B., Satyapal, S., & Dudik, R. P. 2006, ApJ...
2014 doi
-
[61]
2011, A&A, 528, A10, doi: 10.1051/0004-6361/201015908
Panuzzo, P., Rampazzo, R., Bressan, A., et al. 2011, A&A, 528, A10, doi: 10.1051/0004-6361/201015908
2011 doi
-
[62]
K., Thompson, T
Pathak, D., Leroy, A. K., Thompson, T. A., et al. 2024, AJ, 167, 39, doi: 10.3847/1538-3881/ad110d
2024 doi
-
[63]
K., Barnes, A
Pathak, D., Leroy, A. K., Barnes, A. T., et al. 2025, ApJL, 993, L20, doi: 10.3847/2041-8213/ae0e70
2025 doi
-
[64]
2002, A&A, 390, 1089, doi: 10.1051/0004-6361:20020773
Peeters, E., Hony, S., Van Kerckhoven, C., et al. 2002, A&A, 390, 1089, doi: 10.1051/0004-6361:20020773
2002 doi
-
[65]
Peeters, E., Spoon, H. W. W., & Tielens, A. G. G. M. 2004, ApJ, 613, 986, doi: 10.1086/423237
2004 doi
-
[66]
K., et al
Pessa, I., Schinnerer, E., Leroy, A. K., et al. 2022, A&A, 663, A61, doi: 10.1051/0004-6361/202142832
2022 doi
-
[67]
2023, A&A, 673, A147, doi: 10.1051/0004-6361/202245673
Pessa, I., Schinnerer, E., Sanchez-Blazquez, P., et al. 2023, A&A, 673, A147, doi: 10.1051/0004-6361/202245673
2023 doi
-
[68]
E., Schinnerer, E., et al
Querejeta, M., Meidt, S. E., Schinnerer, E., et al. 2015, ApJS, 219, 5, doi: 10.1088/0067-0049/219/1/5
2015 doi
-
[69]
2021, A&A, 656, A133, doi: 10.1051/0004-6361/202140695
Querejeta, M., Schinnerer, E., Meidt, S., et al. 2021, A&A, 656, A133, doi: 10.1051/0004-6361/202140695
2021 doi
-
[70]
2013, MNRAS, 432, 374, doi: 10.1093/mnras/stt475
Rampazzo, R., Panuzzo, P., Vega, O., et al. 2013, MNRAS, 432, 374, doi: 10.1093/mnras/stt475
2013 doi
-
[71]
2014, A&A, 565, A50, doi: 10.1051/0004-6361/201423547
Rampazzo, R., Vega, O., Bressan, A., et al. 2014, A&A, 565, A50, doi: 10.1051/0004-6361/201423547
2014 doi
-
[72]
2023, PASP, 135, 048001, doi: 10.1088/1538-3873/acb293
Rigby, J., Perrin, M., McElwain, M., et al. 2023, PASP, 135, 048001, doi: 10.1088/1538-3873/acb293
2023 doi
-
[73]
Rigopoulou, D., Spoon, H. W. W., Genzel, R., et al. 1999, AJ, 118, 2625, doi: 10.1086/301146
1999 doi
-
[74]
2015, ApJS, 219, 4, doi: 10.1088/0067-0049/219/1/4
Salo, H., Laurikainen, E., Laine, J., et al. 2015, ApJS, 219, 4, doi: 10.1088/0067-0049/219/1/4
2015 doi
-
[75]
M., Bolatto, A
Sandstrom, K. M., Bolatto, A. D., Draine, B. T., Bot, C., & Stanimirovi´ c, S. 2010, ApJ, 715, 701, doi: 10.1088/0004-637X/715/2/701
2010 doi
-
[76]
M., Koch, E
Sandstrom, K. M., Koch, E. W., Leroy, A. K., et al. 2023, ApJL, 944, L8, doi: 10.3847/2041-8213/aca972
2023 doi
-
[77]
Schinnerer, E., & Leroy, A. K. 2024, ARA&A, 62, 369, doi: 10.1146/annurev-astro-071221-052651 28Pathak et al
2024 doi
-
[78]
F., Cutri, R
Skrutskie, M. F., Cutri, R. M., Stiening, R., et al. 2006, AJ, 131, 1163, doi: 10.1086/498708
2006 doi
-
[79]
Smith, J. D. T., Draine, B. T., Dale, D. A., et al. 2007, ApJ, 656, 770, doi: 10.1086/510549
2007 doi
-
[80]
A., et al
Stierwalt, S., Armus, L., Surace, J. A., et al. 2013, ApJS, 206, 1, doi: 10.1088/0067-0049/206/1/1
2013 doi
-
[81]
2025, ApJ, 994, 263, doi: 10.3847/1538-4357/ae10be
Sun, J., Teng, Y.-H., Chiang, I.-D., et al. 2025, ApJ, 994, 263, doi: 10.3847/1538-4357/ae10be
2025 doi
-
[82]
2024, ApJ, 971, 178, doi: 10.3847/1538-4357/ad54bd
Sutter, J., Sandstrom, K., Chastenet, J., et al. 2024, ApJ, 971, 178, doi: 10.3847/1538-4357/ad54bd
2024 doi
-
[83]
E., Sturm, E., Lehnert, M., et al
Tacconi-Garman, L. E., Sturm, E., Lehnert, M., et al. 2005, A&A, 432, 91, doi: 10.1051/0004-6361:20035738
2005 doi
-
[84]
Tielens, A. G. G. M. 2005, The Physics and Chemistry of the Interstellar Medium (Cambridge University Press)
2005
-
[85]
Tielens, A. G. G. M. 2008, ARAA, 46, 289, doi: 10.1146/annurev.astro.46.060407.145211 van Diedenhoven, B., Peeters, E., Van Kerckhoven, C., et al. 2004, ApJ, 611, 928, doi: 10.1086/422404 V´ eron-Cetty, M.-P., & V´ eron, P. 2010, A&A, 518, A10, doi: 10.1051/0004-6361/201014188
2008
-
[86]
M., Sandstrom, K., & Smith, J.-D
Whitcomb, C. M., Sandstrom, K., & Smith, J.-D. T. 2023, Research Notes of the American Astronomical Society, 7, 38, doi: 10.3847/2515-5172/acc073
2023 doi
-
[87]
M., Smith, J
Whitcomb, C. M., Smith, J. D. T., Sandstrom, K., et al. 2024, ApJ, 974, 20, doi: 10.3847/1538-4357/ad66c8
2024 doi
-
[88]
G., Lee, J
Williams, T. G., Lee, J. C., Larson, K. L., et al. 2024, ApJS, 273, 13, doi: 10.3847/1538-4365/ad4be5
2024 doi
-
[89]
G., Hollenbach, D., McKee, C
Wolfire, M. G., Hollenbach, D., McKee, C. F., Tielens, A. G. G. M., & Bakes, E. L. O. 1995, ApJ, 443, 152, doi: 10.1086/175510
1995 doi
-
[90]
G., McKee, C
Wolfire, M. G., McKee, C. F., Hollenbach, D., & Tielens, A. G. G. M. 2003, ApJ, 587, 278, doi: 10.1086/368016
2003 doi
-
[91]
N., Morgan, L., et al
Xue, C., Byrne, A. N., Morgan, L., et al. 2025, ApJS, 281, 9, doi: 10.3847/1538-4365/ae04e5
2025 doi
-
[92]
Zhang, L., & Ho, L. C. 2023, ApJ, 943, 60, doi: 10.3847/1538-4357/acab60
2023 doi
Reviewed August 1, 2026 · model on record in the stance chip above.
Discussion (0). Continue with ORCID to comment.