REVIEW 4 major objections 6 minor 73 references
A gated recurrent unit trained on simulated galaxy clusters can recover true total mass profiles from X-ray gas profiles alone, with ~5% scatter, and indicates hydrostatic masses of massive observed clusters are biased low by about 10%.
Reviewed by Pith at T0; open to challenge. T0 means a machine referee read the full paper against a public rubric. the ladder, T0–T4 →
2026-08-01 09:32 UTC pith:ZCU7UXP5
load-bearing objection Solid simulation-side study of GRU mass profiles; the X-COP hydrostatic-bias claim is suggestive but not yet validated. the 4 major comments →
Probing the baryonic--dark matter connection in galaxy clusters using X-rays with gated recurrent unit neural networks
The pith
A machine-rendered reading of the paper's core claim, the machinery that carries it, and where it could break.
Core claim
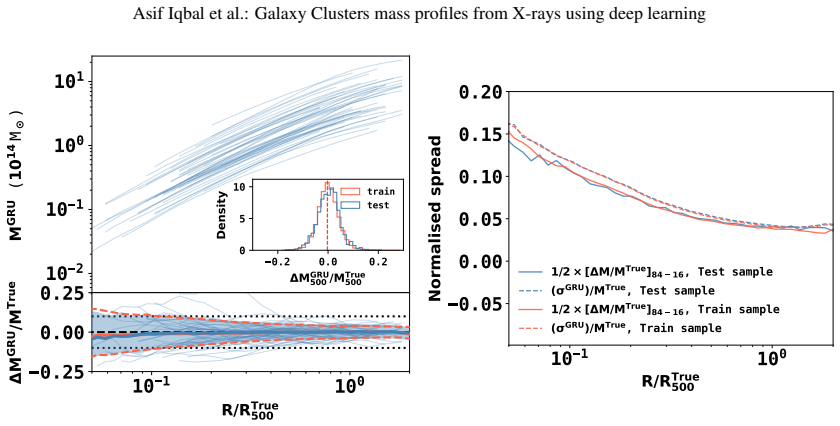
The central claim is that the three-dimensional total matter mass profile M(<R) of a cluster is learnable from its spherically averaged intracluster medium profiles (temperature, density, pressure, and enclosed gas mass) treated as a sequence. A two-layer bidirectional GRU, trained with Gaussian negative-log-likelihood and an ensemble of 50 initialisations, predicts log10 M(<R) at each radius with a median fractional dispersion of about 5% across most of the cluster region and no systematic bias, both for relaxed and disturbed clusters and for observation-like coarse radial binning. Enclosed gas mass is the dominant predictor, with pressure and temperature shaping the radial structure. When
What carries the argument
The key object is a gated recurrent unit (GRU) — a recurrent neural network that processes the radial ICM profiles as ordered sequences, with update and reset gates that let it retain dependencies across radii while accepting variable-length inputs. The network is conditioned on redshift and outputs mean and log-variance of a log-normal total-mass distribution at each radius; an ensemble of 50 models provides calibrated, radius-dependent uncertainties. The GRU is the mechanism that learns the nonlinear mapping from observable thermal profiles to the unobservable total mass profile, replacing the hydrostatic equilibrium equation.
Load-bearing premise
The network's training labels are simulation truth, so the entire method assumes the simulated relation between hot-gas profiles and total mass is the same as the real one; if real clusters' gas behaves differently from the simulations, both the predicted masses and the claimed hydrostatic bias reflect simulation bias, not reality.
What would settle it
Take the same REXCESS and X-COP clusters with measured weak-lensing mass profiles. If the lensing masses agree with the hydrostatic masses rather than the GRU predictions, or scatter symmetrically between the two, then the simulation-to-observation transfer assumed by the model fails and the claimed ~10% hydrostatic bias is a simulation artefact.
If this is right
- Cluster mass measurements no longer need to assume hydrostatic equilibrium; the network learns the mapping directly from simulated gas–mass relationships.
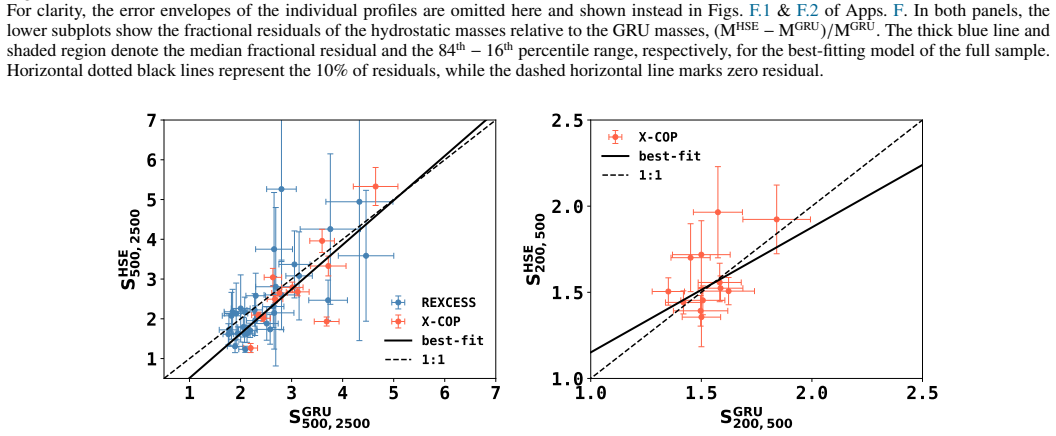
- The model's sparsity estimates (S200,500 and S500,2500) scatter at 0.025–0.060 dex versus 0.13–0.19 dex for hydrostatic masses, sharpening a cosmological probe.
- The observed X-COP offset suggests hydrostatic masses of massive clusters are systematically low by roughly 10%, which would propagate into X-ray mass–observable scaling relations.
- Because the method uses only spherically averaged gas profiles, it can be extended to Sunyaev–Zel'dovich and optical data, broadening the samples whose masses can be calibrated without HSE.
Where Pith is reading between the lines
- If the GRU predictions are unbiased on real clusters, the X-COP offset implies the missing hydrostatic support in massive clusters is comparable to the non-thermal pressure fractions predicted by simulations; a direct weak-lensing comparison on the same clusters could confirm or refute this.
- The model could be used as a diagnostic of baryonic physics: clusters whose learned mass profiles disagree strongly with hydrostatic estimates may be the ones with the most extreme feedback or dynamical disturbance, effectively separating equilibrium from non-equilibrium systems without a dynamical-state classifier.
- A strong test would be to train on a third simulation suite with substantially different feedback prescriptions and check whether the GRU-vs-HSE offset for X-COP is stable; if it varies with the training physics, the observed offset is simulation-driven rather than evidence about real clusters.
- Applying the same GRU to the CHEX-MATE sample, analysed uniformly, would test whether the mass-dependent offset persists when REXCESS and X-COP are re-reduced with identical procedures.
Editorial analysis
A structured set of objections, weighed in public.
Referee Report
Summary. The paper presents a GRU-based deep-learning framework that maps spherically averaged ICM radial profiles (temperature, gas density, pressure, enclosed gas mass, and radius) to total 3D cumulative mass profiles M(<R) of galaxy clusters. The model is trained on The Three Hundred Project simulations (GIZMO-SIMBA and GADGET-X) with a region-based train/test split, data augmentation to mimic observational binning, redshift conditioning, an uncertainty-aware NLL loss, and a 50-model ensemble. The authors report ~5% scatter over most of the cluster region, ~17% in the core, robustness to dynamical state and radial binning, and unbiased cross-simulation performance when trained jointly on the two simulation suites. SHAP analysis identifies enclosed gas mass as the dominant feature. The model is then applied to REXCESS and X-COP X-ray samples, finding HSE masses systematically lower than GRU predictions by about 10% for X-COP, while REXCESS shows near-zero average offset.
Significance. If the simulation-side results are taken at face value, this is a useful contribution: a data-driven mass-profile estimator with well-calibrated uncertainties, tested on held-out regions and across two independent hydrodynamical codes. The region-based split, the MC uncertainty treatment, the robustness tests for dynamical state and binning, and the explicit comparison with HSE masses are all strengths. The cross-simulation generalization test is particularly valuable. However, the observational claim of a ~10% HSE mass bias in X-COP is not secured by the evidence presented, and the paper itself concedes that a uniform reanalysis is needed. The central scientific advance is therefore the simulation methodology rather than the observational bias measurement. Reproducibility is limited because the model is only 'available upon request'.
major comments (4)
- [§5 (Fig. 11; Tables F.1/F.2)] The abstract's claim that HSE masses are systematically lower by ~10% for X-COP rests on an unvalidated simulation-to-observation transfer. Joint training on GIZMO-SIMBA and GADGET-X does not validate this transfer because the two suites share the same MDPL2 parent N-body simulation and initial conditions. Figure 6 shows that single-suite training already produces 5–10% cross-suite bias, the same magnitude as the claimed HSE offset. The GNN comparison in Fig. F.3 is not independent because that GNN was trained on GADGET-X. The Planck SZ masses tabulated in Tables F.1/F.2 are not used as a benchmark. The paper's own Sec. 6 states that REXCESS and X-COP were analyzed with different pipelines and that the result 'will therefore need to be checked against a sample with sufficient mass leverage, and which has been subjected to a uniform analysis procedure.' The observational offset should be
- [§4.6 (Fig. 10, Eq. 4)] The enclosed gas mass M_g(<R) is a cumulative integral, and the target M(<R) is also cumulative; the two-feature model (radius + M_g) nearly matches the five-feature model. Since the gas fraction varies slowly with radius and mass, M_g is essentially a rescaled proxy for total mass in the simulations. The SHAP dominance of M_g is therefore unsurprising and does not by itself reveal a physical baryon–dark matter connection. The sentence in §4.6 claiming that this 'reflects its fundamental role... rather than the presence of circular or redundant information' is asserted rather than demonstrated. This does not invalidate the supervised prediction, but the transfer of this feature to real clusters requires that the simulated gas-fraction–mass relation matches reality. Please quantify the sensitivity of the predicted M(<R) to assumed gas fraction and temper the physical interpretation.
- [§3.5 and §4.1] The hyperparameter optimization description says Optuna minimizes 'test loss'. If the same test split used for reporting headline errors is used for hyperparameter selection, the test-set residuals in Fig. 4 are not fully independent. Please clarify whether an inner validation split was used. Relatedly, §3.4 states that data augmentation is applied to both training and testing samples; if multiple augmented copies of the same cluster enter the test set, the effective number of independent test objects is reduced. The paper should report metrics on the unaugmented test sample as the primary evaluation or demonstrate that augmentation does not inflate apparent performance.
- [§5 and §6] The training data are 3D spherically averaged simulation profiles, while the observational REXCESS/X-COP profiles are deprojected under spherical symmetry assumptions from X-ray surface brightness and spectroscopy. No test is provided that these two representations are statistically equivalent. In addition, REXCESS and X-COP were reduced with different pipelines, so the mass-dependent offset seen in Fig. 11 could be an artifact of differing analysis procedures. The manuscript should either include a deprojection systematics test (e.g., forward-modeling simulated 3D profiles into observed-like 2D data and redeprojecting) or explicitly limit the abstract and conclusions to the simulation-validated part of the work.
minor comments (6)
- [Table F.1] RXC J1044.5-0704 appears twice with different redshifts and masses; this is likely a duplicate/typo and should be corrected.
- [§4.4] Typo: 'GADGET-X and and GIZMO-SIMBA' — duplicate 'and'.
- [Abstract vs. §6] The abstract says HSE masses are 'systematically lower' for X-COP, while §6 says 'exceed them by up to ∼10%'. Please harmonize the wording to avoid overstating the effect.
- [Appendix E captions] Captions for Figs. E.2 and E.3 state 'up to 0.75 R500', while §4.3 describes 14 bins up to R500 and 7 bins up to 0.75 R500. The captions are inconsistent with the text and with each other.
- [§3.3, §3.5] The notation for logarithms is confusing: the paper declares log = natural log, but Eq. (6) and the loss use log10 target values. Please define the base unambiguously at each use.
- [Data Availability] The model is 'available upon request'. For reproducibility in a machine-learning paper, please release code, trained weights, and configuration files under an open license, or provide a clear reason for withholding them.
Circularity Check
No significant circularity: held-out simulation test is a real prediction, and the observational HSE-bias claim is explicitly tentative.
full rationale
The central mass-profile result is a genuine supervised prediction. Section 3.4 splits the 324 zoom-in regions into 274 training and 50 test regions, with test regions reserved exclusively for final evaluation, and Section 4.1 compares predictions with ground-truth simulated mass profiles. The target M(<R) includes dark matter and is not computed from the input features, so the model must learn a physical ICM-to-mass mapping. The high SHAP importance of enclosed gas mass and the near-equivalent 2-feature model (Sec. 4.6, Fig. 10) reflect the slowly varying gas fraction; this is a learned scaling relation rather than a definitional identity, and the paper explicitly argues against 'circular or redundant information.' No fitted parameter is renamed as a prediction. The observational HSE-bias claim is presented with an explicit transfer caveat: Sec. 6 states the result 'will therefore need to be checked against a sample with sufficient mass leverage, and which has been subjected to a uniform analysis procedure,' so it is not put forward as a closed derivation. The GNN cross-check (Appendix F, Fig. F.3) is a self-citation from overlapping authors and is not an independent benchmark, but it is auxiliary rather than load-bearing for the paper's central claims; under the review criteria this is a minor non-circularity issue, hence score 1 rather than 0.
Axiom & Free-Parameter Ledger
free parameters (5)
- GRU network weights (W_u, W_r, W_h, biases, redshift projection, output head) =
not released
- GRU hyperparameters =
lr=7e-4, weight decay=1e-3, hidden dim=120, dropout=0.2, batch size=128, 2 bidirectional layers
- Pressure smoothing parameter f for HSE baseline =
0.10–0.20, changing from outer to inner regions
- Data augmentation ranges =
inner radius drawn from [0.05,0.3] R500, outer from [0.75,2] R500, 7–40 radial bins
- Ensemble combination weights =
inversely proportional to validation loss
axioms (6)
- domain assumption The Three Hundred GIZMO-SIMBA and GADGET-X simulations represent the real cluster ICM–total-mass relation closely enough for transfer to observations.
- domain assumption Deprojected observational X-ray profiles (REXCESS/X-COP) are comparable to the 3D spherically averaged simulated profiles used in training.
- domain assumption Cumulative enclosed gas mass M_g(<R) is a valid observable input and is not itself constructed from the total mass being predicted.
- ad hoc to paper A Gaussian NLL loss in log-mass space is an appropriate statistical model for mass-profile prediction.
- standard math The hydrostatic equilibrium equation is a legitimate baseline for comparison.
- standard math Planck 2016 flat ΛCDM cosmology.
Cite this review
Pith. "Pith review of Probing the baryonic--dark matter connection in galaxy clusters using X-rays with gated recurrent unit neural networks." pith.science (2026). https://pith.science/paper/ZCU7UXP5
@misc{pith2026260720721,
  author       = {Pith},
  title        = {Pith review of: Probing the baryonic--dark matter connection in galaxy clusters using X-rays with gated recurrent unit neural networks},
  year         = {2026},
  howpublished = {\url{https://pith.science/paper/ZCU7UXP5}},
  note         = {Machine review of arXiv:2607.20721}
}
read the original abstract
Accurate cluster mass measurements are crucial for cosmology, yet conventional hydrostatic equilibrium (HSE) methods can suffer from systematic biases, particularly in dynamically disturbed systems. We present a gated recurrent unit (GRU) based deep learning framework for predicting three-dimensional mass profiles of galaxy clusters from spherically averaged intra-cluster medium (ICM) radial profiles. By treating ICM profiles as sequential data, the GRU captures radial dependencies and naturally handles profiles with different radial samplings. We train and validate the model using high-resolution hydrodynamical simulations from The Three Hundred Project, achieving unbiased mass predictions with a typical 1$\sigma$ scatter of $\sim$5% over most of the cluster region, significantly improving upon HSE estimates. The model provides radius-dependent uncertainty estimates and remains robust against variations in data quality and cluster morphology. When trained jointly on independent simulation suites (GIZMO-SIMBA and GADGET-X), it successfully generalises across both simulations. Feature importance analysis shows that enclosed gas mass is the dominant predictor, with pressure and temperature providing additional information on the radial mass distribution. We further apply the GRU model to X-ray observations of the REXCESS and X-COP cluster samples from XMM-Newton and compare the inferred mass profiles with HSE estimates. The HSE masses are systematically lower than the GRU predictions for the higher-mass X-COP sample, while the REXCESS sample shows mass differences that are close to zero on average. This work provides a data-driven framework for cluster mass inference that bridges simulations and observations and can be extended to multi-wavelength datasets, including Sunyaev-Zel'dovich and optical observations.
Figures




Reference graph
Works this paper leans on
-
[1]
2019, in The 25th ACM SIGKDD International Conference on Knowledge Discovery & Data Mining, 2623--2631
Akiba, T., Sano, S., Yanase, T., Ohta, T., & Koyama, M. 2019, in The 25th ACM SIGKDD International Conference on Knowledge Discovery & Data Mining, 2623--2631
2019
-
[2]
W., Evrard , A
Allen , S. W., Evrard , A. E., & Mantz , A. B. 2011, , 49, 409
2011
-
[3]
2023, , 675, A188
Angelinelli , M., Ettori , S., Dolag , K., Vazza , F., & Ragagnin , A. 2023, , 675, A188
2023
-
[4]
2020, , 634, A113
Ansarifard , S., Rasia , E., Biffi , V., et al. 2020, , 634, A113
2020
-
[5]
W., Piffaretti , R., et al
Arnaud , M., Pratt , G. W., Piffaretti , R., et al. 2010, , 517, A92
2010
-
[6]
2025, , 703, L18
Aymerich , G., Douspis , M., Battaglia , N., et al. 2025, , 703, L18
2025
-
[7]
W., et al
Aymerich , G., Douspis , M., Pratt , G. W., et al. 2024, , 690, A238
2024
-
[8]
2014, , 437, 2328
Balm \`e s , I., Rasera , Y., Corasaniti , P.-S., & Alimi , J.-M. 2014, , 437, 2328
2014
-
[9]
W., D \'e mocl \`e s , J., & Lovisari , L
Bartalucci , I., Arnaud , M., Pratt , G. W., D \'e mocl \`e s , J., & Lovisari , L. 2019, , 628, A86
2019
-
[10]
M., Murante , G., Arth , A., et al
Beck , A. M., Murante , G., Arth , A., et al. 2016, , 455, 2110
2016
-
[11]
E., et al
Bocquet , S., Grandis , S., Bleem , L. E., et al. 2024, , 110, 083509
2024
-
[12]
W., et al
B \"o hringer , H., Schuecker , P., Pratt , G. W., et al. 2007, , 469, 363
2007
-
[13]
2024, , 533, 2656
Braspenning , J., Schaye , J., Schaller , M., et al. 2024, , 533, 2656
2024
-
[14]
M., Alatalo , K., et al
Cappellari , M., McDermid , R. M., Alatalo , K., et al. 2013, MNRAS, 432, 1862
2013
-
[15]
& Moss , A
Charnock , T. & Moss , A. 2017, , 837, L28
2017
-
[16]
Chen , C. M. H., Arnaud , M., Pointecouteau , E., Pratt , G. W., & Iqbal , A. 2024, , 688, A219
2024
-
[17]
2021, , 650, A104
CHEX-MATE Collaboration . 2021, , 650, A104
2021
-
[18]
2014, in Proceedings of the 2014 Conference on Empirical Methods in Natural Language Processing ( EMNLP ), ed
Cho, K., van Merri \"e nboer, B., Gulcehre, C., et al. 2014, in Proceedings of the 2014 Conference on Empirical Methods in Natural Language Processing ( EMNLP ), ed. A. Moschitti, B. Pang, & W. Daelemans (Doha, Qatar: Association for Computational Linguistics), 1724--1734
2014
-
[19]
2018, , 477, 139
Cialone , G., De Petris , M., Sembolini , F., et al. 2018, , 477, 139
2018
-
[20]
S., Ettori , S., Rasera , Y., et al
Corasaniti , P. S., Ettori , S., Rasera , Y., et al. 2018, , 862, 40
2018
-
[21]
S., Richardson , T
Corasaniti , P. S., Richardson , T. R. G., Ettori , S., et al. 2025, , 697, A33
2025
-
[22]
H., Pratt , G
Croston , J. H., Pratt , G. W., B \"o hringer , H., et al. 2008, , 487, 431
2008
-
[23]
2022, , 514, 977
Cui , W., Dave , R., Knebe , A., et al. 2022, , 514, 977
2022
-
[24]
2018, , 480, 2898
Cui , W., Knebe , A., Yepes , G., et al. 2018, , 480, 2898
2018
-
[25]
2017, Monthly Notices of the Royal Astronomical Society, 464, 2502
Cui , W., Power , C., Borgani , S., et al. 2017, Monthly Notices of the Royal Astronomical Society, 464, 2502
2017
-
[26]
2022, Nature Astronomy, 6, 1325
de Andres , D., Cui , W., Ruppin , F., et al. 2022, Nature Astronomy, 6, 1325
2022
-
[27]
2024, , 528, 1517
de Andres , D., Cui , W., Yepes , G., et al. 2024, , 528, 1517
2024
-
[28]
2021, , 504, 5383
De Luca , F., De Petris , M., Yepes , G., et al. 2021, , 504, 5383
2021
-
[29]
2024, , 687, A58
Dupourqu \'e , S., Clerc , N., Pointecouteau , E., et al. 2024, , 687, A58
2024
-
[30]
2017, Astronomische Nachrichten, 338, 293
Eckert , D., Ettori , S., Pointecouteau , E., et al. 2017, Astronomische Nachrichten, 338, 293
2017
-
[31]
Eckert , D., Ettori , S., Pointecouteau , E., van der Burg , R. F. J., & Loubser , S. I. 2022, , 662, A123
2022
-
[32]
2019, , 621, A40
Eckert , D., Ghirardini , V., Ettori , S., et al. 2019, , 621, A40
2019
-
[33]
2019, , 621, A39
Ettori , S., Ghirardini , V., Eckert , D., et al. 2019, , 621, A39
2019
-
[34]
2023, , 520, 4000
Ferragamo , A., de Andres , D., Sbriglio , A., et al. 2023, , 520, 4000
2023
-
[35]
2024, , 689, A298
Ghirardini , V., Bulbul , E., Artis , E., et al. 2024, , 689, A298
2024
-
[36]
2019, , 621, A41
Ghirardini , V., Eckert , D., Ettori , S., et al. 2019, , 621, A41
2019
-
[37]
M., & Trac , H
Ho , M., Farahi , A., Rau , M. M., & Trac , H. 2021, , 908, 204
2021
-
[38]
M., et al
Ho , M., Ntampaka , M., Rau , M. M., et al. 2022, Nature Astronomy, 6, 936
2022
-
[39]
M., Ntampaka , M., et al
Ho , M., Rau , M. M., Ntampaka , M., et al. 2019, , 887, 25
2019
-
[40]
& Schmidhuber, J
Hochreiter, S. & Schmidhuber, J. 1997, Neural Computation, 9, 1735
1997
-
[41]
2020, , 492, 3685
Huang , S., Leauthaud , A., Hearin , A., et al. 2020, , 492, 3685
2020
-
[42]
B., & Majumdar , S
Iqbal , A., Kale , R., Nath , B. B., & Majumdar , S. 2018, , 480, L68
2018
-
[43]
B., & Roychowdhury , S
Iqbal , A., Majumdar , S., Nath , B. B., & Roychowdhury , S. 2023 a , , 518, 2735
2023
-
[44]
2025, , 704, A334
Iqbal , A., Majumdar , S., Rasia , E., et al. 2025, , 704, A334
2025
-
[45]
W., Bobin , J., et al
Iqbal , A., Pratt , G. W., Bobin , J., et al. 2023 b , , 679, A51
2023
-
[46]
2007, , 659, 257
Kawahara , H., Suto , Y., Kitayama , T., et al. 2007, , 659, 257
2007
-
[47]
Kay , S. T. & Pratt , G. W. 2022, in Handbook of X-ray and Gamma-ray Astrophysics. Edited by Cosimo Bambi and Andrea Santangelo, 100
2022
-
[48]
2024, , 682, A132
Krippendorf , S., Baron Perez , N., Bulbul , E., et al. 2024, , 682, A132
2024
-
[49]
2024, , 687, A129
Lehle , K., Nelson , D., Pillepich , A., Truong , N., & Rohr , E. 2024, , 687, A129
2024
-
[50]
2023, , 523, 1228
Li , Q., Cui , W., Yang , X., et al. 2023, , 523, 1228
2023
-
[51]
& Maughan , B
Lovisari , L. & Maughan , B. J. 2022, in Handbook of X-ray and Gamma-ray Astrophysics, 65
2022
-
[52]
Lundberg, S. M. & Lee, S.-I. 2017, in Proceedings of the 31st International Conference on Neural Information Processing Systems, NIPS'17 (Red Hook, NY, USA: Curran Associates Inc.), 4768–4777
2017
-
[53]
& Mohr , J
Majumdar , S. & Mohr , J. J. 2004, , 613, 41
2004
-
[54]
W., Rapetti , D., & Ebeling , H
Mantz , A., Allen , S. W., Rapetti , D., & Ebeling , H. 2010, , 406, 1759
2010
-
[55]
F., Pratt , G
Mu \ n oz-Echeverr \' a , M., Mac \' as-P \'e rez , J. F., Pratt , G. W., et al. 2024, , 682, A147
2024
-
[56]
2024, , 686, A157
Nelson , D., Pillepich , A., Ayromlou , M., et al. 2024, , 686, A157
2024
-
[57]
J., et al
Ntampaka , M., Trac , H., Sutherland , D. J., et al. 2015, , 803, 50
2015
-
[58]
2019, , 876, 82
Ntampaka , M., ZuHone , J., Eisenstein , D., et al. 2019, , 876, 82
2019
-
[59]
2016, , 594, A13
Planck Collaboration XIII . 2016, , 594, A13
2016
-
[60]
W., Arnaud , M., Biviano , A., et al
Pratt , G. W., Arnaud , M., Biviano , A., et al. 2019, , 215, 25
2019
-
[61]
W., Arnaud , M., Piffaretti , R., et al
Pratt , G. W., Arnaud , M., Piffaretti , R., et al. 2010, , 511, A85
2010
-
[62]
W., Croston , J
Pratt , G. W., Croston , J. H., Arnaud , M., & B \"o hringer , H. 2009, , 498, 361
2009
-
[63]
D., Wojtak , R., Ansari , Z., Gall , C., & Hjorth , J
Ramanah , K. D., Wojtak , R., Ansari , Z., Gall , C., & Hjorth , J. 2020, , 499, 1985
2020
-
[64]
2015, , 813, L17
Rasia , E., Borgani , S., Murante , G., et al. 2015, , 813, L17
2015
-
[65]
2013, The Astronomical Review, 8, 40
Rasia , E., Meneghetti , M., & Ettori , S. 2013, The Astronomical Review, 8, 40
2013
-
[66]
2025, , 702, A182
Rasia , E., Tripodi , R., Borgani , S., et al. 2025, , 702, A182
2025
-
[67]
P., & McCarthy , I
Semboloni , E., Hoekstra , H., Schaye , J., van Daalen , M. P., & McCarthy , I. G. 2011, , 417, 2020
2011
-
[68]
M., Bellomi , E., Sayers , J., et al
Silich , E. M., Bellomi , E., Sayers , J., et al. 2024, in European Physical Journal Web of Conferences, Vol. 293, mm Universe 2023 - Observing the Universe at mm Wavelengths, 00050
2024
-
[69]
2024, , 682, A177
Sun , M., Li , J., Cao , S., & Liu , X. 2024, , 682, A177
2024
-
[70]
2026, arXiv e-prints, arXiv:2602.11989
Tam , S.-I., Umetsu , K., Amara , A., et al. 2026, arXiv e-prints, arXiv:2602.11989
arXiv 2026
-
[71]
2013, , 428, 2366
Vazza , F., Br \"u ggen , M., & Gheller , C. 2013, , 428, 2366
2013
-
[72]
A., Ebeling , H., et al
Vikhlinin , A., Burenin , R. A., Ebeling , H., et al. 2009, , 692, 1033
2009
-
[73]
2023, arXiv e-prints, arXiv:2304.11127
Watanabe , S. 2023, arXiv e-prints, arXiv:2304.11127
Pith/arXiv arXiv 2023
This paper was first reviewed by deepseek-v4-flash on August 1, 2026.
discussion (0)
Sign in with ORCID, Apple, or X to comment. Anyone can read and Pith papers without signing in.