REVIEW 3 major objections 6 minor 115 references
Two color-and-astrometry recipes pick out quasars with more than 96 percent purity.
Reviewed by Pith at T0; open to challenge. T0 means a machine referee read the full paper against a public rubric. the ladder, T0–T4 →
T0 review · deepseek-v4-flash
2026-08-01 09:24 UTC pith:UBUN2A37
load-bearing objection Solid, transparent survey validation with a genuinely useful southern quasar catalog; the purity claims are credible but the exact counts rest on an extrapolation that needs quantification. the 3 major comments →
An Exploratory Analysis of New Large Gaia-informed Quasar Samples in SDSS-V
The pith
A machine-rendered reading of the paper's core claim, the machinery that carries it, and where it could break.
Core claim
The central empirical claim is that the GUA and Skewt-QSO candidate selections, implemented in SDSS-V as non-core spectroscopic programs, achieve exceptionally high quasar purity: 96.2% for GUA and 97.4% for Skewt-QSO in a homogenized southern test area, with good-only lower limits of 82.0% and 88.9%. In doing so, they produced 151,972 newly spectroscopically confirmed quasars (76,840 of them selected only by these programs), more than half in the southern celestial hemisphere, with redshifts continuously spanning ~0.001 to ~5.3. The authors also show, through spectral decomposition, that the resulting quasars span Lbol ~1e44-1e48 erg/s, MBH ~1e6-1e10 Msun, and Eddington ratios ~0.01-1, and
What carries the argument
The load-bearing machinery is the pair of candidate-selection algorithms. GUA (Gaia-unWISE AGN) uses a random forest trained on previously confirmed quasars to score every Gaia-DR2/unWISE matched source, combining Gaia G/BP/RP photometry and proper motion with WISE W1-W2 mid-IR colors, and keeps sources with probability >0.8. Skewt-QSO uses parametric skew-t distributions in the multi-band color space of DES optical + near-IR + WISE data, requiring P_QSO > P_star and P_QSO > P_galaxy, and likewise rejects proper-motion stars. Both feed SDSS-V's fiber-fed spectroscopic survey, where overlapping target cartons and a visual-inspection subsample are used to measure purity. What the machinery doe
Load-bearing premise
The purity and new-quasar counts treat the BOSS pipeline's classifications as ground truth for the ~200,000 spectra that were never visually inspected; the checked 23,986 spectra may not represent the contamination rate in the rest, especially for BAL or reddened quasars with wrong redshifts.
What would settle it
Visually inspect a few thousand randomly chosen 'good' spectra that the authors did not examine; if the fraction of misclassified stars/galaxies exceeds the ~1.4% found in the inspected subsample — or if a substantial share of the uninspected 'bad' spectra are not quasars — the >96% purity and 151,972 new-quasar totals are overestimates. Alternatively, check whether quasar fraction varies by redshift or S/N among uninspected spectra; the claimed purity assumes it does not.
If this is right
- The southern-hemisphere quasar census expands dramatically: more than half of the newly confirmed quasars lie at δ<0, where only ~13% of previously known quasars resided.
- Quasar samples with >90% purity can be selected from public all-sky photometry and astrometry, so future surveys (optical or time-domain) can target quasars without a prior X-ray/radio catalog.
- The selection remains pure at low Galactic latitudes (≳80% down to |b|≲5° for GUA), opening the Galactic plane region to quasar demographics.
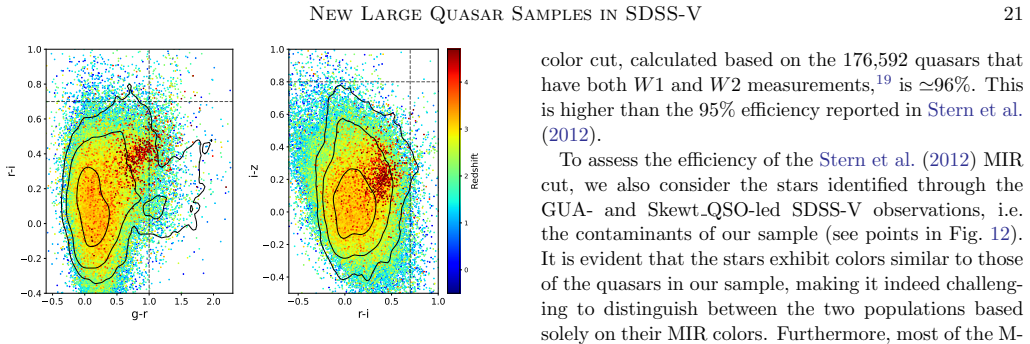
- Because the samples probe redder optical/IR colors than legacy SDSS color selection, they recover a substantial fraction (≈26%) of R−W1>4 mildly obscured quasars, while the redshift distribution shows no gap in the troublesome z≈2.1–2.8 range.
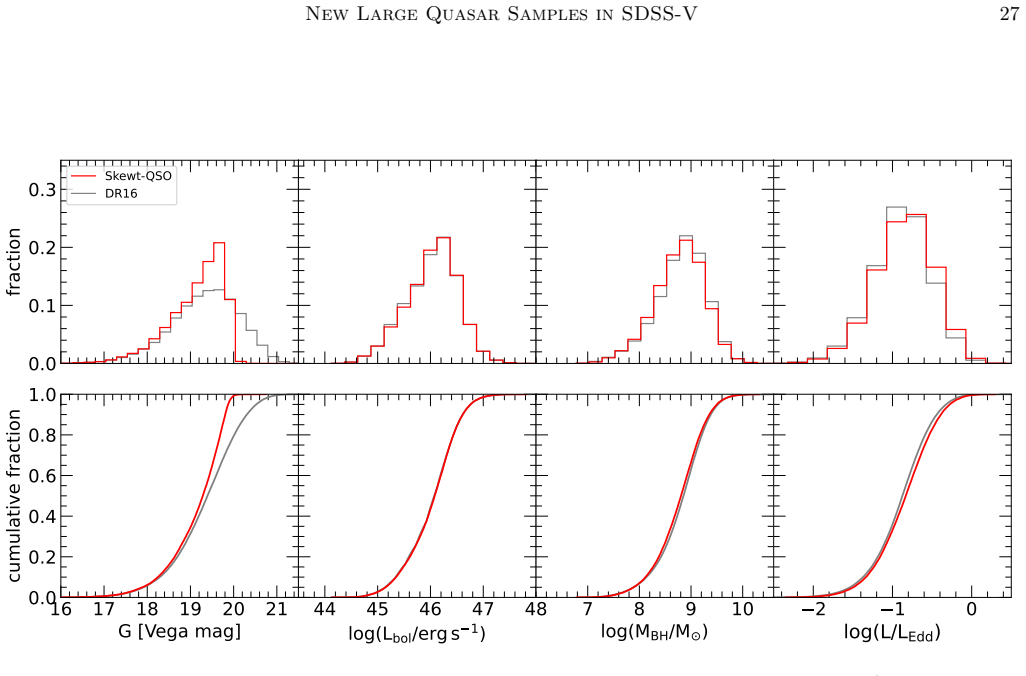
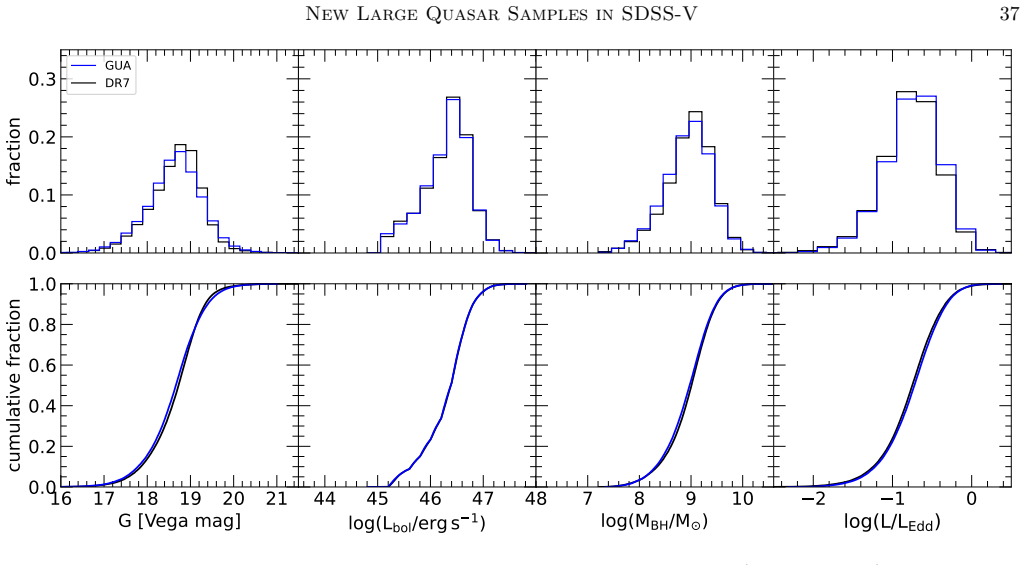
- The spectral-property distributions (Lbol, MBH, L/LEdd) of these quasars match previous SDSS catalogs once selection differences are accounted for, so the larger sky coverage does not introduce a new population of accreting black holes.
Where Pith is reading between the lines
- If purity holds at fainter magnitudes, extending these recipes with deeper optical surveys and the improved proper motions of later Gaia releases would yield a deeper all-sky quasar catalog; the paper's own magnitude trend suggests the faint end (G≳20) is where contamination begins.
- The paper demonstrates purity, not completeness: because both training sets were built from SDSS color-selected quasars, heavily reddened or broad-absorption-line quasars are likely underrepresented; a testable prediction is that a dedicated red/obscured quasar search would find a larger fraction among the W1−W2<0.8 tail of the sample.
- Cross-matching the new southern quasars with eROSITA X-ray data would quantify how many X-ray-faint or X-ray-undetected quasars these color methods recover, directly measuring the added value beyond X-ray preselection.
- The ~50,000 'bad' spectra retained as quasars add statistical weight but their redshifts are unreliable; redshift-corrected versions of these spectra could refine the high-z tail and the BAL population.
Editorial analysis
A structured set of objections, weighed in public.
Referee Report
Summary. The paper presents an exploratory analysis of two SDSS-V ancillary quasar programs, GUA and ASQOSS/Skewt-QSO, which use Gaia+WISE and DES-based photometric/astrometric selection rather than X-ray/radio preselection. The authors construct a sample of 259,700 spectroscopically classified quasars from SDSS-V/DR20, report 151,972 newly confirmed quasars, and measure homogenized selection purities of 96.2% (GUA) and 97.4% (Skewt-QSO), with conservative good-only lower limits of 82.0% and 88.9%. They also derive Lbol, MBH, and L/LEdd for ~208k objects using PyQSOFit and compare the resulting distributions with SDSS/DR7Q and DR16Q, concluding that the physical properties are broadly consistent once selection differences are accounted for.
Significance. If the purity and sample-size claims hold, the paper provides strong empirical evidence that inexpensive Gaia+WISE or DES-based selection can deliver large, high-purity quasar samples over wide sky areas, including the southern hemisphere and low Galactic latitudes. This is of high practical value for current and future wide-field surveys. The manuscript is transparent in its use of public DR20 data, explicitly reports conservative good-only purity lower limits, cross-matches against independent compilations (Milliquas/v8, DESI/DR1), and describes the training-set limitations of the parent selection methods. These are genuine strengths. The main risk is that the headline numbers rest on an unquantified extrapolation from a modest visual-inspection subset to the full sample, and on an area-specific homogenization procedure.
major comments (3)
- [Sec. 3.1, Fig. 9, Table 1] The headline purity and new-quasar numbers rest on an extrapolation that is not quantified. Visual inspection covered 23,986 pipeline-QSO spectra with ZWARNING=0 and S/N>2, but the 'good' sample contains 213,528 objects and the 'bad' sample adds 50,672 objects; the contamination rate measured in the inspected subset is applied to the uninspected majority. For the bad sample, the paper states only that ~83% of visually inspected bad pipeline-QSOs show broad lines, without giving the number inspected, the selection rule, or the fate of the remaining ~17%. Since bad spectra are included in the numerator of hp and in the 151,972 new-quasar count, a moderate overcount among bad spectra would directly inflate both headline numbers. The paper itself notes in Sec. 3.4 that non-extreme spectra were not visually inspected. Please report the inspection N and selection strategy, propagate the result
- [Appendix A, Eqs. (A1)-(A2); Sec. 4.2] The homogenized purity hp is calculated in a single high-Galactic-latitude southern test area (2h<RA<5h20m, -60<Dec<-20), using target-pool fractions fA...fD from that area, and then quoted as 96.2%/97.4% for GUA/Skewt-QSO. The all-sky claim relies on separate, non-homogenized GUA curves in Fig. 10 rather than on the headline hp. Because the weights in Eqs. (A1)-(A2) are area-specific, the quoted values are not all-sky purities. Please either restrict the abstract and conclusions to the test area or provide an error budget for the spatial extrapolation, e.g., by repeating the hp calculation in other regions where the targeting paths overlap.
- [Sec. 4.4, Figs. 18-19] The conclusion that the new samples are consistent with SDSS/DR16Q and DR7Q in Lbol, MBH, and L/LEdd is weaker than stated because the comparison uses the same PyQSOFit configuration, the same single-epoch scaling relations, and the same bolometric corrections used in the reference catalog (Secs. 3.2-3.3). The AD test formally rejects identity (P_AD << 10^-10); the visual agreement is partly inherited from the shared measurement recipe. Please state explicitly that the test only probes selection-induced differences conditional on identical measurement assumptions, or validate on a subset with an independent pipeline.
minor comments (6)
- [Sec. 3.1] The 'good' sample definition is given as ZWARNING=0, ZERR>0, relative redshift error <5%, z>0, but the visual-inspection subset described in the same section additionally requires S/N>2. Clarify whether S/N is part of the sample selection or only of the verification subset.
- [Table 1] The column headers N_tot, N_GUA, N_Skewt_QSO, etc. are difficult to parse, and the relationship between rows (e.g., 275,287 total observed vs. 259,700 quasars-only) is not immediately transparent. Expand the table note or use a cleaner layout so the numbers can be followed without the main text.
- [Figures 3 and 4] The bottom axis is labeled 'Rest Wavelength' in both figures, but the plotted x-axis is observed wavelength in each panel. Re-label to avoid confusion.
- [Sec. 4.3.1] The 'red quasar' sub-sample is defined with 'g−1>1' where presumably 'g−r>1' is intended; fix the typo.
- [Sec. 4.2] The text states hp = 96.1% for GUA in one sentence, while Fig. 9 and elsewhere quote 96.2%. Make the values consistent throughout.
- [Sec. 4.1 vs. Sec. 5] The main text reports 151,972 newly confirmed quasars, while the conclusions cite about 76,000 newly identified sources. The distinction between the total new-quasar count and the 'GUA+Skewt QSO sole-selected' subset should be stated clearly in both places to avoid apparent inconsistency.
Circularity Check
No significant circularity: purity and new-quasar counts are empirically measured against observed spectra and external catalogs; shared spectral-fitting calibration is transparent and not a fitted prediction.
full rationale
The paper's central claims—GUA/Skewt-QSO purity of 96.2%/97.4%, conservative good-only lower limits, and 151,972 newly confirmed quasars—are measured from BOSS spectra and cross-matched against the external Milliquas/v8+DESI/DR1 catalogs. The selection methods (Shu et al. 2019; Yang & Shen 2023) are prior, independent works; this paper tests their empirical yield in SDSS-V rather than deriving the yield from the selection criteria by construction. The homogenized purity calculation (Eqs. A1/A2) combines target fractions and observed quasar fractions in disjoint subsets; it is a measurement, not a self-referential definition. The physical-property comparison to DR16Q does adopt the same PyQSOFit configuration and the same bolometric corrections and virial calibrations as Wu & Shen (2022), which makes the Lbol/MBH/L_Edd consistency partly inherited from shared methodology. However, the paper presents this as a transparent comparison using standard, code-reproduced calibrations, not as a first-principles prediction; the FWHM and luminosity measurements come from the new SDSS-V spectra, and no fitted parameter is renamed as a prediction. The extrapolation from visually inspected subsets to uninspected spectra is a statistical-robustness concern, not circularity. No equation reduces to its inputs and no load-bearing argument rests on an unverified self-citation, so the analysis finds no significant circularity.
Axiom & Free-Parameter Ledger
free parameters (4)
- Bolometric corrections fbol (L5100, L3000, L1350) =
9.26, 5.15, 3.81
- MBH single-epoch scaling coefficients (a,b) for Hbeta, MgII, CIV =
(0.91,0.50), (0.74,0.62), (0.66,0.53)
- Halpha MBH scaling with +0.125 dex rescaling =
6.43 + 0.55 log L + 2.06 log FWHM; +0.125 dex
- Broad-line FWHM cap =
15000 km/s
axioms (6)
- domain assumption BOSS pipeline template classifications and ZWARNING flags are a reliable proxy for spectral identity/redshift
- domain assumption PyQSOFit continuum+line decomposition is an adequate model for all quasars in the sample
- domain assumption Reverberation-mapping-based single-epoch mass prescriptions (Eq. 1-2) are valid
- domain assumption Mean SED bolometric corrections from Richards et al. (2006) are universal
- domain assumption Candidate-training sets of S19 and YS23 are representative of the all-sky quasar population
- domain assumption Milliquas/v8 union DESI/DR1 is a complete reference for previously-known quasars
Cite this review
Pith. "Pith review of An Exploratory Analysis of New Large Gaia-informed Quasar Samples in SDSS-V." pith.science (2026). https://pith.science/paper/UBUN2A37
@misc{pith2026260727329,
  author       = {Pith},
  title        = {Pith review of: An Exploratory Analysis of New Large Gaia-informed Quasar Samples in SDSS-V},
  year         = {2026},
  howpublished = {\url{https://pith.science/paper/UBUN2A37}},
  note         = {Machine review of arXiv:2607.27329}
}
read the original abstract
Quasars are luminous objects that provide insights into the physics and evolution of supermassive black holes (SMBHs) and their accretion flows, galaxy evolution, and even cosmology. In this study, we present an exploratory study based on the ongoing fifth generation of the Sloan Digital Sky Survey (SDSS-V) and its unique dual-hemisphere, wide-field, and multi-object spectroscopic capabilities, with the aim of creating a comprehensive, all-sky quasar sample. The targets were selected through two novel methods, GUA and Skewt-QSO, that rely primarily on data from WISE and Gaia, aiming to address gaps in previous large quasar samples. Our sample includes over 250,000 spectroscopically confirmed quasars reaching z~5, with tens of thousands of newly identified quasars in the southern hemisphere. The selection methods are highly pure, with well over 80% of the spectra collected being genuine quasars; the main contaminants are M-type stars. The detailed spectral decomposition procedure we employed shows that the quasars in the sample span a wide range of luminosities (Lbol~$10^{44}-10^{48} erg s^{-1}$), SMBH masses (MBH~$10^6-10^{10}$ Msun), and accretion rates (L/LEdd~0.01-1). The distributions of these properties are consistent with those of previous quasar catalogs, which are based on past generations of SDSS, once we account for potential selection biases related to the various survey depths. Our findings confirm that novel selection methods based on optical+IR colors and/or astrometry can yield a large, high-purity quasar sample over wide sky areas, including in cases where more nuanced multi-band photometry and/or multi-wavelength data in the X-ray or radio is not available. This SDSS-V sample, which will continue to grow, establishes a robust reference for future southern (time-domain) surveys, while enhancing and complementing our understanding of quasar demographics and SMBH evolution.
Figures







Reference graph
Works this paper leans on
-
[1]
Abazajian, K. N., Adelman-McCarthy, J. K., Ag¨ ueros, M. A., et al. 2009, ApJS, 182, 543, doi: 10.1088/0067-0049/182/2/543
-
[2]
Abbott, T. M. C., Abdalla, F. B., Allam, S., et al. 2018, ApJS, 239, 18, doi: 10.3847/1538-4365/aae9f0
-
[3]
Abbott, T. M. C., Adam´ ow, M., Aguena, M., et al. 2021, ApJS, 255, 20, doi: 10.3847/1538-4365/ac00b3
-
[4]
2020, ApJS, 249, 3, doi: 10.3847/1538-4365/ab929e
Ahumada, R., Allende Prieto, C., Almeida, A., et al. 2020, ApJS, 249, 3, doi: 10.3847/1538-4365/ab929e
-
[5]
Alexander, D. M., & Hickox, R. C. 2012, NewAR, 56, 93, doi: 10.1016/j.newar.2011.11.003
-
[6]
F., Argudo-Fern´ andez, M., et al
Almeida, A., Anderson, S. F., Argudo-Fern´ andez, M., et al. 2023, ApJS, 267, 44, doi: 10.3847/1538-4365/acda98
-
[7]
Ananna, T. T., Weigel, A. K., Trakhtenbrot, B., et al. 2022, ApJS, 261, 9, doi: 10.3847/1538-4365/ac5b64
-
[8]
J., Stern, D., Noirot, G., et al
Assef, R. J., Stern, D., Noirot, G., et al. 2018, ApJS, 234, 23, doi: 10.3847/1538-4365/aaa00a
-
[9]
Assef, R. J., Stern, D., Kochanek, C. S., et al. 2013, ApJ, 772, 26, doi: 10.1088/0004-637X/772/1/26
-
[10]
Assef, R. J., Eisenhardt, P. R. M., Stern, D., et al. 2015, ApJ, 804, 27, doi: 10.1088/0004-637X/804/1/27 Astropy Collaboration, Price-Whelan, A. M., Lim, P. L., et al. 2022, ApJ, 935, 167, doi: 10.3847/1538-4357/ac7c74
-
[11]
2025, A&A, 698, A132, doi: 10.1051/0004-6361/202554372
Aydar, C., Merloni, A., Dwelly, T., et al. 2025, A&A, 698, A132, doi: 10.1051/0004-6361/202554372
-
[12]
McMahon, R. G. 2015, MNRAS, 447, 3368, doi: 10.1093/mnras/stu2649
-
[14]
C., Batiste, M., Seals, J., et al
Bentz, M. C., Batiste, M., Seals, J., et al. 2016, ApJ, 831, 2, doi: 10.3847/0004-637X/831/1/2
-
[15]
2016, MNRAS, 463, 4041, doi: 10.1093/mnras/stw2207
Bertemes, C., Trakhtenbrot, B., Schawinski, K., Done, C., & Elvis, M. 2016, MNRAS, 463, 4041, doi: 10.1093/mnras/stw2207
-
[16]
Blanton, M. R., Carlberg, J. K., Dwelly, T., et al. 2026, AJ, 171, 37, doi: 10.3847/1538-3881/ae196d
-
[17]
Bolton, A. S., Schlegel, D. J., Aubourg, ´E., et al. 2012, AJ, 144, 144, doi: 10.1088/0004-6256/144/5/144
-
[18]
Bovy, J., Hennawi, J. F., Hogg, D. W., et al. 2011, ApJ, 729, 141, doi: 10.1088/0004-637X/729/2/141
-
[19]
Bowen, I. S., & Vaughan, Jr., A. H. 1973, ApOpt, 12, 1430, doi: 10.1364/AO.12.001430
-
[20]
Cardelli, J. A., Clayton, G. C., & Mathis, J. S. 1989, ApJ, 345, 245, doi: 10.1086/167900
doi:10.1086/167900 1989
-
[21]
2023, ApJ, 953, 142, doi: 10.3847/1538-4357/ace1e5
Cho, H., Woo, J.-H., Wang, S., et al. 2023, ApJ, 953, 142, doi: 10.3847/1538-4357/ace1e5
-
[22]
2001, MNRAS, 328, 1039, doi: 10.1046/j.1365-8711.2001.04902.x
Colless, M., Dalton, G., Maddox, S., et al. 2001, MNRAS, 328, 1039, doi: 10.1046/j.1365-8711.2001.04902.x
arXiv 2001
-
[23]
2020, The Open Journal of Astrophysics, 3, 13, doi: 10.21105/astro.2008.08404
Comparat, J., Eckert, D., Finoguenov, A., et al. 2020, The Open Journal of Astrophysics, 3, 13, doi: 10.21105/astro.2008.08404
Pith/arXiv arXiv 2020
-
[25]
Croom, S. M., Richards, G. T., Shanks, T., et al. 2009, MNRAS, 392, 19, doi: 10.1111/j.1365-2966.2008.14052.x
arXiv 2009
-
[26]
M., Wright, E
Cutri, R. M., Wright, E. L., Conrow, T., et al. 2013, Explanatory Supplement to the AllWISE Data Release
2013
-
[27]
Products, Explanatory Supplement to the AllWISE Data Release Products, by R. M. Cutri et al. Dalla Bont` a, E., Peterson, B. M., Grier, C. J., et al. 2025, A&A, 696, A48, doi: 10.1051/0004-6361/202452746 de Jong, R. S., Agertz, O., Berbel, A. A., et al. 2019, The Messenger, 175, 3, doi: 10.18727/0722-6691/5117
-
[28]
Denney, K. D. 2012, ApJ, 759, 44, doi: 10.1088/0004-637X/759/1/44 DESI Collaboration, Abdul Karim, M., Adame, A. G., et al. 2026, AJ, 171, 285, doi: 10.3847/1538-3881/ae4c43
-
[29]
Dey, A., Schlegel, D. J., Lang, D., et al. 2019, AJ, 157, 168, doi: 10.3847/1538-3881/ab089d
-
[30]
P., Bellstedt, S., Robotham, A
Driver, S. P., Bellstedt, S., Robotham, A. S. G., et al. 2022, MNRAS, 513, 439, doi: 10.1093/mnras/stac472
-
[31]
2020, A&A, 636, A73, doi: 10.1051/0004-6361/201936817
Duras, F., Bongiorno, A., Ricci, F., et al. 2020, A&A, 636, A73, doi: 10.1051/0004-6361/201936817
-
[32]
2017, MNRAS, 469, 1065, doi: 10.1093/mnras/stx864
Dwelly, T., Salvato, M., Merloni, A., et al. 2017, MNRAS, 469, 1065, doi: 10.1093/mnras/stx864
-
[33]
Dye, S., Lawrence, A., Read, M. A., et al. 2018, MNRAS, 473, 5113, doi: 10.1093/mnras/stx2622
-
[34]
2013, The Messenger, 154, 32
Edge, A., Sutherland, W., Kuijken, K., et al. 2013, The Messenger, 154, 32
2013
-
[35]
Eisenhardt, P. R. M., Wu, J., Tsai, C.-W., et al. 2012, ApJ, 755, 173, doi: 10.1088/0004-637X/755/2/173
-
[36]
Evans, I. N., Evans, J. D., Mart ´ ınez-Galarza, J. R., et al. 2024, ApJS, 274, 22, doi: 10.3847/1538-4365/ad6319
-
[37]
Fan, X., Ba˜ nados, E., & Simcoe, R. A. 2023, ARA&A, 61, 373, doi: 10.1146/annurev-astro-052920-102455
-
[38]
Fawcett, V. A., Alexander, D. M., Rosario, D. J., et al. 2020, MNRAS, 494, 4802, doi: 10.1093/mnras/staa954
-
[39]
Fawcett, V. A., Alexander, D. M., Brodzeller, A., et al. 2023, MNRAS, 525, 5575, doi: 10.1093/mnras/stad2603 New Large Quasar Samples in SDSS-V39
-
[40]
J., Olsen, K., Economou, F., et al
Fitzpatrick, M. J., Olsen, K., Economou, F., et al. 2014, in Society of Photo-Optical Instrumentation Engineers (SPIE) Conference Series, Vol. 9149, Observatory Operations: Strategies, Processes, and Systems V, ed. A. B. Peck, C. R. Benn, & R. L. Seaman, 91491T, doi: 10.1117/12.2057445
-
[41]
Flesch, E. W. 2019, arXiv e-prints, arXiv:1912.05614, doi: 10.48550/arXiv.1912.05614 —. 2023, The Open Journal of Astrophysics, 6, 49, doi: 10.21105/astro.2308.01505
work page internal anchor Pith review Pith/arXiv arXiv doi:10.48550/arxiv.1912.05614 2019
-
[42]
2021, ApJS, 254, 6, doi: 10.3847/1538-4365/abe85e Gaia Collaboration, Brown, A
Fu, Y., Wu, X.-B., Yang, Q., et al. 2021, ApJS, 254, 6, doi: 10.3847/1538-4365/abe85e Gaia Collaboration, Brown, A. G. A., Vallenari, A., et al. 2016, A&A, 595, A2, doi: 10.1051/0004-6361/201629512 Gaia Collaboration, Babusiaux, C., van Leeuwen, F., et al. 2018, A&A, 616, A10, doi: 10.1051/0004-6361/201832843 Gaia Collaboration, Bailer-Jones, C. A. L., Te...
-
[43]
Gibson, R. R., Jiang, L., Brandt, W. N., et al. 2009, ApJ, 692, 758, doi: 10.1088/0004-637X/692/1/758
-
[44]
2024, MNRAS, 528, 711, doi: 10.1093/mnras/stae042
Lacy, M. 2024, MNRAS, 528, 711, doi: 10.1093/mnras/stae042
-
[45]
2015, ApJ, 806, 218, doi: 10.1088/0004-637X/806/2/218
Glikman, E., Simmons, B., Mailly, M., et al. 2015, ApJ, 806, 218, doi: 10.1088/0004-637X/806/2/218
-
[46]
2012, ApJ, 757, 51, doi: 10.1088/0004-637X/757/1/51
Glikman, E., Urrutia, T., Lacy, M., et al. 2012, ApJ, 757, 51, doi: 10.1088/0004-637X/757/1/51
-
[47]
Greene, J. E., & Ho, L. C. 2005, ApJ, 630, 122, doi: 10.1086/431897
doi:10.1086/431897 2005
-
[48]
Gunn, J. E., Siegmund, W. A., Mannery, E. J., et al. 2006, AJ, 131, 2332, doi: 10.1086/500975
doi:10.1086/500975 2006
-
[49]
2018, PyQSOFit: Python code to fit the spectrum of quasars, Astrophysics Source Code Library, record ascl:1809.008
Guo, H., Shen, Y., & Wang, S. 2018, PyQSOFit: Python code to fit the spectrum of quasars, Astrophysics Source Code Library, record ascl:1809.008
2018
-
[50]
Gupta, K. K., Ricci, C., Temple, M. J., et al. 2024, A&A, 691, A203, doi: 10.1051/0004-6361/202450567
-
[51]
Hamann, F., Zakamska, N. L., Ross, N., et al. 2017, MNRAS, 464, 3431, doi: 10.1093/mnras/stw2387
-
[52]
2025, ApJS, 278, 6, doi: 10.3847/1538-4365/adba52
Huo, Z.-Y., Fu, Y., Huang, Y., et al. 2025, ApJS, 278, 6, doi: 10.3847/1538-4365/adba52
-
[53]
H., Saunders, W., Colless, M., et al
Jones, D. H., Saunders, W., Colless, M., et al. 2004, MNRAS, 355, 747, doi: 10.1111/j.1365-2966.2004.08353.x
arXiv 2004
-
[54]
Juneau, S., Canning, R., Alexander, D. M., et al. 2025, AJ, 169, 157, doi: 10.3847/1538-3881/adabc9
-
[55]
A., Rix, H.-W., Aerts, C., et al
Kollmeier, J. A., Rix, H.-W., Aerts, C., et al. 2026, AJ, 171, 52, doi: 10.3847/1538-3881/ae0576
-
[56]
Krawczyk, C. M., Richards, G. T., Mehta, S. S., et al. 2013, ApJS, 206, 4, doi: 10.1088/0067-0049/206/1/4
-
[57]
LaMassa, S., Peca, A., Urry, C. M., et al. 2024, ApJ, 974, 235, doi: 10.3847/1538-4357/ad6e7d
-
[58]
M., Civano, F., Brusa, M., et al
LaMassa, S. M., Civano, F., Brusa, M., et al. 2016, ApJ, 818, 88, doi: 10.3847/0004-637X/818/1/88
-
[59]
2014, AJ, 147, 108, doi: 10.1088/0004-6256/147/5/108
Lang, D. 2014, AJ, 147, 108, doi: 10.1088/0004-6256/147/5/108
-
[60]
Lawrence, A., Warren, S. J., Almaini, O., et al. 2007, MNRAS, 379, 1599, doi: 10.1111/j.1365-2966.2007.12040.x
arXiv 2007
-
[61]
2014, IEEE Transactions on Vehicular Communications, 20, 1983, doi: 10.1109/TVCG.2014.2346248
Pfister, H. 2014, IEEE Transactions on Vehicular Communications, 20, 1983, doi: 10.1109/TVCG.2014.2346248
arXiv 2014
-
[62]
2023, ApJ, 958, 162, doi: 10.3847/1538-4357/ace25b
Li, G., Tsai, C.-W., Stern, D., et al. 2023, ApJ, 958, 162, doi: 10.3847/1538-4357/ace25b
-
[63]
2025, ApJ, 981, 104, doi: 10.3847/1538-4357/adabe3
Li, G., Wu, J., Tsai, C.-W., et al. 2025, ApJ, 981, 104, doi: 10.3847/1538-4357/adabe3
-
[64]
2018, A&A, 616, A2, doi: 10.1051/0004-6361/201832727
Lindegren, L., Hern´ andez, J., Bombrun, A., et al. 2018, A&A, 616, A2, doi: 10.1051/0004-6361/201832727
-
[65]
Lyke, B. W., Higley, A. N., McLane, J. N., et al. 2020, ApJS, 250, 8, doi: 10.3847/1538-4365/aba623
-
[67]
G., Banerji, M., Gonzalez, E., et al
McMahon, R. G., Banerji, M., Gonzalez, E., et al. 2013, The Messenger, 154, 35
2013
-
[68]
Meisner, A. M., Lang, D., Schlafly, E. F., & Schlegel, D. J. 2019, PASP, 131, 124504, doi: 10.1088/1538-3873/ab3df4 Mej ´ ıa-Restrepo, J. E., Trakhtenbrot, B., Lira, P., Netzer, H., & Capellupo, D. M. 2016, MNRAS, 460, 187, doi: 10.1093/mnras/stw568 Mej ´ ıa-Restrepo, J. E., Trakhtenbrot, B., Koss, M. J., et al. 2022, ApJS, 261, 5, doi: 10.3847/1538-4365/ac6602
-
[69]
D., Palanque-Delabrouille, N., Prakash, A., et al
Myers, A. D., Palanque-Delabrouille, N., Prakash, A., et al. 2015, ApJS, 221, 27, doi: 10.1088/0067-0049/221/2/27
-
[70]
2024, ApJL, 960, L1, doi: 10.3847/2041-8213/ad0e76
Natarajan, P., Pacucci, F., Ricarte, A., et al. 2024, ApJL, 960, L1, doi: 10.3847/2041-8213/ad0e76
-
[71]
2019, MNRAS, 488, 5185, doi: 10.1093/mnras/stz2016
Netzer, H. 2019, MNRAS, 488, 5185, doi: 10.1093/mnras/stz2016
-
[72]
Nikutta, R., Fitzpatrick, M., Scott, A., & Weaver, B. A. 2020, Astronomy and Computing, 33, 100411, doi: 10.1016/j.ascom.2020.100411
arXiv 2020
-
[73]
Oke, J. B., & Gunn, J. E. 1983, ApJ, 266, 713, doi: 10.1086/160817
doi:10.1086/160817 1983
-
[74]
Padovani, P., Alexander, D. M., Assef, R. J., et al. 2017, A&A Rv, 25, 2, doi: 10.1007/s00159-017-0102-9 Pˆ aris, I., Petitjean, P., Aubourg,´E., et al. 2014, A&A, 563, A54, doi: 10.1051/0004-6361/201322691 40A viram et al. Pˆ aris, I., Petitjean, P., Ross, N. P., et al. 2017, A&A, 597, A79, doi: 10.1051/0004-6361/201527999 Pˆ aris, I., Petitjean, P., Aub...
-
[75]
Peterson, B. M. 2014, SSRv, 183, 253, doi: 10.1007/s11214-013-9987-4
-
[76]
W., Derwent, M
Pogge, R. W., Derwent, M. A., O’Brien, T. P., et al. 2020, in Society of Photo-Optical Instrumentation Engineers (SPIE) Conference Series, Vol. 11447, Ground-based and Airborne Instrumentation for Astronomy VIII, ed. C. J
2020
-
[77]
Evans, J. J. Bryant, & K. Motohara, 1144781, doi: 10.1117/12.2561113
-
[78]
2020, MNRAS, 492, 4058, doi: 10.1093/mnras/staa078
Pognan, Q., Trakhtenbrot, B., Sbarrato, T., Schawinski, K., & Bertemes, C. 2020, MNRAS, 492, 4058, doi: 10.1093/mnras/staa078
-
[79]
2021, A&A, 647, A1, doi: 10.1051/0004-6361/202039313
Predehl, P., Andritschke, R., Arefiev, V., et al. 2021, A&A, 647, A1, doi: 10.1051/0004-6361/202039313
-
[80]
2023, Nature Astronomy, 7, 1282, doi: 10.1038/s41550-023-02108-4
Ricci, C., & Trakhtenbrot, B. 2023, Nature Astronomy, 7, 1282, doi: 10.1038/s41550-023-02108-4
-
[81]
Ricci, C., Bauer, F. E., Treister, E., et al. 2017, MNRAS, 468, 1273, doi: 10.1093/mnras/stx173
-
[82]
Richards, G. T., Fan, X., Newberg, H. J., et al. 2002, AJ, 123, 2945, doi: 10.1086/340187
doi:10.1086/340187 2002
-
[83]
Richards, G. T., Hall, P. B., Vanden Berk, D. E., et al. 2003, AJ, 126, 1131, doi: 10.1086/377014
doi:10.1086/377014 2003
discussion (0)
Sign in with ORCID, Apple, or X to comment. Anyone can read and Pith papers without signing in.