REVIEW 3 major objections 5 minor 21 references
SuMAC: On-sky demonstration of multi-pixel on-chip millimeter-wave spectroscopy at the Large Millimeter Telescope
T0 review · 3 major / 5 minor · reviewed 2026-08-05 · deepseek-v4-flash
Pith's one-line read The paper reports the first on-sky deployment of a multi-pixel on-chip filterbank spectrometer on a large millimeter telescope. Three SuperSpec devices were integrated into the MUSCAT camera at the Large Millimeter Telescope, and during a s
desk verdict A credible, incremental on-sky demo of a three-pixel SuperSpec spectrometer at the LMT with a real CO detection, but the headline NET and line-flux numbers rest on an unquantified beam-dilution correction deferred to companion papers. read the letter →
The pith
A machine-rendered reading of the paper's core claim, the machinery that carries it, and where it could break.
The reading
What carries the argument
The central object is the SuperSpec on-chip filterbank spectrometer pixel: each pixel's broadband dual-slot antenna feeds a lithographed bank of half-wave microstrip resonators, one per spectral channel, and each resonator absorbs a narrow frequency slice and passes it to a titanium-nitride kinetic inductance detector whose resonant frequency shifts with absorbed power. This replaces the gratings and feedhorns of a conventional spectrometer with lithography, so the spectral resolution of about R≈200 is set by resonator quality factors. The argument depends on per-detector responsivity measured directly from hot/cold loads and on gains derived from Neptune point-source observations, which con
What would settle it
Measure SuMAC's NGC253 CO(2-1) line flux against published IRAM or JCMT single-dish values, or compare the 230 GHz Orion KL map with an independently calibrated spectral map. Agreement would validate the beam-dilution correction; a source-size-dependent offset would show it is biased.
Extended reading notes
Core claim
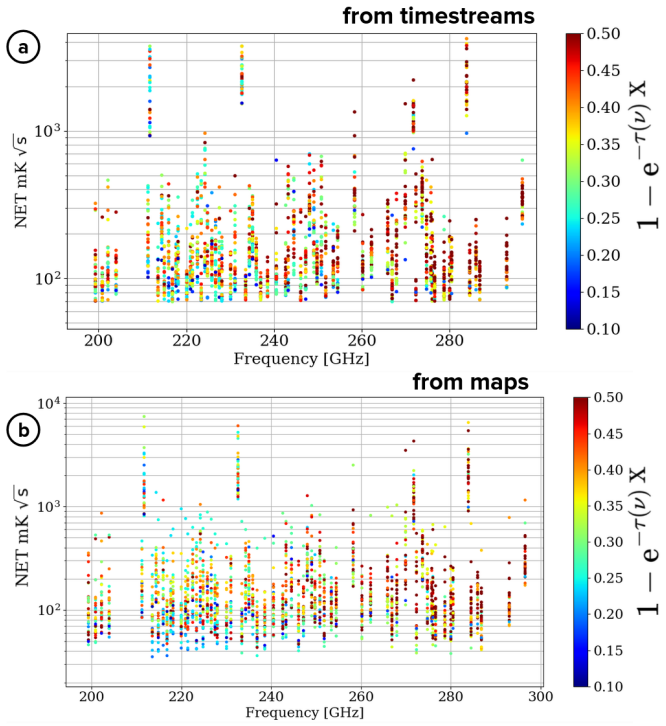
SuMAC demonstrates that SuperSpec's on-chip filterbank—where dispersion and detection are integrated on a single wafer—can be operated as a multi-pixel spectroscopic instrument at a 50-meter telescope. By mounting three pixels in the MUSCAT cryostat and adjusting the readout chain to cover SuperSpec's 80–450 MHz band, the collaboration obtained 77 usable spectral channels on the central pixel across 198–296 GHz. With those channels it detected the CO(J=2→1) emission line at 230.5 GHz in the starburst galaxy NGC253 and imaged the Orion Molecular Cloud's KL region at several frequencies, with the bright structures matching SCUBA-2 850 μm continuum maps. The median on-sky NET of roughly 106–115
Load-bearing premise
The per-detector gains come from Neptune point-source observations, and a footnote says a beam-dilution correction must be applied but never states how it is computed or validated; with beam widths varying from 5 to 10 arcseconds across channels and sources of different sizes, an error there would directly scale the reported NET and line intensities.
Editorial extensions
If this is right
- On-chip filterbank spectrometers can be installed in an existing continuum camera with only filter, aperture, amplifier, and readout changes, so future large-format spectroscopic focal planes could reuse current camera infrastructure.
- The consistency between timestream- and map-derived NETs (106 and 115 mK√s) indicates that the calibration pipeline yields stable per-detector sensitivity estimates.
- Detecting CO(2-1) in NGC253 and mapping Orion KL at several frequencies demonstrates moderate-resolution line spectroscopy and spectral mapping of both point-like and extended sources.
- The preliminary line-intensity-mapping scans open a path toward LIM experiments with on-chip spectrometers on large single-dish telescopes.
Reading between the lines
- If the roughly fifteen-fold aperture-to-sky sensitivity gap is dominated by unoptimized optics and mirror losses, redesigning the optical chain and adding a proper beam chopper could bring on-sky NET close to the cold-load value of ~10 mK/√Hz, making small on-chip arrays competitive for targeted line work.
- The NGC253 CO(2-1) line flux could be cross-checked against published IRAM or JCMT measurements; a source-size-dependent offset would isolate the beam-dilution correction as the main systematic in the calibration.
- A natural next test is a frequency-resolved map of a source with known line ratios, which would verify that per-channel relative calibration is stable across the full 190–300 GHz band rather than only at the brightest lines.
Signed reviews
Editorial analysis
A structured set of objections, weighed in public.
Referee Report
Summary. The paper reports the summer 2025 deployment and on-sky commissioning of three SuperSpec on-chip filterbank spectrometers installed in the MUSCAT camera at the Large Millimeter Telescope. It describes the cryogenic and readout modifications, hot/cold-load responsivity and noise characterization, beam measurements from point sources, an on-sky NET estimate of 106 mK√s from timestreams and 115 mK√s from maps, a claimed CO(2-1) detection in NGC253, and multi-frequency maps of Orion KL, concluding that SuMAC is a pathfinder for on-chip spectroscopy on large telescopes.
Significance. If the calibration chain holds, this is a significant instrument demonstration: it would be the first on-sky spectroscopy with multi-pixel on-chip filterbank spectrometers on a 50-m class telescope. The measurements are grounded in several independent external references — liquid-nitrogen/room-temperature loads, Neptune point-source observations, the known CO(2-1) rest frequency, and SCUBA-2 maps — and the paper does not fit constants to its own conclusions. The beam characterization and the noise versus optical-load trends are useful system-level data for future SuperSpec-class instruments. However, the quantitative claims are conditional on an unpublished companion-paper reduction and on an unquantified beam-dilution correction, so the significance is pathfinder-level rather than fully demonstrated.
major comments (3)
- [Sec. 4.2, Eq. (1) and footnote; Fig. 9] The on-sky NET and the calibrated line strengths depend on per-detector gains G_k derived from Neptune point-source observations. The only information given about the required correction is the footnote: "Since the gains are derived from point-source observations, a beam dilution correction must be applied." No formula, no per-channel beam solid angle, and no validation are provided. Fig. 9 shows beams with FWHMs varying from 5–10 arcsec across channels, while Neptune is point-like and NGC253/Orion are extended. An incorrect scalar dilution factor propagates directly into R_k = G_k^{-1} in Eq. (1) and into the map calibration, biasing both the reported NET values (106/115 mK√s) and the line intensities. The consistency between timestream and map NET cannot validate the absolute scale because both use the same G_k.
- [Sec. 4.2.1, Fig. 11] The central spectroscopic claim — the CO(J=2→1) detection in NGC253 — is presented without error bars, without a fitted line profile, and without a signal-to-noise ratio or line-integrated intensity. The text says the line is "highlighted" and "detected," but the figure alone does not quantitatively establish a detection. The authors should show the spectrum with 1σ per-channel uncertainties, report the fitted line amplitude, width, and significance, and state the expected line frequency/velocity used for the identification. Without these, the detection claim is not quantitatively supported.
- [§1, §4.2, §4.2.1; Refs. [6]–[9]] The reduction and calibration are deferred entirely to four unpublished companion papers by the same collaboration: Kane et al. (2026) for filterbank FTS characterization, Lapuente et al. (2026) for flux calibration and data reduction, Redford et al. (2026) for noise/common-mode analysis, and Savorgnano et al. (2026) for LIM scans. The manuscript is therefore not self-contained exactly at the points where the headline numbers are set: the Neptune gain calibration, the beam-dilution correction, the atmospheric opacity correction, and the map-making parameters. At minimum, the calibration chain and the map-making procedure must be summarized in sufficient detail to be checked, or the companion papers must be made available to the referee and the reader.
minor comments (5)
- [Sec. 3.1 vs Sec. 5] The hot load is given as 287 K in Eq. (3.1) and in Fig. 7, but Sec. 5 says "cold (77 K) and a hot (300 K) optical load." Please make the temperatures consistent.
- [Sec. 4.2] The conversion "10 mK/√Hz = 7.1 mK√s" is dimensionally incorrect: 10 mK/√Hz equals 10 mK√s. The factor 1/√2 would need an explicit bandwidth or one-sided/two-sided PSD convention. This should be corrected or explained.
- [Figs. 11 and 12] Add explicit units to the spectral axis and color scale, and state any smoothing, binning, or filtering applied to the spectra and maps. Without this, the reader cannot assess the effective spectral resolution or the significance of features.
- [References] Reference [8] (Redford et al.) is listed with the same title as reference [6] (Kane et al.), although the text describes [8] as the noise/common-mode analysis. Please correct the title and ensure each companion paper is uniquely identified.
- [Abstract and Sec. 3.2] The abstract lists "preliminary line intensity mapping scans" as a highlight, but the paper gives no LIM results or noise analysis beyond a forward reference to Savorgnano et al. (2026). Either add a brief quantitative result or remove this from the abstract.
Circularity Check
No constructional circularity: on-sky NET and line detections are calibrated against external standards (LN2, Neptune, known CO frequency, SCUBA-2 maps). The main caveats are an underspecified beam-dilution correction and heavy reliance on same-author companion papers for data reduction, which are completeness/self-containment concerns, not circularity.
full rationale
The paper's central claims are (1) detection of CO(2-1) at 230.5 GHz in NGC253, (2) multispectral maps of Orion KL, and (3) on-sky NET values of 106/115 mK√s. Walking the derivation chain: detector responsivity is measured directly from hot/cold loads in Sec. 3.1 (Eq. 1: R_k = (f_hot - f_cold)/(287-77)), independent of the science targets. On-sky NET is obtained by re-expressing responsivity as R_k = G_k^{-1}, with G_k estimated in Lapuente et al. (2026) from Neptune point-source observations (Sec. 4.2); Neptune is an external calibrator, not a quantity this paper predicts. The CO line is compared with the known 230.5 GHz frequency and prior IRAM/JCMT detections (Sec. 4.2.1); Orion maps are compared with SCUBA-2 850 um contours (Fig. 12). None of these checks defines the target result in terms of itself. The paper does rely heavily on same-author companion papers for the flux-calibration and reduction pipeline (Lapuente et al. 2026; Kane et al. 2026; Redford et al. 2026; Savorgnano et al. 2026), and Sec. 4.2's footnote admits 'a beam dilution correction must be applied' without specifying its formula or validation. Those are genuine exposition/verification gaps and self-citation dependencies, but they are not circular: the companion calibration uses an external planet, and the correction is an acknowledged step rather than a hidden re-injection of the claimed result. The consistency between timestream and map NET (106 vs 115 mK√s) is a cross-check using the same gain, so it does not independently validate the absolute scale, but that is a calibration-uncertainty issue, not constructional circularity. Score 2 reflects the same-collaboration citations that carry calibration details; no load-bearing result reduces by definition.
Assumptions & free parameters
assumptions (4)
- domain assumption Resonator frequency shift is a linear function of optical load temperature over the 77-287 K range used for responsivity calibration.
- domain assumption The telescope diffraction limit, assuming uniform illumination of a 50 m aperture, is a valid lower bound for comparing the measured beam widths.
- domain assumption Atmospheric extinction is described by 1 - exp(-tau_nu X) with opacity tau_nu from skydips, and this correction is accurate for the NET-load dependence.
- domain assumption The previously measured CO(2-1) rest frequency in NGC253 is 230.5 GHz (Harrison et al. 1999), used as the benchmark for the SuMAC line detection.
Cite this review
Pith. "Pith review of SuMAC: On-sky demonstration of multi-pixel on-chip millimeter-wave spectroscopy at the Large Millimeter Telescope." pith.science (2026). https://pith.science/paper/IBJF366Q
@misc{pith2026260803789,
  author       = {Pith},
  title        = {Pith review of: SuMAC: On-sky demonstration of multi-pixel on-chip millimeter-wave spectroscopy at the Large Millimeter Telescope},
  year         = {2026},
  howpublished = {\url{https://pith.science/paper/IBJF366Q}},
  note         = {Machine review of arXiv:2608.03789}
}
abstract
The SuperSpec-MUSCAT Collaboration (SuMAC) is an effort to operate SuperSpec spectrometers in the MUSCAT instrument at the Large Millimeter Telescope (LMT). SuperSpec is an on-chip filterbank spectrometer using kinetic inductance detectors (KIDs), with moderate $R\sim 200$ spectral resolution for observing in the 1 mm atmospheric window (190-300 GHz). While nominally a continuum camera operating a 1.1 mm, MUSCAT was also designed to operate as a testbed for pioneering detection technologies. In July 2025, three SuperSpec devices were installed and commissioned in the MUSCAT cryostat with minimal modifications to the system. This work presents an overview of SuperSpec's deployment and performance in MUSCAT along with the main results from the Summer 2025 observation campaign. Highlights include the detection of CO emission line in the galaxy NGC253, mapping the Orion KL region, and preliminary line intensity mapping scans.
Figures


Figures from the paper (9 more)




Reference graph
Works this paper leans on
-
[1]
Dusty infrared galaxies: Sources of the cosmic infrared back- ground,
Lagache, G., Puget, J.-L., and Dole, H., “Dusty infrared galaxies: Sources of the cosmic infrared back- ground,”Annual Review of Astronomy and Astrophysics43, 727–768 (Sept 2005)
work page 2005
-
[2]
Line-intensity mapping: 2017 status report,
Kovetz, E. D., Viero, M. P., Lidz, A., Newburgh, L., Rahman, M., Switzer, E., Kamionkowski, M., Aguirre, J., Alvarez, M., Bock, J., Bond, J. R., Bower, G., Bradford, C. M., Breysse, P. C., Bull, P., Chang, T.-C., Cheng, Y.-T., Chung, D., Cleary, K., Corray, A., Crites, A., Croft, R., Dor´ e, O., Eastwood, M., Ferrara, A., Fonseca, J., Jacobs, D., Keating,...
work page 2017
-
[3]
First light demonstration of the integrated superconducting spectrometer,
Endo, A., Karatsu, K., Tamura, Y., Oshima, T., Taniguchi, A., Takekoshi, T., Asayama, S., Bakx, T. J. L. C., Bosma, S., Bueno, J., Chin, K. W., Fujii, Y., Fujita, K., Huiting, R., Ikarashi, S., Ishida, T., Ishii, S., Kawabe, R., Klapwijk, T. M., Kohno, K., Kouchi, A., Llombart, N., Maekawa, J., Murugesan, V., Nakatsubo, S., Naruse, M., Ohtawara, K., Pascu...
work page 2019
-
[4]
Spt-slim: A line intensity mapping pathfinder for the south pole telescope,
Karkare, K. S., Anderson, A. J., Barry, P. S., Benson, B. A., Carlstrom, J. E., Cecil, T., Chang, C. L., Dobbs, M. A., Hollister, M., Keating, G. K., Marrone, D. P., McMahon, J., Montgomery, J., Pan, Z., Robson, G., Rouble, M., Shirokoff, E., and Smecher, G., “Spt-slim: A line intensity mapping pathfinder for the south pole telescope,”Journal of Low Tempe...
work page 2022
-
[5]
An on-sky atmospheric calibration of spt-slim,
Dibert, K. R., Adamic, M., Anderson, A. J., Barry, P. S., Benson, B. A., Benson, C. S., Brooks, E., Carlstrom, J. E., Cecil, T., Chang, C. L., Dobbs, M., Fichman, K., Karkare, K. S., Keating, G. K., Lapuente, A. M., Lisovenko, M., Marrone, D. P., Montgomery, J., Natoli, T., Pan, Z., Rahlin, A., Robson, G., Rouble, M., Smecher, G., Yefremenko, V., Young, M...
work page 2025
-
[6]
Characterization of filterbank performance for the SuMAC submillimeter spectrometer
Kane, E., Barry, P. S., Becerril-Tapia, M., Benson, C. S., Bradford, C. M., Brien, T. L. R., Doyle, S., G´ omez-Rivera, V., Hailey-Dunsheath, S., Hern´ andez-Aguilar, J., Hern´ andez-Rebollar, J. L., Hughes, D. H., Karkare, K. S., Lapuente, A. M., McGeehan, R., Naranjo-Romero, R., Papageorgiou, A., Redford, J. G., Rodr ´ ıguez-Montoya, I., Rowe, S., S´ an...
2026
-
[7]
Data reduction pipeline for the SuMAC millimeter-wave spectrometer at the LMT,
Lapuente, A., Barry, P. S., Becerril-Tapia, M., Benson, C. S., Bradford, C. M., Brien, T. L. R., Doyle, S., G´ omez-Rivera, V., Hailey-Dunsheath, S., Hern´ andez-Aguilar, J., Hern´ andez-Rebollar, J. L., Hughes, D. H., Kane, E., Karkare, K. S., McGeehan, R., Naranjo-Romero, R., Papageorgiou, A., Redford, J. G., Rodr ´ ıguez- Montoya, I., Rowe, S., S´ anch...
work page 2026
-
[8]
Characterization of filterbank performance for the SuMAC submillimeter spectrometer,
Redford, J. G., Barry, P. S., Becerril-Tapia, M., Benson, C. S., Bradford, C. M., Brien, T. L. R., Doyle, S., G´ omez-Rivera, V., Hailey-Dunsheath, S., Hern´ andez-Aguilar, J., Hern´ andez-Rebollar, J. L., Hughes, D. H., Kane, E., Karkare, K. S., Lapuente, A. M., McGeehan, R., Naranjo-Romero, R., Papageorgiou, A., Rodr ´ ıguez-Montoya, I., Rowe, S., S´ an...
2026
Show all 21 references
-
[9]
Noise characterization of line intensity mapping observations with SuMAC at the LMT,
Savorgnano, S., Barry, P. S., Becerril-Tapia, M., Benson, C. S., Bradford, C. M., Brien, T. L. R., Doyle, S., G´ omez-Rivera, V., Hailey-Dunsheath, S., Hern´ andez-Aguilar, J., Hern´ andez-Rebollar, J. L., Hughes, D. H., Kane, E., Karkare, K. S., Lapuente, A. M., McGeehan, R.,...
2026
-
[10]
Superspec: On-chip spectrometer design, characterization, and performance,
Redford, J., Barry, P. S., Bradford, C. M., Chapman, S., Glenn, J., Hailey-Dunsheath, S., Janssen, R. M. J., Karkare, K. S., Leduc, H. G., Mauskopf, P., McGeehan, R., Shirokoff, E., Wheeler, J., and Zmuidzinas, J., “Superspec: On-chip spectrometer design, characterization, and...
2022
-
[11]
Mexico-uk submillimeter camera for astronomy focal plane performance at the large millimeter telescope,
Tapia, M. B., Ade, P. A. R., Aguilar P´ erez, E., Barry, P. S., Brien, T. L. R., Castillo-Dom ´ ınguez, E., Dodd, C., Dunscombe, C., Eales, S., Ferrusca, D., G´ omez-Rivera, V., Hargrave, P., Luis, H.-R. J., Hornsby, A., House, J., Hughes, D., Luna, A., J´ auregui-Garc ´ ıa, J...
2022
-
[12]
Pre-deployment verification and predicted mapping speed of MUSCAT,
Brien, T. L. R., Ade, P. A. R., Barry, P. S., Castillo-Dom ´ ınguez, E., Ferrusca, D., G´ omez-Rivera, V., Hargrave, P., Hern´ andez Rebollar, J. L., Hornsby, A., Hughes, D. H., J´ auregui-Garcia, J. M., Mauskopf, P., Murias, D., Papageorgiou, A., Pascale, E., P´ erez, A., Row...
2020
-
[13]
Muscat focal plane verification,
Tapia, M., Ade, P. A. R., Barry, P. S., Brien, T. L. R., Castillo-Dom ´ ınguez, E., Ferrusca, D., G´ omez-Rivera, V., Hargrave, P., Rebollar, J. L. H., Hornsby, A., Hughes, D. H., J´ auregui-Garc ´ ıa, J. M., Mauskopf, P., Murias, D., Papageorgiou, A., Pascale, E., P´ erez, A....
2020
-
[14]
Becerril-Tapia, M.,MUSCAT - development of a large-format continuum camera to constrain stellar evolu- tion in the local and early Universe at millimetre wavelengths, PhD thesis, Instituto Nacional de Astrof ´ ısica, ´Optica y Electr´ onica (June 2024)
2024
-
[15]
The MUSCAT Readout Electronics Backend: Design and Pre-deployment Performance,
Rowe, S., Tapia, M., Barry, P. S., Karkare, K. S., Papageorgiou, A., Ade, P. A. R., Brien, T. L. R., Castillo-Dom ´ ınguez, E., Ferrusca, D., G´ omez-Rivera, V., Hargrave, P., Hern´ andez-Rebollar, J. L., Hornsby, A., J´ auregui-Garc ´ ıa, J. M., Mauskopf, P., Murias, D., Pasc...
2023
-
[16]
Temperature dependence of the frequency and noise of superconducting coplanar waveguide resonators,
Kumar, S., Gao, J., Zmuidzinas, J., Mazin, B. A., LeDuc, H. G., and Day, P. K., “Temperature dependence of the frequency and noise of superconducting coplanar waveguide resonators,”Applied Physics Letters92, 123503 (03 2008)
2008
-
[17]
Carbon monoxide in the starburst of NGC 253 revisited,
Harrison, A., Henkel, C., and Russell, A., “Carbon monoxide in the starburst of NGC 253 revisited,” MNRAS303, 157–172 (Feb. 1999)
1999
-
[18]
Orion kl: the hot core that is not a “hot core
Zapata, L. A., Schmid-Burgk, J., and Menten, K. M., “Orion kl: the hot core that is not a “hot core”,” Astronomy &; Astrophysics529, A24 (Mar. 2011)
2011
-
[19]
The James Clerk Maxwell Telescope Legacy Survey of Nearby Star-forming Regions in the Gould Belt,
Ward-Thompson, D., Di Francesco, J., Hatchell, J., Hogerheijde, M. R., Nutter, D., Bastien, P., Basu, S., Bonnell, I., Bowey, J., Brunt, C., Buckle, J., Butner, H., Cavanagh, B., Chrysostomou, A., Curtis, E., Davis, C. J., Dent, W. R. F., van Dishoeck, E., Edmunds, M. G., Fich...
2007
-
[20]
The JCMT Gould Belt Survey: SCUBA-2 Data Reduction Methods and Gaussian Source Recovery Analysis,
Kirk, H., Hatchell, J., Johnstone, D., Berry, D., Jenness, T., Buckle, J., Mairs, S., Rosolowsky, E., Francesco, J. D., and Sadavoy, S., “The JCMT Gould Belt Survey: SCUBA-2 Data Reduction Methods and Gaussian Source Recovery Analysis,”The Astrophysical Journal Supplement Seri...
2018
-
[21]
Full-Array Noise Performance of Deployment- Grade SuperSpec mm-Wave On-Chip Spectrometers,
Karkare, K. S., Barry, P. S., Bradford, C. M., Chapman, S., Doyle, S., Glenn, J., Gordon, S., Hailey- Dunsheath, S., Janssen, R. M. J., Kov´ acs, A., LeDuc, H. G., Mauskopf, P., McGeehan, R., Redford, J., Shirokoff, E., Tucker, C., Wheeler, J., and Zmuidzinas, J., “Full-Array ...
2020
Reviewed August 5, 2026 · model on record in the stance chip above.
Discussion (0). Continue with ORCID to comment.