Vector magnetometry using electromagnetically induced transparency with linperp lin polarization
Pith reviewed 2026-05-25 11:54 UTC · model grok-4.3
The pith
Relative strengths of σ and π EIT peaks determine the direction of a magnetic field.
A machine-rendered reading of the paper's core claim, the machinery that carries it, and where it could break.
Core claim
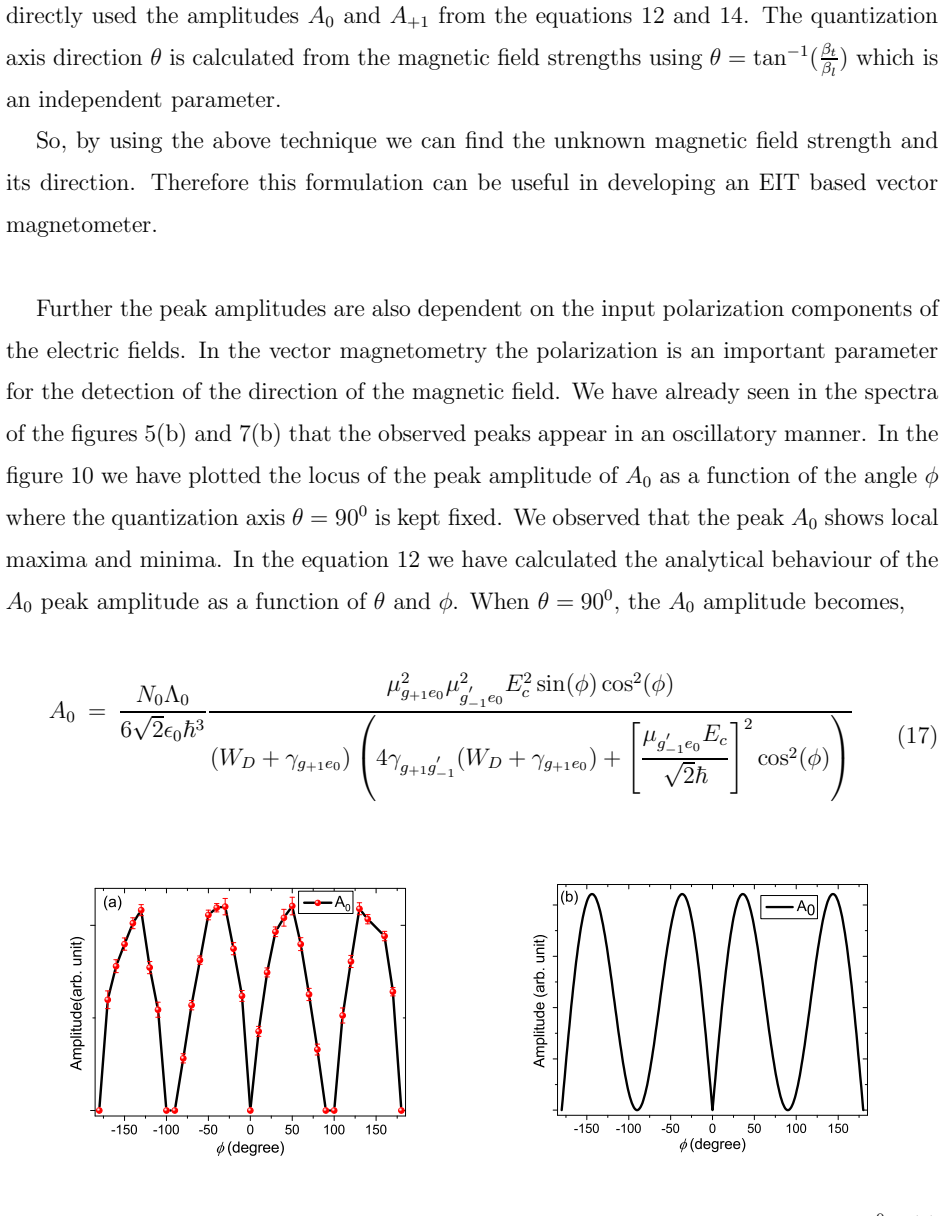
From the relative strengths of the σ and π EIT peaks, the direction of the magnetic field can be found. From the relative separation between the σ and π EIT peaks, the strength of the magnetic field can be calculated. The EIT peak amplitudes show oscillatory behaviour depending upon the orientation of the laser polarization relative to the magnetic field direction, and the positions of the maxima and minima can be used to calculate the direction of the magnetic field. These relations are confirmed by numerical simulation of the thirteen Zeeman sub-levels and by an analytical model that derives the explicit dependence on field direction and polarization.
What carries the argument
The σ and π EIT resonances arising from the thirteen Zeeman sublevels when the magnetic field quantization axis is oriented at an angle to the linear polarizations of the probe and pump beams.
If this is right
- Direction of the magnetic field follows directly from the ratio of σ to π EIT peak strengths.
- Strength of the magnetic field follows from the frequency separation between the σ and π peaks.
- Oscillatory dependence of peak amplitudes on polarization angle allows extraction of field direction from locations of maxima and minima.
- Both numerical and analytical models reproduce the observed angular dependencies.
Where Pith is reading between the lines
- The technique could be combined with existing scalar EIT magnetometers to provide full vector information in a single setup.
- Similar orientation-dependent EIT signatures may appear in other multi-level atomic systems and could be exploited for field sensing.
- Room-temperature operation removes the need for laser cooling, potentially simplifying practical device design.
Load-bearing premise
The ratios and separations of the EIT peaks are determined only by the angle between the magnetic field axis and the laser polarizations, without significant distortion from residual Doppler broadening, power broadening or stray fields.
What would settle it
Vary the applied magnetic field direction in small known steps while recording the EIT spectrum and check whether the extracted direction from peak ratios matches the applied direction to within the expected precision.
Figures
read the original abstract
Vector magnetometry was studied using the electromagnetically induced transparency (EIT) with linear $\perp$ linear ($lin \perp lin$) polarization of the probe and the pump beams in $^{87}Rb$ - $D_2$ transition. The dependence of the EIT on the direction of the quantization axis and the relative orientation of the polarization of the applied electric fields was studied experimentally. We have shown that from the relative strengths of the $\sigma$ and $\pi$ EIT peaks, the direction of the magnetic field can be found. Moreover from the relative separation between the $\sigma$ and $\pi$ EIT peaks, the strengths of the magnetic field can be calculated. We have also demonstrated that the EIT peak amplitudes show oscillatory behaviour depending upon the orientation of the laser polarization relative to the magnetic field direction. Using the positions of the maxima and minima, the direction of the magnetic field can be calculated. To understand the experimental observation, a theoretical study has been done numerically considering all the thirteen Zeeman sub-levels. Apart from the numerical model, a toy model has also been considered to obtain an analytical response of the medium considering the velocity distribution. The dependencies of the magnetic field direction and the polarization direction of the electric fields have been explicitly derived in the analytical model. Further the direction of the magnetic field is calculated using the analytical solution. This study can be helpful in order to make an EIT based atomic vector magnetometer at room temperature.
Editorial analysis
A structured set of objections, weighed in public.
Referee Report
Summary. The manuscript reports an experimental and theoretical investigation of vector magnetometry via EIT on the 87Rb D2 line using lin⊥lin probe-pump polarization. It claims that the magnetic-field direction is extractable from the relative amplitudes of the σ and π EIT peaks and from the locations of maxima/minima in the polarization-angle oscillation of those amplitudes, while the field magnitude follows from the σ–π peak separation. These relations are supported by room-temperature cell data, a 13-level numerical density-matrix calculation, and an analytical toy model that includes velocity averaging over the Zeeman sub-levels.
Significance. If the central mapping from observed EIT features to the B-vector holds without dominant contamination from unmodeled broadening mechanisms, the work supplies a compact, room-temperature atomic vector magnetometer together with explicit analytical expressions for the angular and polarization dependencies. The dual numerical-plus-analytic modeling approach, with velocity integration in the toy model, is a constructive element.
major comments (3)
- [Experimental dependence study and analytical toy model] The headline extraction of direction from σ/π amplitude ratios and of |B| from their separation (abstract and experimental dependence study) rests on the premise that these quantities are set solely by the angle between the quantization axis and the lin⊥lin polarizations. The 13-level numerical model and the velocity-averaged analytic toy model do not contain explicit checks (e.g., power or detuning scans) demonstrating that residual Doppler broadening, power broadening, or stray gradients remain sub-dominant; without such data the uniqueness of the mapping is not established.
- [Analytical toy model] The analytical derivation of peak-amplitude dependence on field direction and polarization angle (toy-model section) invokes first-principles transition rules followed by velocity averaging, yet the manuscript provides no quantitative comparison of the predicted contrast ratios against the measured spectra under controlled variation of laser intensity; this leaves open whether the reported oscillatory behavior is robust to the experimental conditions.
- [Numerical model] The numerical 13-level calculation is stated to reproduce the observed EIT spectra, but the manuscript does not report the precise values or fitting procedure for the Rabi frequencies, decay rates, or residual magnetic gradients used in the simulation; without these details it is unclear whether the agreement constitutes an independent validation or an under-constrained match.
minor comments (2)
- [Figures and experimental results] Error bars or standard deviations on the extracted peak ratios and separations are not shown in the experimental figures; their inclusion would allow readers to judge the precision of the direction and magnitude determinations.
- [Abstract] The abstract repeats the claim that direction can be obtained from polarization-angle maxima/minima without clarifying whether this method is independent of or redundant with the σ/π amplitude-ratio method.
Simulated Author's Rebuttal
We thank the referee for the careful and constructive review. We address each major comment below. Revisions will be made to incorporate additional experimental checks, quantitative comparisons, and model parameters to strengthen the manuscript.
read point-by-point responses
-
Referee: [Experimental dependence study and analytical toy model] The headline extraction of direction from σ/π amplitude ratios and of |B| from their separation (abstract and experimental dependence study) rests on the premise that these quantities are set solely by the angle between the quantization axis and the lin⊥lin polarizations. The 13-level numerical model and the velocity-averaged analytic toy model do not contain explicit checks (e.g., power or detuning scans) demonstrating that residual Doppler broadening, power broadening, or stray gradients remain sub-dominant; without such data the uniqueness of the mapping is not established.
Authors: We agree that explicit checks for the dominance of magnetic-field effects over broadening mechanisms would better establish uniqueness. The current manuscript relies on agreement between experiment and the velocity-inclusive models, but does not include dedicated power or detuning scans. In the revised version we will add experimental power and detuning dependence data together with corresponding model comparisons to confirm that the reported σ/π ratios and separations remain robust under the conditions used. revision: yes
-
Referee: [Analytical toy model] The analytical derivation of peak-amplitude dependence on field direction and polarization angle (toy-model section) invokes first-principles transition rules followed by velocity averaging, yet the manuscript provides no quantitative comparison of the predicted contrast ratios against the measured spectra under controlled variation of laser intensity; this leaves open whether the reported oscillatory behavior is robust to the experimental conditions.
Authors: We acknowledge that the manuscript lacks a direct quantitative comparison of analytical contrast ratios versus laser intensity. To address this we will include in the revised manuscript a comparison of the toy-model predictions for oscillatory amplitudes at several intensities against the corresponding experimental spectra, thereby demonstrating robustness of the reported behavior. revision: yes
-
Referee: [Numerical model] The numerical 13-level calculation is stated to reproduce the observed EIT spectra, but the manuscript does not report the precise values or fitting procedure for the Rabi frequencies, decay rates, or residual magnetic gradients used in the simulation; without these details it is unclear whether the agreement constitutes an independent validation or an under-constrained match.
Authors: We agree that the specific parameter values and fitting procedure are required for reproducibility and to clarify the nature of the agreement. In the revised manuscript we will report the exact Rabi frequencies, decay rates, and residual gradients employed in the 13-level density-matrix calculation, together with a description of how they were determined to match the data. revision: yes
Circularity Check
Derivation from first-principles transition rules and velocity averaging is self-contained
full rationale
The paper derives explicit dependencies of EIT peak amplitudes, separations, and oscillatory behavior on magnetic-field direction and polarization orientation via a numerical 13-level model and an analytical toy model that includes velocity averaging. These start from atomic transition rules and do not reduce to fitted parameters defined by the target result, self-citations, or renaming of known patterns. Experimental interpretation follows directly from the independent models without load-bearing circular steps.
Axiom & Free-Parameter Ledger
axioms (2)
- domain assumption All relevant Zeeman sub-levels of the 87Rb D2 manifold participate and can be treated with a density-matrix formalism without significant higher-order effects.
- domain assumption The velocity distribution of the atomic ensemble can be averaged analytically while preserving the polarization-dependent selection rules.
Lean theorems connected to this paper
-
IndisputableMonolith/Cost/FunctionalEquation.leanwashburn_uniqueness_aczel unclear?
unclearRelation between the paper passage and the cited Recognition theorem.
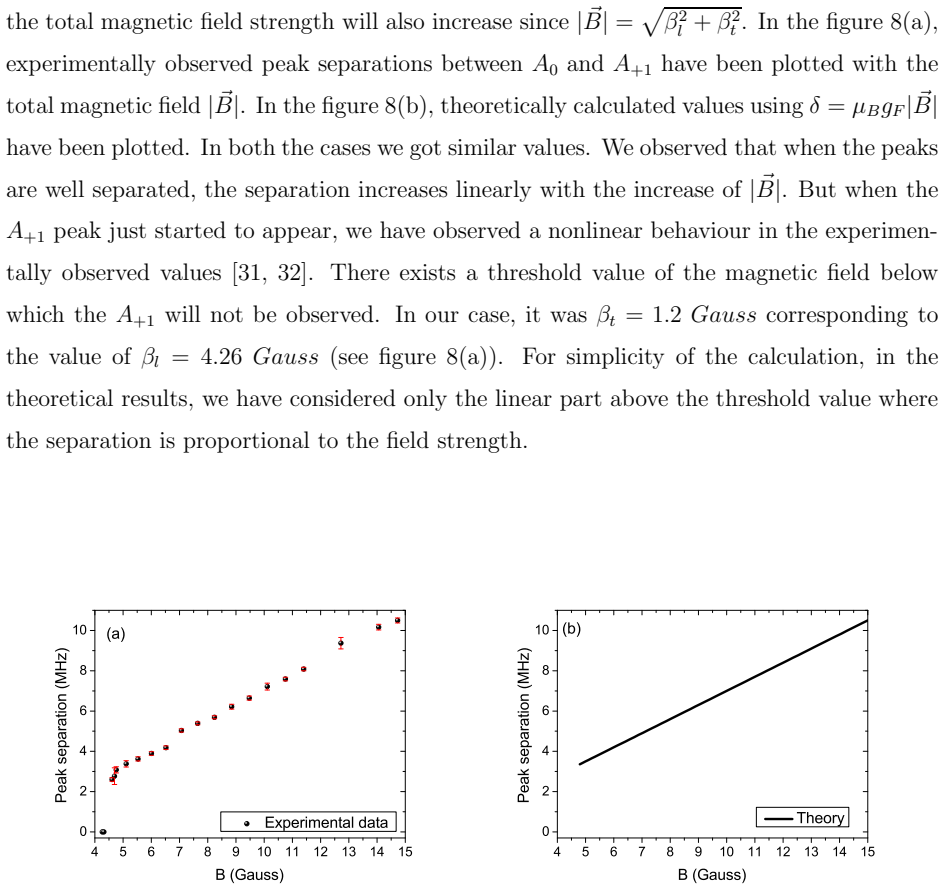
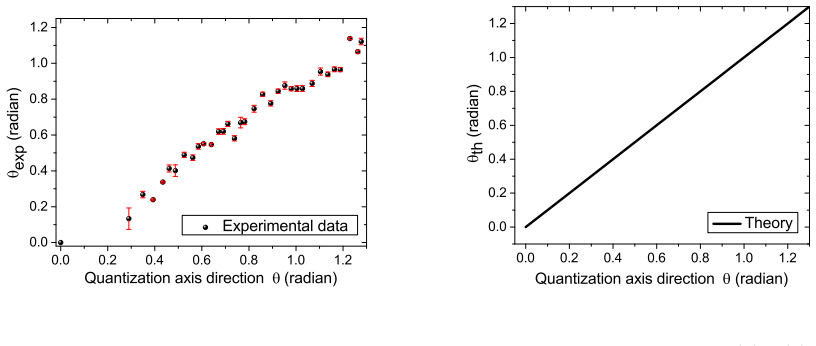
We have shown that from the relative strengths of the σ and π EIT peaks, the direction of the magnetic field can be found. Moreover from the relative separation between the σ and π EIT peaks, the strengths of the magnetic field can be calculated.
-
IndisputableMonolith/Foundation/AbsoluteFloorClosure.leanabsolute_floor_iff_bare_distinguishability unclear?
unclearRelation between the paper passage and the cited Recognition theorem.
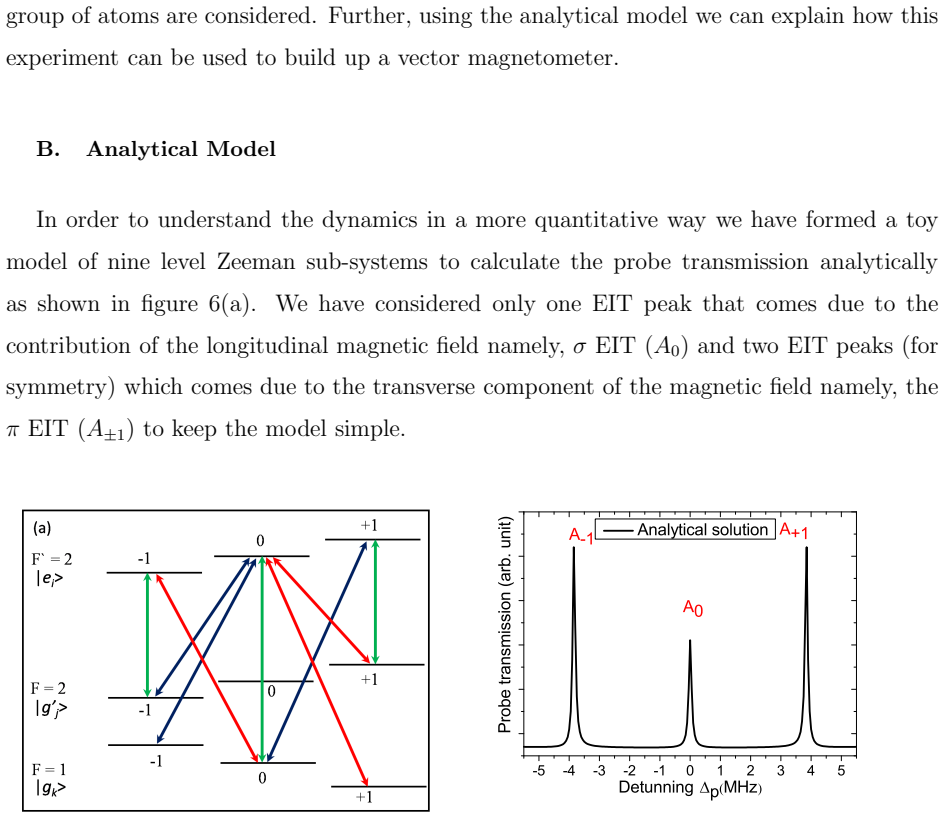
a toy model has also been considered to obtain an analytical response of the medium considering the velocity distribution
What do these tags mean?
- matches
- The paper's claim is directly supported by a theorem in the formal canon.
- supports
- The theorem supports part of the paper's argument, but the paper may add assumptions or extra steps.
- extends
- The paper goes beyond the formal theorem; the theorem is a base layer rather than the whole result.
- uses
- The paper appears to rely on the theorem as machinery.
- contradicts
- The paper's claim conflicts with a theorem or certificate in the canon.
- unclear
- Pith found a possible connection, but the passage is too broad, indirect, or ambiguous to say the theorem truly supports the claim.
Reference graph
Works this paper leans on
-
[1]
5 mW/cm 2 and the probe intensity at 0
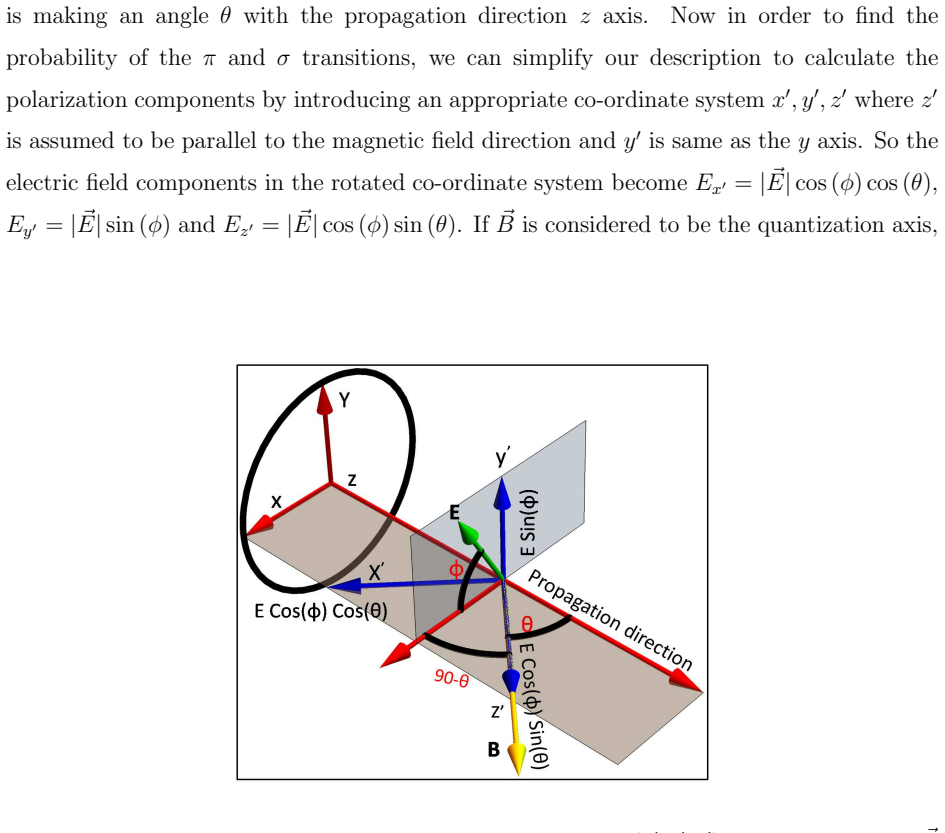
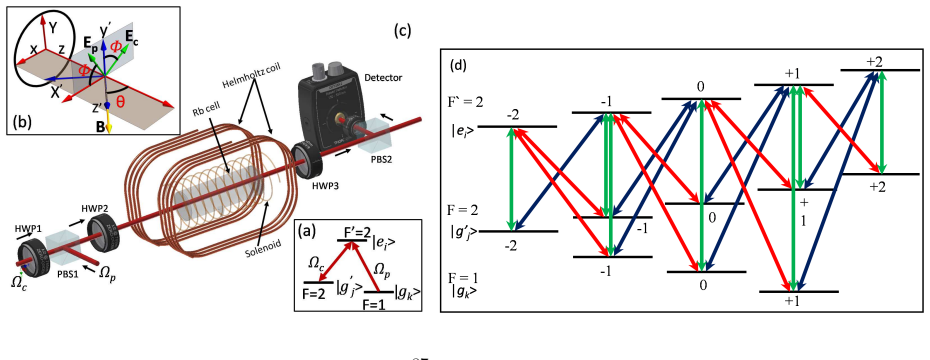
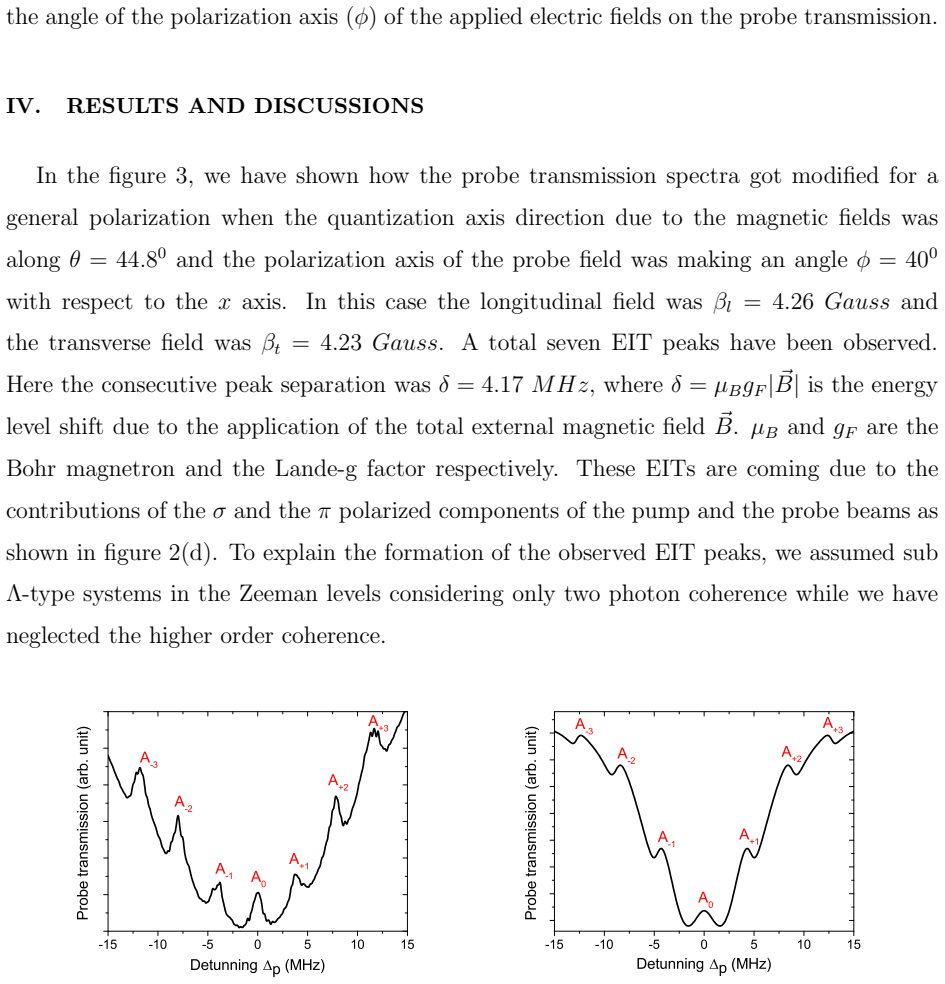
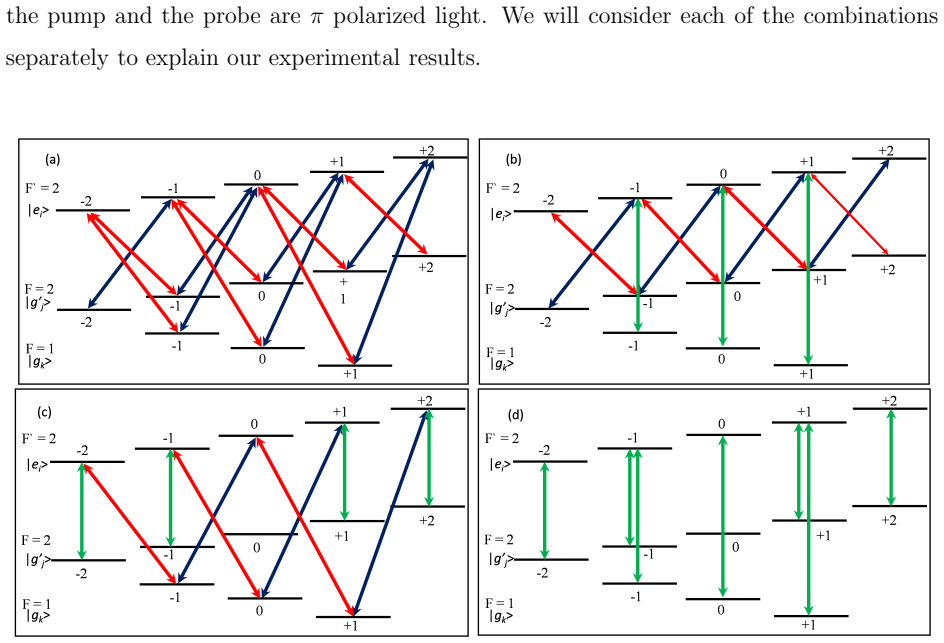
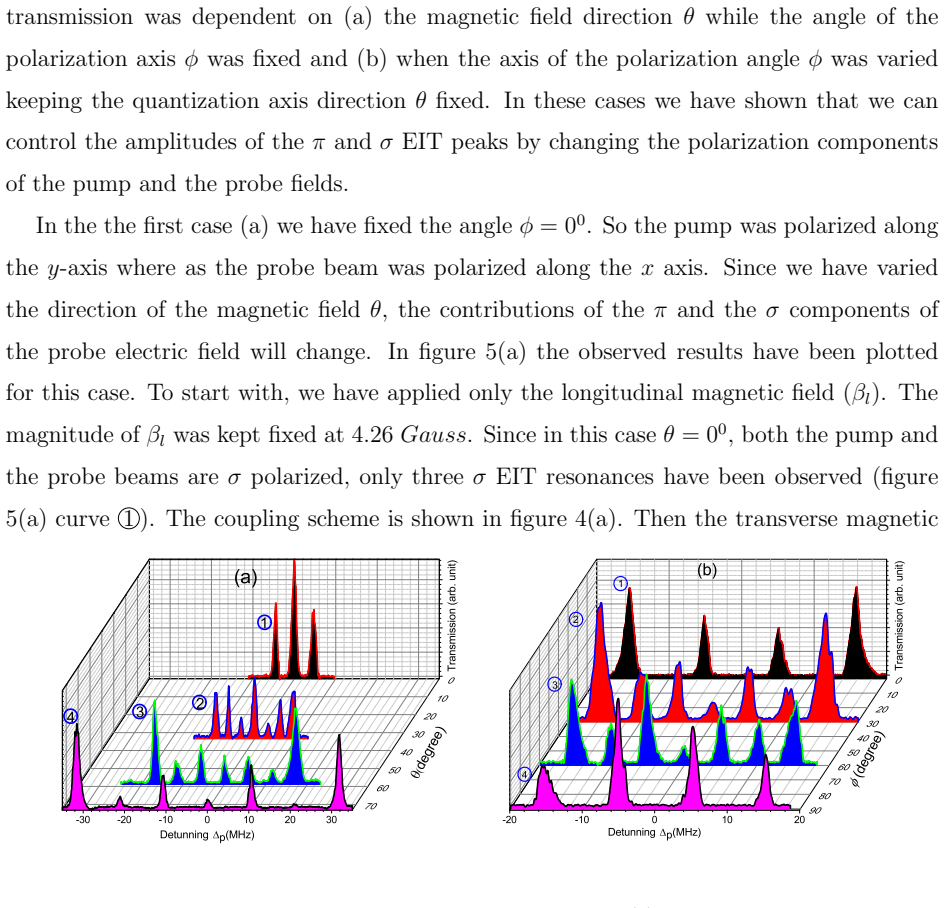
While keeping the pump intensity fixed at 17 . 5 mW/cm 2 and the probe intensity at 0 . 1 mW/cm 2, we have studied the effects of the external magnetic field ⃗B and the dependency of 6 the angle of the polarization axis ( φ) of the applied electric fields on the probe transmission. IV. RESUL TS AND DISCUSSIONS In the figure 3, we have shown how the probe trans...
work page 2018
- [2]
-
[3]
A. Das, B. C. Das, S. Chakrabarti, D. Bhattacharyya, and S . De, Laser Physics 28, 125205 (2018)
work page 2018
- [4]
-
[5]
B. C. Das, A. Das, D. Bhattacharyya, S. Chakrabarti, and S . De, OSA Continuum 2, 994 (2019)
work page 2019
-
[6]
I.-H. Bae, H. S. Moon, M.-K. Kim, L. Lee, and J. B. Kim, Opt. Express 18, 1389 (2010)
work page 2010
-
[7]
E. Boto, N. Holmes, J. Leggett, G. Roberts, V. Shah, S. S. M eyer, L. D. Mu˜ noz, K. J. Mullinger, T. M. Tierney, S. Bestmann, et al. , Nature 555, 657 (2018)
work page 2018
- [8]
-
[9]
S. Afach, D. Budker, G. DeCamp, V. Dumont, Z. Gruji, H. Guo , D. Jackson Kimball, T. Ko- rnack, V. Lebedev, W. Li, H. Masia-Roig, S. Nix, M. Padniuk, C . Palm, C. Pankow, A. Pe- naflor, X. Peng, S. Pustelny, T. Scholtes, J. Smiga, J. Stalna ker, A. Weis, A. Wickenbrock, and D. Wurm, Physics of the Dark Universe 22, 162 (2018)
work page 2018
-
[10]
M. Smiciklas, J. M. Brown, L. W. Cheuk, S. J. Smullin, and M . V. Romalis, Phys. Rev. Lett. 107, 171604 (2011)
work page 2011
-
[11]
J. Clarke and A. I. Braginski, The SQUID handbook , Vol. 1 (Wiley Online Library, 2004)
work page 2004
-
[12]
V. Shah, S. Knappe, P. D. Schwindt, and J. Kitching, Natu re Photonics 1, 649 (2007). 23
work page 2007
-
[13]
J. M. Schloss, J. F. Barry, M. J. Turner, and R. L. Walswor th, Phys. Rev. Applied 10, 034044 (2018)
work page 2018
- [14]
-
[15]
E. B. Alexandrov and V. A. Bonch-Bruevich, Optical Engi neering 31, 711 (1992)
work page 1992
- [16]
-
[17]
V. I. Yudin, A. V. Taichenachev, Y. O. Dudin, V. L. Velich ansky, A. S. Zibrov, and S. A. Zibrov, Phys. Rev. A 82, 033807 (2010)
work page 2010
-
[18]
K. Cox, V. I. Yudin, A. V. Taichenachev, I. Novikova, and E. E. Mikhailov, Phys. Rev. A 83, 015801 (2011)
work page 2011
- [19]
-
[20]
S. Bao, H. Zhang, J. Zhou, L. Zhang, J. Zhao, L. Xiao, and S . Jia, Phys. Rev. A 94, 043822 (2016)
work page 2016
-
[21]
J. Dimitrijevi´ c, A. Krmpot, M. Mijailovi´ c, D. Arseno vi´ c, B. Pani´ c, Z. Gruji´ c, and B. M. Jelenkovi´ c, Phys. Rev. A77, 013814 (2008)
work page 2008
-
[22]
L. Margalit, M. Rosenbluh, and A. D. Wilson-Gordon, Phy s. Rev. A 87, 033808 (2013)
work page 2013
-
[23]
S. M. Iftiquar and V. Natarajan, Phys. Rev. A 79, 013808 (2009)
work page 2009
-
[24]
N. Ram, M. Pattabiraman, and C. Vijayan, Phys. Rev. A 82, 033417 (2010)
work page 2010
-
[25]
Arimondo, in Progress in optics , Vol
E. Arimondo, in Progress in optics , Vol. 35 (Elsevier, 1996) pp. 257–354
work page 1996
-
[26]
A. V. Ta ˘ ıchenachev, V. I. Yudin, R. Wynands, M. St¨ ahle r, J. Kitching, and L. Hollberg, Phys. Rev. A 67, 033810 (2003)
work page 2003
- [27]
-
[28]
H. Lee, M. Fleischhauer, and M. O. Scully, Phys. Rev. A 58, 2587 (1998)
work page 1998
-
[29]
S. Rochester, “Computed with a user-extensible mathem atica based atomic density matrix package, atomicdensitymatrix, simon rochester,” http://rochesterscientific.com/ADM/
-
[30]
B. C. Das, D. Bhattacharyya, A. Das, S. Saha, S. Chakraba rti, and S. De, Journal of Physics B: Atomic, Molecular and Optical Physics 51, 245501 (2018)
work page 2018
- [31]
- [32]
-
[33]
A. Weis, Y. Shi, and Z. D. Gruji´ c, The European Physical Journal D 71, 80 (2017)
work page 2017
-
[34]
R. Wynands, A. Nagel, S. Brandt, D. Meschede, and A. Weis , Phys. Rev. A 58, 196 (1998). 24
work page 1998
discussion (0)
Sign in with ORCID, Apple, or X to comment. Anyone can read and Pith papers without signing in.