EU H2020 Gauss project. Geo-Fencing Software System
Pith reviewed 2026-05-25 15:50 UTC · model grok-4.3
The pith
A geofencing system uses real-time GNSS and IMU location data to generate guidance that lets UAVs evacuate no-fly zones without human input.
A machine-rendered reading of the paper's core claim, the machinery that carries it, and where it could break.
Core claim
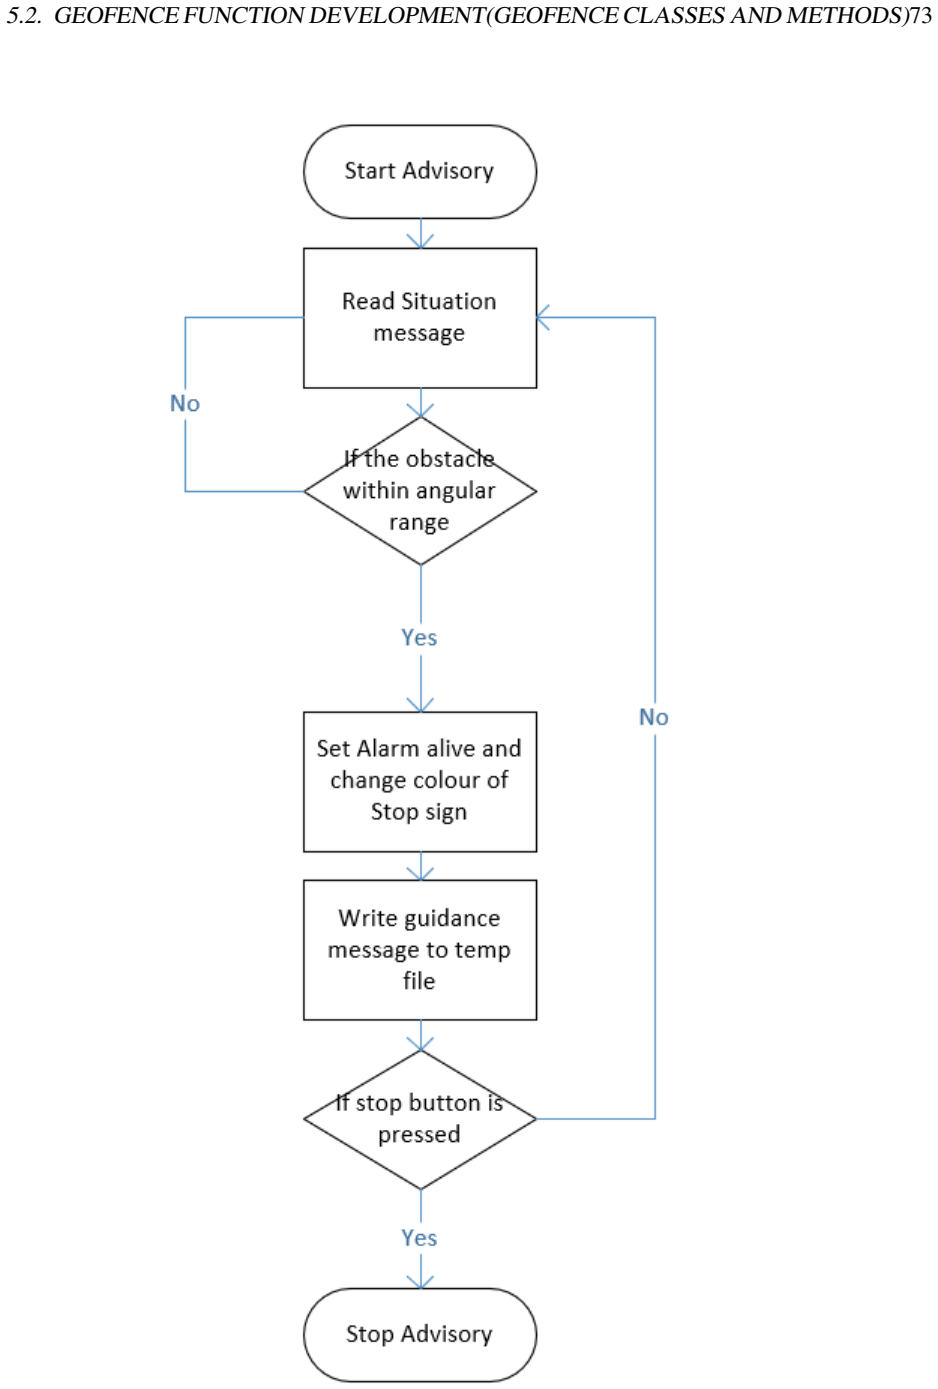
The Geofencing system is the key to operate the Unmanned Aerial Vehicle (UAV) within the safe and appropriate zone to avoid public concerns and other privacy issues. The system is designed to keep the UAV away from geofenced obstacles using the onboard GNSS and IMU location. The geofence system shall provide guidance message, which enables the UAV to evacuate from no-fly-zone, based on real-time updated location. This application enables UAV to fly in the designated area without human intervention. The project is built with JAVA using GIS-enabled Database Management System and Open Soured Map data powered by OpenStreetMap and OS map. This method has been tested by simulations which had a of
What carries the argument
Geofencing software that processes real-time GNSS and IMU data to issue evacuation guidance messages from no-fly zones.
Load-bearing premise
The simulations using selected map data and sensor models represent actual UAV flight dynamics and environmental conditions in real operations.
What would settle it
Conducting a physical UAV flight test in a no-fly zone scenario and comparing the system's real-time guidance and path adherence to the simulation predictions.
Figures


read the original abstract
The Geofencing system is the key to operate the Unmanned Aerial Vehicle (UAV) within the safe and appropriate zone to avoid public concerns and other privacy issues. The system is designed to keep the UAV away from geofenced obstacles using the onboard GNSS and IMU location. The Geofencing system is part of the H2020 GAUSS project and facilities other subsystems, for instance, to support the command and control link, which is the security measure to secure the UAV from hijacking and signal spoofing. The regulatory authorities expressed the concern of having UAVs flying in the no-fly zone and causing troubles from offending private privacy to hazards at airport airspace. Hence the geofence system shall provide guidance message, which enables the UAV to evacuate from no-fly-zone, based on real-time updated location. This thesis aims to first illustrate the generation of geofence and then apply the geofence system on UAV operation. This application enables UAV to fly in the designated area without human intervention. The project is built with JAVA using GIS-enabled Database Management System and Open Soured Map data powered by OpenStreetMap and OS map. This method has been tested by simulations which had results of high accuracy.
Editorial analysis
A structured set of objections, weighed in public.
Referee Report
Summary. The manuscript describes a Java-based geofencing software system developed under the EU H2020 GAUSS project. It uses GIS-enabled database management and OpenStreetMap data to enforce UAV flight boundaries via real-time GNSS/IMU positioning, generating evacuation guidance messages to avoid no-fly zones. The central claim is that simulations of this system produced results of high accuracy, enabling autonomous UAV operation in designated areas without human intervention.
Significance. A reliable geofencing implementation could support UAV regulatory compliance and safety, particularly for command-and-control link protection. However, the complete absence of any evaluation methodology, metrics, or results prevents any assessment of whether the work advances the state of the art or meets its stated objectives.
major comments (1)
- [Abstract] Abstract: The assertion that 'This method has been tested by simulations which had results of high accuracy' is presented without any description of the simulation environment, sensor noise models, test scenarios (e.g., urban vs. airport boundaries), success criteria, quantitative metrics (position error, false-positive rate), or comparison baselines. This directly undermines the claim that the system 'enables UAV to fly in the designated area without human intervention.'
minor comments (2)
- [Abstract] Typo: 'Open Soured Map' should read 'Open Source Map'.
- [Abstract] Wording: 'facilities other subsystems' appears intended to be 'facilitates other subsystems'.
Simulated Author's Rebuttal
We thank the referee for the detailed review of our manuscript describing the Java-based geofencing software system developed under the EU H2020 GAUSS project. We address the major comment below.
read point-by-point responses
-
Referee: [Abstract] Abstract: The assertion that 'This method has been tested by simulations which had results of high accuracy' is presented without any description of the simulation environment, sensor noise models, test scenarios (e.g., urban vs. airport boundaries), success criteria, quantitative metrics (position error, false-positive rate), or comparison baselines. This directly undermines the claim that the system 'enables UAV to fly in the designated area without human intervention.'
Authors: We agree that the abstract presents the simulation claim without supporting details on the environment, noise models, scenarios, criteria, or quantitative metrics. The manuscript primarily describes the system architecture, implementation in Java with GIS database and OpenStreetMap data, and the generation of evacuation guidance messages. No dedicated evaluation section with the requested elements is included. In a revision we will update the abstract to remove or qualify the 'high accuracy' claim and add a section describing the simulation setup, test scenarios, success criteria, and any available metrics such as position error. revision: yes
Circularity Check
No circularity; purely descriptive implementation paper
full rationale
The manuscript is a project description of a Java/GIS/OpenStreetMap geofencing system for UAVs. It contains no equations, derivations, parameters fitted to data then relabeled as predictions, self-citations used as load-bearing uniqueness theorems, or ansatzes smuggled via prior work. The sole accuracy claim is an unsupported direct assertion about simulation results; it does not reduce to any input by construction. This matches the default non-circular outcome for papers without formal derivation chains.
Axiom & Free-Parameter Ledger
axioms (2)
- domain assumption OpenStreetMap and OS map data are sufficiently accurate and current for defining UAV no-fly zones
- domain assumption Simulation results transfer to real-world UAV behavior
Reference graph
Works this paper leans on
-
[1]
Raster to Polygon—Conversion toolbox — ArcGIS Desktop, 2018
ArcGIS. Raster to Polygon—Conversion toolbox — ArcGIS Desktop, 2018
work page 2018
-
[2]
Geospatial Data Abstraction software Library, 2018
GDAL/OGR contributors. Geospatial Data Abstraction software Library, 2018
work page 2018
-
[3]
TODAYonline — Standardise penalty regime, geo- fencing technology for bike-sharing operators, 2017
EDW ARD LIM YEW SIH. TODAYonline — Standardise penalty regime, geo- fencing technology for bike-sharing operators, 2017
work page 2017
-
[4]
Eric Fischer, Konstantin Kaefer, Tom Macwright, Tom Miller, Paul Norman, Blake Thompson, and Will White. MBTiles Specification, 2018
work page 2018
-
[5]
Spatial functions in MySQL 5.6, MariaDB 5.5, PostGIS 2.0 and others
Henrik Ingo. Spatial functions in MySQL 5.6, MariaDB 5.5, PostGIS 2.0 and others. Technical report, Nokia, 2013
work page 2013
-
[6]
Intel R⃝ NUC Kit NUC5i7RYH Product Specifications, 2015
Intel. Intel R⃝ NUC Kit NUC5i7RYH Product Specifications, 2015
work page 2015
-
[7]
Space Images — SRTM Data Release for Eurasia, Index Map and Colored Height
Jet Propulsion Laboratory. Space Images — SRTM Data Release for Eurasia, Index Map and Colored Height. Technical report, 2004
work page 2004
-
[8]
Course: Quality Management, DPT404 The V-Model
Conny Johansson and Christian Bucanac. Course: Quality Management, DPT404 The V-Model. Technical report, 1999
work page 1999
- [9]
-
[10]
Audio Warnings: Does the beep mean the coffee’s done
Paul Novacek. Audio Warnings: Does the beep mean the coffee’s done. Avionics News, 2003
work page 2003
-
[11]
Open styles, map gallery, catography, 2018
OpenMapTiles. Open styles, map gallery, catography, 2018. 99 100 REFERENCES
work page 2018
-
[12]
OpenStreetMap Contributors. OpenStreetMap Component, 2017
work page 2017
-
[13]
A Guide to Coordinate Systems in Great Britain V3.2
Ordnance Survey. A Guide to Coordinate Systems in Great Britain V3.2. Technical report, 2018
work page 2018
-
[14]
National Grid Reference System, 2018
Ordnance Survey. National Grid Reference System, 2018
work page 2018
-
[15]
737 Simulator Expanded Primary Flight Display (PFD), 2014
PmFlight. 737 Simulator Expanded Primary Flight Display (PFD), 2014
work page 2014
-
[16]
Geo-Fencing for Unmanned Aerial Vehicle
P L Pratyusha and V P S Naidu. Geo-Fencing for Unmanned Aerial Vehicle. Inter- national Journal of Computer Applications , (Ncesco):975–8887, 2015
work page 2015
-
[17]
Unmanned Aircraft System Operations in UK Airspace - Guidance
Safety and Airspace Regulation Group. Unmanned Aircraft System Operations in UK Airspace - Guidance. Technical report, CAA, 2001
work page 2001
-
[18]
Electronic Centralized Aircraft Monitor (ECAM) - SKYbrary Aviation Safety
SKYbrary. Electronic Centralized Aircraft Monitor (ECAM) - SKYbrary Aviation Safety. Technical report, 2018
work page 2018
-
[19]
Simon. St. Laurent and Michael Fitzgerald. XML pocket reference. O’Reilly, Se- bastopol Calif., 3rd ed. / edition, 2005
work page 2005
-
[20]
The Air Navigation Order 2016 and Regulations
The Office of the General Counsel. The Air Navigation Order 2016 and Regulations. Technical report, CAA, 2016
work page 2016
-
[21]
Unmanned Aircraft System Airspace Integra- tion Plan
United State Department of Defense. Unmanned Aircraft System Airspace Integra- tion Plan. Technical report, 2011
work page 2011
-
[22]
Government Accountability Office
U.S. Government Accountability Office. GIS allows multiple layers of information to be displayed on a single map. 2018
work page 2018
-
[23]
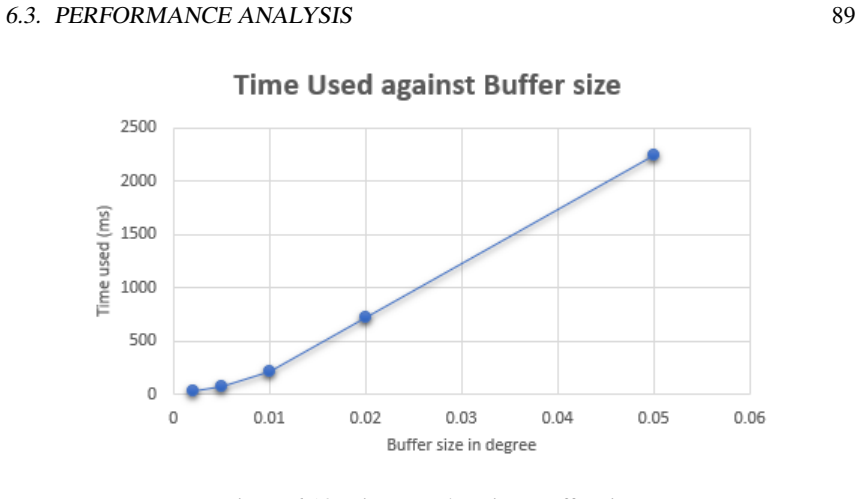
WHATWG and World Wide Web Consortium. DOM Standard, 2018. Appendix A Test result of Intel NUC hardware platform Intel NUC test result of executing following SQL command using a series of buffer size: 1 d e l e t e from t e m p t a b l e ; 2 i n s e r t i n t o t e m p t a b l e ( osmid , geom , s t w i t h i n ) 3 s e l e c t osm id , geom , s t w i t h i...
work page 2018
-
[24]
, 49 0 . 0 0 0 0 1 , ’ q u a d s e g s =2 ’ ) ) ; 50 51 −− t h e uavgeom i s u n i q u e and i s u s e d a s t h e p r i m a r y k e y h e r e 52 a l t e r t a b l e u a v l o c a t i o n 53 add c o n s t r a i n t ” p k u a v l o c a t i o n ” primary key ( ” uavgeom ” ) ; 54 55 −− u a v m o t i o n t a b l e c o n t a i n s t h e uav h e a d i n g and v...
discussion (0)
Sign in with ORCID, Apple, or X to comment. Anyone can read and Pith papers without signing in.