REVIEW 4 major objections 5 minor 27 references
Ionic Conductivity Of Solid Oxides Hxag1-xtawo6.NH2O: Microstructural Aspects
T0 review · 4 major / 5 minor · reviewed 2026-08-14 · deepseek-v4-flash
Pith's one-line read The x=0.20 pyrochlore's negative cooling slope comes from condensed water on porous easy-path grain contacts, not from an intrinsic material property.
desk verdict Plausible but under-supported explanation for a real anomaly in one doped pyrochlore; worth refereeing, not yet convincing. read the letter →
The pith
A machine-rendered reading of the paper's core claim, the machinery that carries it, and where it could break.
The reading
What carries the argument
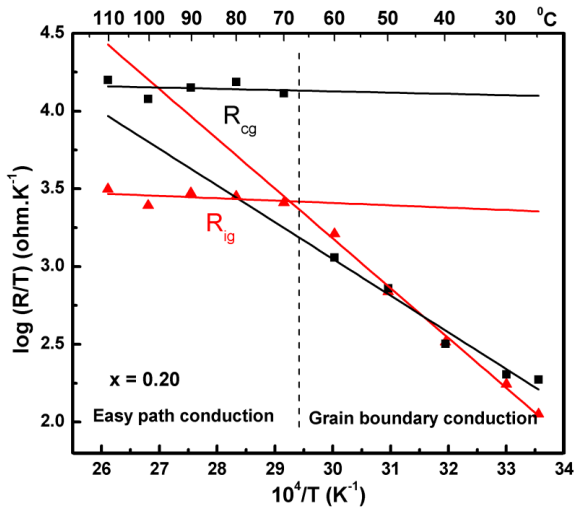
The 'easy-path' model of polycrystalline conduction, in which grain boundaries are discontinuous and current flows preferentially through isolated points of direct grain contact; it is represented here by an equivalent circuit of two parallel resistor–constant-phase-element (R–CPE) branches in series. The paper combines this circuit with the brick-layer and electric-modulus analyses to separate grain-interior and grain-boundary resistances, and uses the near equality of their fitted slopes in the easy-path region to identify the regime. The same electric-modulus diagnostic is used to assign Suzuki-type precipitate structure to the higher-x samples. The ratio β=0.83 from the circuit fit gives the fraction of grain surface covered by the blocking second phase, and the percolation threshold for the face-centered-cubic pyrochlore lattice connects the doping level to the onset of long-range proton paths.
What would settle it
Repeat the cooling impedance run for x=0.20 in a dry gas flow: the negative Arrhenius slope should vanish and the activation energy should return to the 0.23–0.60 eV band, confirming the water-condensation mechanism; if the negative slope persists without water vapor, the explanation fails. Scanning electron microscopy showing continuous grain boundaries without narrow easy-path contact points would also disprove the microstructure assignment.
Extended reading notes
Core claim
The central claim is that the negative activation energy observed only for the x=0.20 sample is a signature of the 'easy-path' microstructure plus water, not a different intrinsic conduction mechanism. In that sample the grain-boundary phase covers about 83% of the grain surface, leaving only about 17% of direct electrical contact; as the sample cools, condensed water on those contacts creates conductive paths that grow faster than the intrinsic resistance rises, producing the apparent negative activation energy of about -0.62 eV. For the x=0.80 and x=0.67 samples, electric-modulus arcs indicate Suzuki-type phase precipitates with larger grains and well-defined grain boundaries, so the same water-condensation effect does not dominate. The paper also concludes that H+ is the mobile carrier, that Ag+ occupies channel sites and blocks proton paths, and that increasing silver content lowers the activation energy until percolation sets the practical limit near x=0.90.
Load-bearing premise
The explanation depends on water condensing on the x=0.20 sample's grain boundaries during cooling, but the impedance measurements were made without controlled humidity and without any reported water-content measurement, so the anomaly could have a different cause.
Editorial extensions
If this is right
- The negative Arrhenius slope for x=0.20 is an extrinsic water-condensation effect tied to the easy-path microstructure, so it should not be interpreted as faster intrinsic ionic conduction at low temperature.
- Samples with Suzuki-type precipitates and continuous grain boundaries (the x=0.80 and x=0.67 cases) should remain well-behaved Arrhenius conductors under the same conditions.
- Silver doping tunes the proton conduction barrier: activation energies across the doped series lie between the hydrated (0.23 eV) and anhydrous (0.60 eV) values of the pure compound.
- Since Ag+ occupies channel sites and blocks proton paths, the percolation threshold for the fcc pyrochlore lattice implies that increasing silver content toward about x=0.90 can still improve conductivity.
- Confirming the microstructural model will require scanning electron microscopy and impedance measurements under controlled atmosphere, as the paper itself states.
Reading between the lines
- If the paper is right, the same water/easy-path coupling should make the x=0.20 sample's conductivity near 60–70 °C strongly humidity-dependent; that is a testable prediction the paper does not report.
- A broader consequence: an apparent negative activation energy in a porous proton conductor can be a warning of surface-water percolation rather than evidence of a new conduction mechanism.
- The β=0.83 estimate is a geometric prediction—most of the grain surface covered by a second phase, with small contact patches—that scanning electron microscopy can directly check.
- Comparing the onset of the cooling anomaly with the dew point of the measurement atmosphere would provide an independent, non-destructive test of the water-condensation story.
Signed reviews
Editorial analysis
A structured set of objections, weighed in public.
Referee Report
Summary. The manuscript reports impedance spectroscopy measurements of the pyrochlore series H_xAg_{1-x}TaWO6.nH2O for x = 0.20, 0.33, 0.50, 0.67, and 0.80, measured during heating from about 25 °C to 110 °C and during cooling back to 25 °C. Activation energies are extracted from Arrhenius plots of the real conductivity, and the reported values are compared with literature values for the pure HTaWO6 phases. The central claim is that the anomalous negative Arrhenius slope observed only for the x = 0.20 sample during cooling is explained by a microstructure difference: this sample is said to have an 'easy-path' microstructure with high porosity, while the x = 0.67 and x = 0.80 samples are said to have Suzuki-type precipitates. The authors also claim that increasing silver doping reduces the activation energy and that the doping dependence of conductivity can be understood through channel enlargement and percolation-blocking arguments.
Significance. If the central claim were established, the paper would provide a useful cautionary example of how extrinsic effects (humidity and microstructure) can masquerade as intrinsic ionic-conduction anomalies in pyrochlore proton conductors. The authors are candid in two places: they call the beta = 0.83 estimate 'only an estimate' and state that the easy-path microstructure 'needs to be confirmed through Scanning Electron Microscopy'; they also state that a controlled-atmosphere impedance study is required. Those admissions are to the authors' credit, but they also confirm that the paper's headline explanation is not yet supported by direct evidence. The paper does not provide new reproducible code or machine-checked derivations; the quantitative content consists of linear fits and an equivalent-circuit analysis whose raw spectra and residuals are not shown.
major comments (4)
- [Abstract and §2.2] The abstract asserts that the x = 0.20 sample 'has high porosity' and is well characterized by the easy-path model, but §2.2 states that the microstructure of this sample is one with 'grains very close to each other, i.e., very narrow grain boundary.' High porosity and narrow grain boundaries are different geometrical descriptions, and neither is quantitatively established in the manuscript. Since the easy-path interpretation requires point contacts between grains with reduced grain-boundary volume, this internal contradiction is load-bearing for the paper's central claim.
- [§2.1, activation-energy list] The bullet-list items in §2.1 give heating activation energies of 0.28, 0.47, 0.55, 0.37, and 0.30 eV for x = 0.20, 0.33, 0.50, 0.67, and 0.80, respectively, yet the text states that 'the increased doping reduces the activation energy during the heating process.' These data are not monotonic in x, so the stated trend is contradicted by the paper's own numbers. No uncertainties are reported for any activation energy, so the claimed doping dependence and the later percolation-based discussion in §2.2 are not quantitatively supported.
- [§2.2, Eqs. (9)-(10) and Figure 3] The beta = 0.83 estimate for the grain-surface coverage of the x = 0.20 sample is obtained from a two-(R-CPE) series equivalent-circuit fit, but the manuscript does not show the raw impedance spectra, the fitted curves, the residuals, or any uncertainties on R_ig and R_cg. Without those, the reader cannot assess whether the fit is unique or whether the extracted resistances used in Eq. (10) are reliable. The text itself calls the estimate approximate and states that confirmation by SEM is needed, which is appropriate, but it means the microstructural explanation of the Arrhenius anomaly is currently unverified.
- [§2.1 and §2.2, water-condensation premise] The negative cooling slope for x = 0.20 is attributed throughout to water condensation on grain boundaries, but the impedance measurements were not performed under controlled humidity and no water content or mass-change data are reported. The discussion in §2.2 builds the entire easy-path explanation on this premise: the 'dominant thermal process is water evaporation' and condensation produces percolating conductive paths. The conclusion concedes that a controlled-atmosphere impedance study is needed, which confirms that the current data cannot distinguish the proposed water-condensation mechanism from other possible origins of the observed anomaly.
minor comments (5)
- [Figure 2 caption] The word 'Arrehnius' in the Figure 2 caption is a typo for 'Arrhenius'.
- [Equations (8)] Equation (8) appears twice with the same number; the second Arrhenius equation should have a different number to avoid confusion in the text.
- [References] The reference list contains duplicated entries: reference [7] and [19] are the same Mari et al. paper, references [17] and [20] are the same Catti/Mari/Castelli paper, and reference [29] duplicates reference [9].
- [Introduction, first paragraph] The phrase 'piezoelectricity, iron and iron magnetism' is garbled; it presumably should read 'ferroelectricity and ferromagnetism' or similar.
- [General] Activation energies are reported to two decimal places without uncertainties, standard errors, or the number of points used in each linear fit; including these would allow the reader to judge whether the reported differences (e.g., 0.02 eV for x = 0.50) are meaningful.
Circularity Check
Some self-citation is load-bearing for the Ag+-immobility premise, but the central microstructural explanation of the x=0.20 anomaly is not circular by construction.
-
self citation load bearing
[Section 2.2, paragraph after Figure 8]
"The results discussed in Chapter 3 of Reference [24] indicate that the Ag+ cannot be the carrier; otherwise, the material would degrade in the TaWO5.5 compound. Besides, among the various conduction mechanisms cited in Reference [24]: jumps, tunneling, mixed (jumps and tunneling) [23], Grothus effect [29] and the effect of surface water in the grain boundaries [29], only jump conduction and conductivity by surface water of grain boundary are possible in our samples."
The paper's conclusion that H+ (not Ag+) is the mobile carrier, and that only jump conduction and surface-water conduction are possible, rests on Reference [24], the first author's own PhD thesis, with no independent transport-number, degradation, or controlled-humidity measurement reported here. This self-citation is load-bearing for the mechanism used to interpret the doping dependence of the activation energies and for the water-condensation reading of the x=0.20 anomaly; because [24] is not machine-checked, code-reproduced, or externally falsified in this paper, the argument reduces to an unverified self-citation at this step.
full rationale
The paper's central claim is that the cooling anomaly unique to x=0.20 is caused by a microstructural difference (easy-path contacts plus water condensation) rather than an intrinsic bulk process. That claim is developed from impedance-spectroscopy data and from external literature on hygroscopic materials (refs. [19-22]); it is not produced by a formal equation whose output equals its input. The equivalent-circuit fit for x=0.20 yields R_ig and R_cg, and beta=0.83 is a deterministic function of those fitted resistances, but the paper explicitly calls this 'only an estimate' and states that the results 'need to be confirmed through studies of the technique of Scanning Electron Microscopy,' so the beta-derived contact fraction is not presented as an independent prediction. The activation-energy comparison with the pure-compound literature values (0.23-0.60 eV) is an external benchmark and is not circular. The main circularity-adjacent weakness is the reliance on the first author's PhD thesis (Ref. [24]) for the Ag+-immobility premise and for the specific 70-100 C water-loss window; the former is load-bearing for the conclusion that silver blocks proton conduction. The paper also contains an internal inconsistency between the abstract's 'high porosity' and the text's 'very narrow grain boundary' for x=0.20, but that is an unsupported or contradictory factual claim, not a circular derivation. Overall, the central microstructural explanation has independent content, so the score reflects only the load-bearing self-citation rather than a fully circular derivation.
Assumptions & free parameters
free parameters (5)
- Activation energies (heating) for x=0.20, 0.33, 0.50, 0.67, 0.80 =
0.28, 0.47, 0.55, 0.37, 0.30 eV
- Activation energies (cooling) for x=0.33, 0.50, 0.67, 0.80 =
0.59, 0.57, 0.45, 0.35 eV
- Negative Arrhenius slope for x=0.20 during cooling =
-0.62
- beta (grain-boundary surface coverage fraction) =
0.83
- Nominal silver fraction x =
0.20, 0.33, 0.50, 0.67, 0.80
assumptions (6)
- standard math Arrhenius law: sigma_dc*T = sigma0*exp(-Ea/(k_B*T))
- domain assumption Equivalent-circuit models (brick-layer and easy-path) describe the impedance response of the samples
- domain assumption The nominal silver molar fraction equals the actual silver content
- ad hoc to paper Water condensation on grain boundaries causes the negative Arrhenius slope for x=0.20
- domain assumption Ag+ ions do not take part in ionic conduction
- domain assumption FCC site percolation threshold (p_c = 0.2) applies to proton hopping in the pyrochlore sublattice
Cite this review
Pith. "Pith review of Ionic Conductivity Of Solid Oxides Hxag1-xtawo6.NH2O: Microstructural Aspects." pith.science (2026). https://pith.science/paper/QKMUOS2W
@misc{pith2026190800594,
  author       = {Pith},
  title        = {Pith review of: Ionic Conductivity Of Solid Oxides Hxag1-xtawo6.NH2O: Microstructural Aspects},
  year         = {2026},
  howpublished = {\url{https://pith.science/paper/QKMUOS2W}},
  note         = {Machine review of arXiv:1908.00594}
}
read the original abstract
A study of impedance spectroscopy was done for the electrical characterization of pyrochlore materials. The experiment consisted of measurements of the dependence of the impedance of such systems with the temperature during heating (25 to 110 {\deg}C) and cooling (110 to 25 {\deg}C). The goal was to try to avoid the effect of humidity in the impedance spectrum. However, for the sample with x = 0.20, we get an anomalous response of the conductivity during the cooling process. To explain this result, we performed micro-structure characterization in this sample and in the samples with x = 0.80 and 0.67. The result is that the sample with x = 0.20 is well characterized by the model "easy-path" because it has high porosity while the other two must have phase precipitate structure type Suzuki. These results served to explain why the anomaly on the Arrhenius plot occurred only in the 0.20 concentration sample: microstructure difference. In this study we can also note that the doped samples had a dependence of activation energies related to the rates of concentration. Except for the sample with concentration rate of 0.20, the activation energies during cooling are among the values of 0.60 and 0.23 eV of their pure counterparts which are registered in the literature.
Figures


Figures from the paper (3 more)


Reference graph
Works this paper leans on
-
[1]
S. C. Chelgani et. al, Minerals Engineering 55, 165–171 (2014)
work page 2014
- [2]
-
[3]
M.A. Subramanian, G. Aravamudan, and G.V.S. Rao, Prog. Solid State Chem. 15 55–143 (1983)
work page 1983
-
[4]
M.A. Subramanian, B.H. Toby, A.P. Ramirez, W.J. Marshall, A.W. Sleight, and G.H. Kwei, Science 273 (1996) 81–84
work page 1996
- [5]
-
[6]
S. Yonezawa, Y. Muraoka, Y. Matsushita, Z. Hiroi, J. Phys.: Condens. Matter 16 (2004) L9 – L12
work page 2004
-
[8]
J. Hidalgo, M. Colet-Lagrille, and A. Mukasyan, Cryst. Res. Technol. 50, No. 11, 879 –883 (2015)
work page 2015
-
[10]
J. R. Macdonald, Impedance Spectroscopy Emphasizing Solid Materials and Sistems , JOHN WILEY SONS, 1 edition, 1987
work page 1987
Show all 27 references
-
[11]
C. Leon, M. L. Lucia, and J. Santamaria, Physical Review B 55, 882 (1997)
1997
-
[13]
Zarbin, Aldo J G, Alves, Oswaldo L, Amarilla, J Manuel, Rojas, R M, and Rojo, J.M, Chem. Matter. V. 11, p. 1652-1658, (1999)
1999
-
[14]
Galembeck, and O.L
A. Galembeck, and O.L. Alves. J. Mater. Sci, v.34, p. 3275-3280, (1999)
1999
-
[15]
J A Díaz-Guillén, A F Fuentes, M R Díaz -Guillén, J M Almanza, J Santamaría, and C Léon, Journal of Power Sources 186, 349 (2009)
2009
-
[16]
M. A. C. de Santis, Estrutura lamelar versus estrutura pirocloro: Obtenção de compostos do tipo H1-xAgxTaWO6, Master thesis, UNICAMP-Universidade Estadual de Campinas, 2006
2006
-
[17]
C. M. Mari, M. Catti, and M. Castelli, A Characterization of KTaWO 6.H2O. Mat. Res. Bull., v.21. p. 773-778, (1986)
1986
-
[18]
E. N. Silva, Espectroscopia vib racional e de impedância em monocristais de SrAlF 5, Master thesis, Universidade Federal do Ceará, 2005
2005
-
[19]
C. M. Mari, F. Bonino, M. Catti, R. Pasinetti, and S. Pizzini, Sol. Stat. Ion. 18-19, 1013 (1986)
1986
-
[20]
C. M. Mari, M. Catti, A. Castelli, and F. Bonino, Mat. Res. Bull. 21, 773 (1986)
1986
-
[21]
Catti, E
M. Catti, E. Cazzanelli, C. M. Mari, and G. Mariotto, J. Solid State Chem. 107, 108 (1993)
1993
-
[22]
Catti and C
M. Catti and C. M. Mari, Sol. Stat. Ion. 40/41, 900 (1990)
1990
-
[23]
Butler and R
M.A. Butler and R. M. Biefeld, Phys. Rev. B 19, 5455 (1979)
1979
-
[24]
Valim, Espectroscopia vibracional e de impedância de A 1-xA`xTaWO6.nH2O (A= H, Li, A'=Ag, H), PhD thesis, Universidade Federal do Ceará, Fortaleza-CE, 2009
D. Valim, Espectroscopia vibracional e de impedância de A 1-xA`xTaWO6.nH2O (A= H, Li, A'=Ag, H), PhD thesis, Universidade Federal do Ceará, Fortaleza-CE, 2009
2009
-
[25]
Bonanos and E
N. Bonanos and E. Lilley, J. Chem. Solids 42, 943 (1981)
1981
-
[26]
J. E. Bauerle, Journal of Physical Chemistry Solids 30, 2657 (1969)
1969
-
[27]
E. J. L. Schouler, Etude des Cellules a Oxyde Electrolyte Solide per la Methode des Impedances Complexes, Ph.d thesis, Institut National Potytechinique de Grenoble, 2005
2005
-
[28]
Lilley and J
E. Lilley and J. E. Strutt, Physics State Solid 54, 639 (1979)
1979
-
[29]
Catti, C
M. Catti, C. Mari, and G. Valerio, Journ. Sol. Stat. Chem. 98, 269 (1992)
1992
-
[30]
C. D. Lorentz and R. M. Ziff, Journal of Physics A 31, 8147 (1998)
1998
Reviewed August 14, 2026 · model on record in the stance chip above.
Discussion (0). Continue with ORCID to comment.