REVIEW 4 major objections 6 minor 19 references
Mitigation of Coincident Peak Charges via Approximate Dynamic Programming
T0 review · 4 major / 6 minor · reviewed 2026-08-14 · deepseek-v4-flash
Pith's one-line read A neural policy trained on sampled load paths can cut coincident peak charges near-optimally for small customers.
desk verdict Nice new formulation for coincident peak charge mitigation, but the near-optimality claim outruns the evidence. read the letter →
The pith
A machine-rendered reading of the paper's core claim, the machinery that carries it, and where it could break.
The reading
What carries the argument
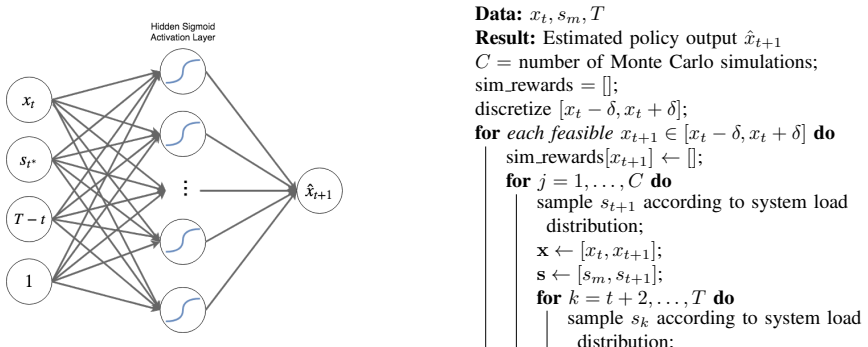
The machinery is a three-step approximation of dynamic programming. First, the expected-reward expression is rewritten so that, at any time $t$, the only load information that matters is the running maximum $s_m=\max\{s_1,\dots,s_t\}$; this reduces the state to $(x_t, s_m, T-t)$. Second, Algorithm 1 generates training labels for the policy by Monte Carlo simulation: for each feasible next consumption $x_{t+1}$, it rolls forward $C$ load paths, fills the remaining decisions with random feasible consumptions, and records the average reward; the best-scoring $x_{t+1}$ becomes the target. Third, a single-hidden-layer neural network with sigmoid activation is trained by mean-squared error to reproduce these targets, producing a deterministic policy $\hat{x}_{t+1}=f(x_t, s_m, T-t)$.
What would settle it
On a small instance (for example $T=4$, $\delta=0.3$, revenue $g_1$), compute the true optimal continuation value for every feasible $x_{t+1}$ by exhaustive dynamic programming, then compute Algorithm 1's random-rollout estimate for the same states; if the two rankings disagree for a nontrivial fraction of states, the training-label assumption is false and the near-optimality claim would fail on that instance.
Extended reading notes
Core claim
The paper's central claim is that a near-optimal policy for coincident peak charge mitigation exists for a small consumer with concave revenue and a ramping constraint, and that it can be approximated by a neural network trained on randomly simulated load paths. The state of the problem is compressed to three numbers—current consumption $x_t$, the maximum system load observed so far $s_m$, and the number of periods left $T-t$—and a policy $f$ maps these to the next consumption $x_{t+1}$. The authors show, in two numerical case studies with different concave revenue functions, that this trained policy earns expected revenue close to the brute-force grid-search optimum and consistently above the naive equal-amortization benchmark. They also observe that the shape of the learned policy depends on the curvature of the revenue function: with sharper diminishing returns, the optimal response is more conservative curtailment.
Load-bearing premise
During training, the algorithm judges each candidate next action by simulating the rest of the billing period with random future consumption choices rather than optimal ones, and assumes those random continuations still rank the candidates correctly.
Editorial extensions
If this is right
- A customer using the learned policy can curtail for coincident peak charges using only load forecasts and observed loads, without relying on operator warning signals.
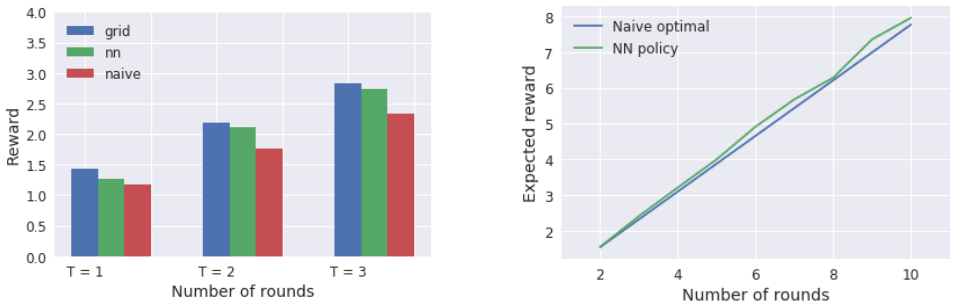
- The state compression to $(x_t, s_m, T-t)$ implies that the same policy structure works for any billing horizon $T$, and the paper reports performance for $T=2$ through $10$ rounds.
- Because the policy is trained offline on sampled paths, the online computation at each hour is a single forward pass through a small network, trivial for a small consumer.
- The benchmark comparison indicates that the common naive equal-amortization strategy leaves measurable expected revenue on the table for concave revenue functions.
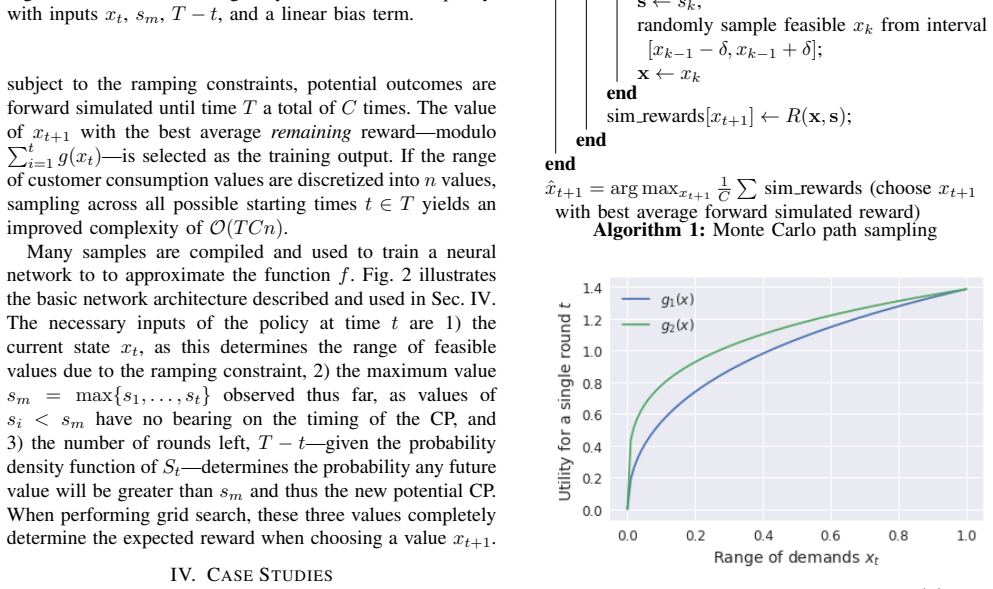
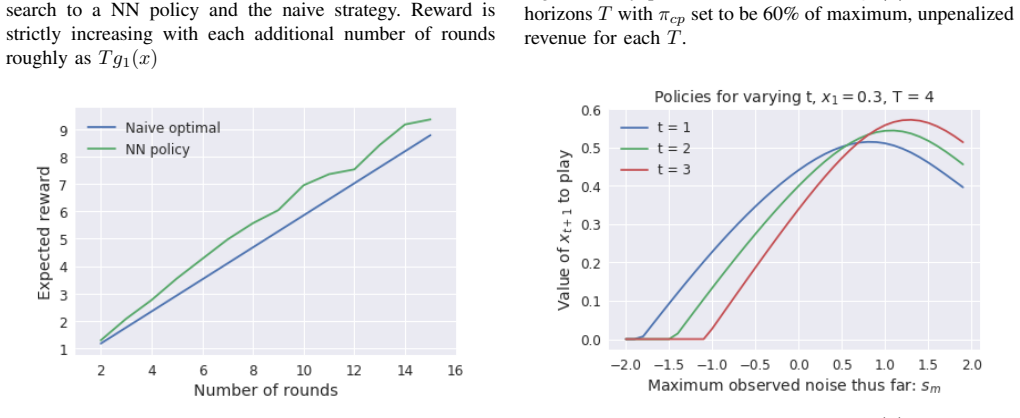
- The qualitative difference between the policies learned for $g_1$ and $g_2$ suggests that the optimal curtailment posture depends on the revenue function's curvature, not just on the CP charge rate.
Reading between the lines
- An implicit consequence is that the method's practical value depends on forecast error independence; if a real system shows correlated or heavy-tailed forecast errors, the Monte Carlo labels would need to be drawn from that richer model, which the paper does not test.
- The random-rollout label generator could be replaced by a learned critic or by cross-validation against exhaustive DP on small horizons; such a check would tell whether the near-optimality extends beyond the paper's two revenue functions.
- For large customers, the same formulation with $S_t$ depending on $x_t$ becomes a game; the paper's Cournot remark suggests a tractable extension where each player's policy is trained against simulated rivals.
- A practical extension would train the policy on the actual distribution of forecast errors observed by a utility, including the non-Gaussian tails shown for the PJM subregion, and measure revenue gains on historical CP events.
Signed reviews
Editorial analysis
A structured set of objections, weighed in public.
Referee Report
Summary. The paper considers a small electricity customer facing coincident peak (CP) charges, where the customer pays a high rate on consumption at the single time period of maximum system load. The customer maximizes expected revenue over a finite horizon with concave revenue and a ramping constraint. The authors formulate the problem as a sequential stochastic optimization, derive an exact optimality condition for the final time step, and then propose an approximate dynamic programming approach. Training data for a neural-network policy are generated by Monte Carlo forward simulation in which, for each candidate next action, future actions are sampled uniformly from the feasible ramp interval. The learned policy is compared to a naive equal-amortization baseline and, for small horizons, to an exhaustive grid-search policy.
Significance. If the central claim were established, the paper would provide a practical, model-based method for CP charge mitigation that avoids the ad hoc threshold curtailment used in prior work, and the neural-network policy would be a useful contribution for small consumers. The paper is transparent: the authors provide a link to code for reproducing the results, the problem formulation is clearly stated, and the final-step DP recursion in Section III-A is correct. However, the paper's main claimed contribution, the existence of a near-optimal policy, is not supported by a proof or by sufficient empirical evidence. The training-label estimator in Algorithm 1 is based on random rollouts of a base policy, not on optimal policy evaluation, and no argument is given that the resulting ranking is consistent with the true value function. The numerical validation covers only small horizons against the grid-search benchmark and only a naive baseline for larger horizons, without statistical uncertainty quantification. Thus the significance is real only if the methodological gap is addressed or the claims are appropriately softened.
major comments (4)
- [Section III-B, Algorithm 1] The training labels for the neural policy are generated by forward simulation in which all future actions after the candidate x_{t+1} are sampled uniformly at random from the feasible ramp interval, rather than chosen according to an optimal or approximately optimal policy. This estimator is consistent for the value of a random base policy, not for the optimal Q-function, and no argument is given that the argmax of this estimator ranks candidate actions consistently with the true dynamic programming value. Because these labels are the sole training signal for the neural network, the near-optimality of the learned policy is not established; the exact final-step recursion in Section III-A does not extend to this sampling procedure.
- [Abstract and Section I] The abstract claims that the paper 'show[s] the existence of a near-optimal policy', but there is no theorem or proof of near-optimality anywhere in the manuscript. The only exact optimality statement is the final-step recursion in Eq. (5). For T > 1, no suboptimality bound is provided. The empirical comparison in Fig. 4 covers only T = 2, 3, 4, and Figs. 5–6 compare only against the naive equal-amortization baseline, which the paper itself acknowledges is suboptimal; outperforming that baseline does not demonstrate near-optimality.
- [Section IV, Figs. 4–6] The case studies are small and do not report error bars, confidence intervals, or results across multiple random seeds. Moreover, all training and evaluation data are generated by Monte Carlo simulation from the same stochastic model of system load, so the comparison is entirely internal to that model. There is no evidence of robustness to the forecast-error distribution or to the model mismatch discussed in Section II, which weakens the empirical support for the central claim.
- [Section IV, Fig. 4] The text states that the grid-search discretization resolution has a 'noticeable effect' on the resulting reward, but no sensitivity analysis of this effect is provided. Since the grid-search result is used as the 'best-possible' benchmark, the resolution ambiguity makes it difficult to assess how close the NN policy actually is to the true optimum.
minor comments (6)
- [Section II.B] The sentence 'The the CP charge is evenly distributed...' contains a duplicate article and should read 'The CP charge is evenly distributed...'.
- [Section IV, paragraph after Fig. 5] The phrase 'an solution approximated from sampled paths' should be 'a solution approximated from sampled paths'.
- [Section III.A, Eqs. (5)–(6)] The conditioning notation is inconsistent between E[R|s_m] and E[R|s_1,...,s_{T-1}]; please make the conditioning explicit and align the sum terms in Eq. (5).
- [Algorithm 1] The pseudocode does not initialize the variable x before the inner loop, and the indexing of sim_rewards is ambiguous; please clarify the pseudocode so the algorithm is unambiguous.
- [Fig. 1] The forecast-error distribution in Fig. 1 would benefit from stating the sample size and the units of the error; without these, it is difficult to relate the magnitude to the customer demand considered in the case study.
- [Section IV] The clause 'it is unlikely that a potential CP would occur at anytime in excess of 8 to 10 consecutive hours, viz occuring outside known, afternoon peak hours' is unclear and should be rephrased.
Circularity Check
No significant circularity: the neural policy is trained on Monte Carlo rollouts and checked against an independent grid-search benchmark, so no prediction is forced by construction.
full rationale
I walked the paper's derivation chain from the model in (2)-(3) to the approximate dynamic programming formulation in Section III-A, the Monte Carlo path sampling in Algorithm 1, the neural network policy, and the numerical evaluation in Section IV. The central claim is that a neural policy trained on sampled rollouts achieves near-optimal expected revenue for a small consumer facing coincident peak charges. This claim is not circular: the training labels generated by Algorithm 1 are estimates of expected reward under the model, but the neural network is an independent function approximator; it is not fitted to the grid-search optimum and then renamed as a prediction. The validation against an exhaustive grid search in Fig. 4 is an external comparison to the ADP sampling procedure, not an input to it. The evaluation on the same stochastic simulator used for training is an internal-consistency check, not a circular reduction, because no parameter is fitted to the reported performance metric itself. The only self-citation, [8], is used to attribute the naive baseline strategy in Section II-B; that baseline is defined directly by equation (4) and is not load-bearing for the paper's main result. There is no imported uniqueness theorem, no ansatz smuggled in via citation, and no known empirical pattern renamed as a new result. The strongest concern raised by a skeptical reader is that Algorithm 1's random sampling of future actions may bias the training labels away from the true optimal Q-function, but that is a correctness or bias issue, not a circularity issue under the standards of this review. I therefore find no circular step and assign a score of 0.
Assumptions & free parameters
free parameters (5)
- C (number of Monte Carlo simulations per candidate action) =
100
- Neural network hidden layer size =
4 (single hidden layer, sigmoid)
- Ramping limit delta =
0.3
- CP charge rate pi_cp =
0.6 * T * g_bar(x)
- Revenue function forms g1, g2 =
g1=2 log(1+x^2), g2=1.386*x^(1/4)
assumptions (5)
- domain assumption System load forecast errors are independent across time periods given the forecast values.
- domain assumption The probability distribution of future system loads S_t is known exactly and can be sampled in Algorithm 1.
- domain assumption A small customer's own consumption x_t does not influence the system load S_t (exogeneity).
- domain assumption Revenue function g is concave and increasing.
- ad hoc to paper Random uniform sampling of future actions in Algorithm 1 produces a valid estimator for ranking candidate actions.
Cite this review
Pith. "Pith review of Mitigation of Coincident Peak Charges via Approximate Dynamic Programming." pith.science (2026). https://pith.science/paper/4AE54RK6
@misc{pith2026190800685,
  author       = {Pith},
  title        = {Pith review of: Mitigation of Coincident Peak Charges via Approximate Dynamic Programming},
  year         = {2026},
  howpublished = {\url{https://pith.science/paper/4AE54RK6}},
  note         = {Machine review of arXiv:1908.00685}
}
read the original abstract
A significant portion of a consumer's annual electrical costs can be made up of coincident peak charges: a transmission surcharge for power consumed when the entire system is at peak demand. This charge occurs only a few times annually, but with per-MW prices orders of magnitudes higher than non-peak times. While predicting the moment of peak demand charges over the course of the entire billing period is possible, optimal cost mitigation strategies based on these predictions have not been explored. In this paper we cast coincident peak cost mitigation as an optimization problem and analyze conditions for optimal and near-optimal policies for mitigation. For small consumers we use approximate dynamic programming to first show the existence of a near-optimal policy and second train a neural policy for curtailing coincident peak charges when subject to ramping constraints.
Figures

Figures from the paper (3 more)

Reference graph
Works this paper leans on
-
[1]
A review on peak load shaving strategies,
Moslem Uddin, Mohd Fakhizan Romlie, Mohd Faris Abdullah, Syahi- rah Abd Halim, Tan Chia Kwang, et al., “A review on peak load shaving strategies,” Renewable and Sustainable Energy Reviews , vol. 82, pp. 3323–3332, 2018
work page 2018
-
[2]
Electrical reliability council of texas, four coincident peak calculations,
ERCOT, “Electrical reliability council of texas, four coincident peak calculations,” http://www.ercot.com/mktinfo/data_ agg/4cp, 2018, Accessed: 2018-06
work page 2018
-
[3]
City of fort collins utilies, 2018 rates for large commerical consumers,
Fort Collins PUD, “City of fort collins utilies, 2018 rates for large commerical consumers,” https://www.fcgov. com/utilities/img/site_specific/uploads/Large_ Commercial_2018_Rates_Brochure1.pdf, 2018, Accessed: 2018-06
work page 2018
-
[4]
Zhenhua Liu, Adam Wierman, Yuan Chen, Benjamin Razon, and Niangjun Chen, “Data center demand response: Avoiding the coinci- dent peak via workload shifting and local generation,” Performance Evaluation, vol. 70, no. 10, pp. 770–791, 2013
work page 2013
-
[5]
Stakeholder comments review tac structure straw proposal,
Silicon Valley Power, “Stakeholder comments review tac structure straw proposal,” https://www.caiso.com/Documents/ SVPComments- ReviewTransmissionAccessChargeStructure- StrawProposal.pdf, 2018
work page 2018
-
[6]
Jay Zarnikau and Dan Thal, “The response of large industrial energy consumers to four coincident peak (4cp) transmission charges in the texas (ercot) market,” Utilities Policy, vol. 26, pp. 1–6, 2013
work page 2013
-
[7]
Electrical reliability council of texas, long term load forecast,
ERCOT, “Electrical reliability council of texas, long term load forecast,” http://www.ercot.com/gridinfo/load/ forecast/2017, 2018, Accessed: 2018-06
work page 2017
-
[8]
Coincident peak prediction using a feed-forward neural network,
Chase P Dowling, Daniel Kirschen, and Baosen Zhang, “Coincident peak prediction using a feed-forward neural network,” in 2018 IEEE Global Conference on Signal and Information Processing (GlobalSIP) . IEEE, 2018, pp. 912–916
work page 2018
Show all 19 references
-
[9]
Industrial customer response to wholesale prices in the restructured texas electricity market,
Jay Zarnikau, Greg Landreth, Ian Hallett, and Subal C Kumbhakar, “Industrial customer response to wholesale prices in the restructured texas electricity market,” Energy, vol. 32, no. 9, pp. 1715–1723, 2007
2007
-
[10]
Opportunities and challenges for data center demand response,
Adam Wierman, Zhenhua Liu, Iris Liu, and Hamed Mohsenian-Rad, “Opportunities and challenges for data center demand response,” in International Green Computing Conference . IEEE, 2014, pp. 1–10
2014
-
[11]
Leveraging energy storage to optimize data center electricity cost in emerging power markets,
Yuanyuan Shi, Bolun Xu, Baosen Zhang, and Di Wang, “Leveraging energy storage to optimize data center electricity cost in emerging power markets,” in Proceedings of the Seventh International Confer- ence on Future Energy Systems . ACM, 2016, p. 18
2016
-
[12]
Data center power cost optimization via workload modulation,
Cheng Wang, Bhuvan Urgaonkar, Qian Wang, George Kesidis, and Anand Sivasubramaniam, “Data center power cost optimization via workload modulation,” in Proceedings of the 2013 IEEE/ACM 6th International Conference on Utility and Cloud Computing . IEEE Computer Society, 2013, pp. 260–263
2013
-
[13]
Daniel S Kirschen and Goran Strbac, Fundamentals of power system economics, John Wiley & Sons, 2018
2018
-
[14]
Incentive design and utility learning via energy disaggregation,
Lillian J Ratliff, Roy Dong, Henrik Ohlsson, and S Shankar Sastry, “Incentive design and utility learning via energy disaggregation,”IF AC Proceedings V olumes, vol. 47, no. 3, pp. 3158–3163, 2014
2014
-
[15]
Load forecasting,
Eugene A Feinberg and Dora Genethliou, “Load forecasting,” in Applied mathematics for restructured electric power systems , pp. 269–
-
[16]
403, John Wiley & Sons, 2007
Rafal Weron, Modeling and forecasting electricity loads and prices: A statistical approach , vol. 403, John Wiley & Sons, 2007
2007
-
[17]
2, John Wiley & Sons, 2004
Jennie Si, Andrew G Barto, Warren B Powell, and Don Wunsch, Handbook of learning and approximate dynamic programming , vol. 2, John Wiley & Sons, 2004
2004
-
[18]
5, Athena Scientific Belmont, MA, 1996
Dimitri P Bertsekas and John N Tsitsiklis, Neuro-dynamic program- ming, vol. 5, Athena Scientific Belmont, MA, 1996
1996
-
[19]
Adaptive dynamic programming: An introduction,
Fei-Yue Wang, Huaguang Zhang, Derong Liu, et al., “Adaptive dynamic programming: An introduction,” 2009
2009
Reviewed August 14, 2026 · model on record in the stance chip above.
Discussion (0). Continue with ORCID to comment.