REVIEW 3 major objections 5 minor 37 references
Inference of visual field test performance from OCT volumes using deep learning
T0 review · 3 major / 5 minor · reviewed 2026-08-14 · deepseek-v4-flash
Pith's one-line read A 3D CNN estimates visual field indices from one raw OCT volume with 0.88 correlation.
desk verdict Plausible internal result with a real statistical hole: the p<0.01 superiority claim is not supported as described, and the VFI RMSE of 12 undercuts the 'accurate' language. read the letter →
The pith
A machine-rendered reading of the paper's core claim, the machinery that carries it, and where it could break.
The reading
What carries the argument
The central object is a five-layer 3D convolutional neural network with batch normalization, spatial dropout, global average pooling, and a tanh regression head, applied to raw OCT volumes down-sampled to 64x64x128 voxels. The global average pooling layer both produces the regression output and supports class activation maps. The comparison machinery is a set of classical regressors, led by a random forest, trained on the 22 optic nerve head features extracted by the OCT scanner, such as peripapillary retinal nerve fiber layer thickness at clock-hours and quadrants, cup-to-disc ratios, and cup volume.
What would settle it
Take a new dataset in which each OCT volume is acquired within one day of its visual field test and retrain and evaluate the same CNN; if the test-fold Pearson correlation falls to the 0.74 random-forest level or below, the reported 0.88 is an artifact of temporal mismatch rather than genuine structure-function inference.
Extended reading notes
Core claim
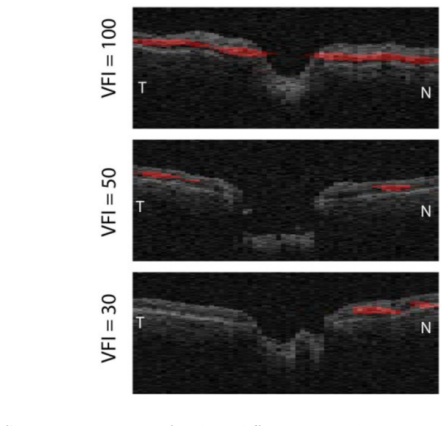
The paper reports that aggregate functional status in glaucoma can be read directly from structure: a 3D CNN regresses VFI and MD from a single raw OCT volume. On optic nerve head scans it achieves a Pearson correlation of 0.88 for both VFI and MD, and on macula scans 0.86 and 0.85 respectively, all above the best classical baseline. The paper also notes that this 0.88 matches the retest variability of visual field tests, suggesting the network is operating near the noise ceiling of its training labels. Class activation maps show the network concentrating on the ganglion cell and inner plexiform layers, with more focal attention in eyes with greater vision loss.
Load-bearing premise
The paper assumes each OCT volume and its paired visual field measurement describe the same disease state at essentially the same time, but it does not report the time interval between the two tests.
Editorial extensions
If this is right
- When the model is trained on optic nerve head scans, inferred VFI and MD both reach a Pearson correlation of 0.88, which the paper notes is close to the retest variability of visual field tests.
- Macula scans support nearly the same accuracy (VFI 0.86, MD 0.85), so the approach does not depend on a particular scan location.
- Because the CNN operates on raw down-sampled volumes, it avoids layer segmentation and nine-field registration that earlier threshold-estimation methods require.
- The 3D CNN is clearly more accurate than every classical regressor trained on the 22 standard segmentation-based OCT features, whose best VFI correlation is 0.74 (random forest).
- Class activation maps show the network attending to the ganglion cell and inner plexiform layers, with more focal attention in eyes with greater vision loss.
Reading between the lines
- Inference: if the OCT and visual field measurements in this dataset were typically acquired weeks or months apart, the reported 0.88 correlation would overstate the true structure-function accuracy, and a same-day paired dataset should be collected to measure the gap.
- Inference: matching the 0.88 retest ceiling suggests further gains will come less from bigger networks than from more reliable functional endpoints or from longitudinal models that pool multiple perimetry sessions.
- Inference: the class activation map pattern can be turned into a testable prediction: masking the highlighted GCIPL regions should degrade VFI inference much more than masking other retinal layers.
- Inference: combining optic nerve head and macula volumes, which the paper says it did not evaluate, is the most direct route to seeing whether 0.88 is a ceiling or just a single-scan limit.
Signed reviews
Editorial analysis
A structured set of objections, weighed in public.
Referee Report
Summary. The manuscript proposes a 3D convolutional neural network that regresses the glaucoma severity metrics Visual Field Index (VFI) and Mean Deviation (MD) directly from raw OCT volumes of the optic nerve head or macula, and compares it with ten classical machine-learning regressors trained on 22 segmentation-based OCT features. Using 4155 OCT/VFT pairs from 579 patients with patient-wise 5-fold cross-validation, the authors report a test Pearson correlation of 0.88 ± 0.029 for VFI on ONH scans versus 0.74 ± 0.090 for the best classical baseline (a random forest), and claim the difference is significant (p < 0.01). They additionally report MD results, RMSE values, and class activation maps. The central claim is that aggregate visual field measurements can be inferred from a single raw OCT volume more accurately than from hand-crafted OCT features.
Significance. If the reported results hold, the work is a useful empirical contribution: it demonstrates that regression of global VFT indices from raw OCT is feasible, avoids explicit layer segmentation and registration, and the use of patient-wise folds addresses a common leakage problem. The comparison against classical baselines on the same data is informative, and the discussion of the VFT retest upper bound (r ≈ 0.88) provides sensible context. The paper's strengths include a clinically relevant question, a moderately sized real-world dataset, and transparent reporting of fold-level means and standard deviations. However, the statistical evidence for the headline 'significantly higher' claim is incomplete, and the cross-validation protocol is described ambiguously; these issues must be resolved before the comparative claim can be accepted at face value.
major comments (3)
- [Section 3, Tables 2 and 3, Abstract] The claim that the CNN's PC of 0.88 is 'significantly higher' (p < 0.01) than the random forest's 0.74 is not supported by any statistical test described in the manuscript. The data contain 4155 scan-VFT pairs from only 579 patients (about 7 visits per patient), and although the authors state that folds are patient-wise, the paper does not report how the p-value was computed. A paired test over five fold-level correlations would have n = 5 and requires the covariance of the fold-level differences, which is not reported; pooling all test scans would inflate the effective sample size because of within-patient correlation in both OCT structure and VFI/MD trajectories. Please report a cluster-robust test or a patient-level bootstrap, or remove the significance claim. The same issue applies to the statement that the macula PC of 0.86 is 'still significantly higher' and to the claim in Section 3 that there is no significant difference between VFI and MD for the same region.
- [Section 2.2 and Sections 2.3/2.4] The description of the data split is internally inconsistent. Section 2.2 states that the data set was divided into an 80% training, 10% validation, and 10% test split, while Sections 2.3 and 2.4 report all results as 5-fold cross-validation with means and standard deviations over five test folds. Under a standard 5-fold protocol the test portion would be 20% of the data per fold (with validation carved from the training portion), whereas the stated 80/10/10 split implies a single test set. Please specify exactly how the five folds were constructed, whether the five test folds are disjoint at the patient level, and how validation data were created within each fold. If the test folds are not disjoint, the reported fold-level standard deviations and any fold-based significance tests are not valid.
- [Section 2.2] The temporal alignment between each OCT volume and its 'corresponding' visual field test is not specified. If the OCT and VFT were not acquired at the same visit, glaucoma progression between the two acquisitions would add uncorrelated noise to the structure-function relationship and would attenuate the achievable correlation; if they were acquired at the same visit, this should be stated explicitly. Please report the time window between OCT and VFT acquisition (e.g., same visit, or median and range in days) and discuss how the interval affects the interpretation of the reported Pearson correlations.
minor comments (5)
- [Section 2.1, Eq. (1)] The RMSE formula is incorrect as printed: it should be RMSE = sqrt((1/n) * sum_i (x_i - y_i)^2). The current expression omits the division by n inside the square root and includes an extra leading factor of 1/n. Please correct the equation and confirm that the RMSE values in Table 3 were computed with the correct formula.
- [Tables 1 and 2] There are several typographical errors: Table 1's heading 'VIF' should be 'VFI', Table 2's 'Person Correlation' should be 'Pearson Correlation', and the text contains 'aquired', 'Similarily', 'metricies', and 'An method'. These should be corrected.
- [Section 3, Figure 2] The scatter plot reports PC = 0.93 on the entire data set, including training and validation samples. The text explains this, but the figure and caption should label it clearly as a whole-data correlation, not a test-set performance measure, to avoid misleading readers.
- [Section 3.1] The class activation maps (CAMs) are said to be computed following Zhou et al., but the standard CAM formulation is defined for classification networks with a score before softmax. Since the proposed network is a regressor with a tanh output, please describe how the CAMs were computed for the regression setting and whether the highlighted regions were validated quantitatively.
- [Sections 2.3 and 2.4] The classical baselines underwent hyperparameter tuning via 100 random samples per training fold, while the CNN appears to use a fixed architecture and training schedule. Please state whether the CNN hyperparameters were also tuned on the validation set or whether the comparison is between a tuned classical pipeline and a fixed CNN architecture; this context affects how the performance gap should be interpreted.
Circularity Check
No circularity: the predicted targets are independent perimetric measurements, and the central claim rests on held-out test performance.
full rationale
The paper's target variables, VFI and MD, are measured by visual field testing on a Zeiss Meditec Model 750 perimeter, which is independent of the OCT volumes used as inputs. The CNN is trained by supervised regression against these perimetric labels and evaluated on test folds that are separated by patient, so the reported Pearson correlations are empirical out-of-sample results rather than quantities defined by the model's construction. The classical machine learning baselines are trained on 22 standard Cirrus OCT segmentation features, and the comparison is a direct empirical benchmark, not an algebraic identity. The self-citations present in the paper are to the network architecture in reference [31] and to the preprocessing library in reference [36]; these are implementation-level borrowings and do not carry the paper's central claim, which is supported by the independently measured labels and held-out evaluation. The discussion cites Abramoff et al. as an external upper bound on achievable accuracy, and that comparison does not reduce the paper's result to its own inputs. Concerns about the statistical test for the p<0.01 superiority claim are about experimental design and inference validity, not about circularity: treating correlated repeated measurements as independent would inflate significance, but it does not make the prediction equivalent to its training input by construction. No self-definitional, fitted-input, or citation-forced step is present in the derivation chain, so the correct circularity score is 0.
Assumptions & free parameters
free parameters (3)
- Input downsampling resolution =
64x64x128 voxels
- CNN architecture hyperparameters =
5 conv layers, 32 filters, kernels 7-5-3-3-3, strides 2-1-1-1-1, spatial dropout 0.2
- Training schedule =
NAdam, learning rate 1e-4, 300 epochs, early stopping on validation PC
assumptions (4)
- domain assumption OCT and VFT measurements labeled as corresponding are temporally aligned so structural damage at scan time matches functional loss at test time.
- domain assumption The 22 Cirrus segmentation features are a fair representative of classical non-deep OCT-based glaucoma features for the comparison.
- domain assumption VFI and MD, despite high inter-correlation (r=-0.96) and known VFT test-retest variability, are valid continuous regression targets.
- standard math Patient-wise train/validation/test splitting removes patient-level leakage and gives unbiased performance estimates.
Cite this review
Pith. "Pith review of Inference of visual field test performance from OCT volumes using deep learning." pith.science (2026). https://pith.science/paper/GUOMA54J
@misc{pith2026190801428,
  author       = {Pith},
  title        = {Pith review of: Inference of visual field test performance from OCT volumes using deep learning},
  year         = {2026},
  howpublished = {\url{https://pith.science/paper/GUOMA54J}},
  note         = {Machine review of arXiv:1908.01428}
}
abstract
Visual field tests (VFT) are pivotal for glaucoma diagnosis and conducted regularly to monitor disease progression. Here we address the question to what degree aggregate VFT measurements such as Visual Field Index (VFI) and Mean Deviation (MD) can be inferred from Optical Coherence Tomography (OCT) scans of the Optic Nerve Head (ONH) or the macula. Accurate inference of VFT measurements from OCT could reduce examination time and cost. We propose a novel 3D Convolutional Neural Network (CNN) for this task and compare its accuracy with classical machine learning (ML) algorithms trained on common, segmentation-based OCT, features employed for glaucoma diagnostics. Peak accuracies were achieved on ONH scans when inferring VFI with a Pearson Correlation (PC) of 0.88$\pm$0.035 for the CNN and a significantly lower (p $<$ 0.01) PC of 0.74$\pm$0.090 for the best performing, classical ML algorithm - a Random Forest regressor. Estimation of MD was equally accurate with a PC of 0.88$\pm$0.023 on ONH scans for the CNN.
Figures


Reference graph
Works this paper leans on
- [1]
-
[2]
D. C. Broadway, Visual field testing for glaucoma–a practical guide, Com- munity eye health 25 (79-80) (2012) 66
work page 2012
-
[3]
J. Ho, S. Ameen, L. Crawley, E. Normando, M. F. Cordeiro, P. Bloom, F. Ahmed, Key predictors of visual field test reliability, Investigative Oph- thalmology & Visual Science 54 (15) (2013) 2632–2632. 9
work page 2013
-
[4]
M. Peracha, B. Hughes, J. Tannir, R. Momi, A. Goyal, M. Juzych, C. Kim, M. McQueen, A. Eby, F. Fatima, Assessing the reliability of humphrey visual field testing in an urban population, Investigative Ophthalmology & Visual Science 54 (15) (2013) 3920–3920
work page 2013
-
[5]
R. Longmuir, K. Woodward, C. Doyle, C. Johnson, M. Wall, Improvement in visual field performance in patient with glaucoma: The variability in perimetry study, Investigative Ophthalmology & Visual Science 50 (13) (2009) 2234–2234
work page 2009
-
[6]
A. Viswanathan, D. Crabb, A. McNaught, M. Westcott, D. Kamal, D. Garway-Heath, F. Fitzke, R. Hitchings, Interobserver agreement on visual field progression in glaucoma: a comparison of methods, British Journal of Ophthalmology 87 (6) (2003) 726–730
work page 2003
- [7]
-
[8]
F. A. Medeiros, L. M. Zangwill, L. M. Alencar, C. Bowd, P. A. Sample, R. Susanna, R. N. Weinreb, Detection of glaucoma progression with stra- tus oct retinal nerve fiber layer, optic nerve head, and macular thickness measurements, Investigative ophthalmology & visual science 50 (12) (2009) 5741–5748
work page 2009
Show all 37 references
-
[9]
K. A. Lucy, G. Wollstein, Structural and functional evaluations for the early detection of glaucoma, Expert review of ophthalmology 11 (5) (2016) 367–376
2016
-
[10]
R. S. Harwerth, H. A. Quigley, Visual field defects and retinal ganglion cell losses in patients with glaucoma, Archives of ophthalmology 124 (6) (2006) 853–859
2006
-
[11]
M. T. Leite, L. M. Zangwill, R. N. Weinreb, H. L. Rao, L. M. Alencar, F. A. Medeiros, Structure-function relationships using the cirrus spectral domain optical coherence tomograph and standard automated perimetry, Journal of glaucoma 21 (1) (2012) 49
2012
-
[12]
D. C. Hood, A. S. Raza, Method for comparing visual field defects to local rnfl and rgc damage seen on frequency domain oct in patients with glaucoma., Biomedical optics express 2 (5) (2011) 1097–1105
2011
-
[13]
A. S. Raza, J. Cho, C. G. de Moraes, M. Wang, X. Zhang, R. H. Kardon, J. M. Liebmann, R. Ritch, D. C. Hood, Retinal ganglion cell layer thickness and local visual field sensitivity in glaucoma, Archives of ophthalmology 129 (12) (2011) 1529–1536. 10
2011
-
[14]
Sugimoto, H
K. Sugimoto, H. Murata, H. Hirasawa, M. Aihara, C. Mayama, R. Asaoka, Cross-sectional study: Does combining optical coherence tomography mea- surements using the random forestdecision tree classifier improve the pre- diction of the presence of perimetric deterioration in glauco...
2013
-
[15]
Bogunovi´ c, Y
H. Bogunovi´ c, Y. H. Kwon, A. Rashid, K. Lee, D. B. Critser, M. K. Garvin, M. Sonka, M. D. Abramoff, Relationships of retinal structure and humphrey 24-2 visual field thresholds in patients with glaucoma, Investigative oph- thalmology & visual science 56 (1) (2015) 259–271
2015
-
[16]
M. D. Abramoff, H. Bogunovic, Y. H. Kwon, B. Critser, M. K. Garvin, M. Sonka, Repeatability of automated oct-based 24-2 visual threshold es- timationin patients with glaucoma, Investigative Ophthalmology & Visual Science 56 (7) (2015) 1696–1696
2015
-
[17]
Z. Guo, Y. H. Kwon, K. Lee, K. Wang, A. Wahle, W. L. Alward, J. H. Fingert, D. I. Bettis, C. A. Johnson, M. K. Garvin, et al., Optical coher- ence tomography analysis based prediction of humphrey 24-2 visual field thresholds in patients with glaucoma, Investigative ophthalmolog...
2017
-
[18]
Krizhevsky, I
A. Krizhevsky, I. Sutskever, G. E. Hinton, Imagenet classification with deep convolutional neural networks, in: Advances in neural information processing systems, 2012, pp. 1097–1105
2012
-
[19]
LeCun, Y
Y. LeCun, Y. Bengio, G. Hinton, Deep learning, nature 521 (7553) (2015) 436
2015
-
[20]
S. J. Russell, P. Norvig, Artificial Intelligence - A Modern Approach (3. internat. ed.), Pearson Education, 2010
2010
-
[21]
Bengtsson, A
B. Bengtsson, A. Heijl, A visual field index for calculation of glaucoma rate of progression, American journal of ophthalmology 145 (2) (2008) 343–353
2008
-
[22]
Mansuri, A
G. Mansuri, A. Chawala, S. Gandhi, R. Raval, N. Trivedi, GUJARAT Medical Journal 69 (1) (2014) 93–95
2014
-
[23]
Yaqub, Visual fields interpretation in glaucoma: a focus on static auto- mated perimetry, Community eye health 25 (79-80) (2012) 1
M. Yaqub, Visual fields interpretation in glaucoma: a focus on static auto- mated perimetry, Community eye health 25 (79-80) (2012) 1
2012
-
[24]
J. S. Kim, H. Ishikawa, K. R. Sung, J. Xu, G. Wollstein, R. A. Bilonick, M. L. Gabriele, L. Kagemann, J. S. Duker, J. G. Fujimoto, et al., Reti- nal nerve fibre layer thickness measurement reproducibility improved with spectral domain optical coherence tomography, British Journ...
2009
-
[25]
Pedregosa, G
F. Pedregosa, G. Varoquaux, A. Gramfort, V. Michel, B. Thirion, O. Grisel, M. Blondel, P. Prettenhofer, R. Weiss, V. Dubourg, et al., Scikit-learn: Machine learning in python, Journal of machine learning research 12 (Oct) (2011) 2825–2830. 11
2011
-
[26]
Scholkopf, A
B. Scholkopf, A. J. Smola, Learning with kernels: support vector machines, regularization, optimization, and beyond, MIT press, 2001
2001
-
[27]
D. E. Rumelhart, G. E. Hinton, R. J. Williams, Learning representations by back-propagating errors, Nature 323 (6088) (1986) 533
1986
-
[28]
Breiman, Random forests, Machine learning 45 (1) (2001) 5–32
L. Breiman, Random forests, Machine learning 45 (1) (2001) 5–32
2001
-
[29]
Natekin, A
A. Natekin, A. Knoll, Gradient boosting machines, a tutorial, Frontiers in neurorobotics 7 (2013) 21
2013
-
[30]
Geurts, D
P. Geurts, D. Ernst, L. Wehenkel, Extremely randomized trees, Machine learning 63 (1) (2006) 3–42
2006
-
[31]
Maetschke, B
S. Maetschke, B. Antony, H. Ishikawa, R. Garvani, A feature agnostic ap- proach for glaucoma detection in oct volumes, PLoS ONE 14 (7) (2019) e0219126
2019
-
[32]
Tompson, R
J. Tompson, R. Goroshin, A. Jain, Y. LeCun, C. Bregler, Efficient object localization using convolutional networks, in: Proceedings of the IEEE Conference on Computer Vision and Pattern Recognition, 2015, pp. 648– 656
2015
-
[33]
Chollet, Keras (2017)
F. Chollet, Keras (2017). URL https://github.com/fchollet/keras
2017
-
[34]
B. Zhou, A. Khosla, `A. Lapedriza, A. Oliva, A. Torralba, Learning deep features for discriminative localization, CoRR abs/1512.04150. arXiv: 1512.04150
-
[35]
Abadi, A
M. Abadi, A. Agarwal, P. Barham, E. Brevdo, Z. Chen, C. Citro, G. S. Corrado, A. Davis, J. Dean, M. Devin, et al., Tensorflow: Large-scale machine learning on heterogeneous distributed systems, arXiv preprint arXiv:1603.04467
-
[36]
Maetschke, R
S. Maetschke, R. B. Tennakoon, C. Vecchiola, R. Garnavi, nuts-flow/ml: data pre-processing for deep learning, CoRR abs/1708.06046. arXiv:1708. 06046
-
[37]
Zhang, M
H. Zhang, M. Cisse, Y. N. Dauphin, D. Lopez-Paz, mixup: Beyond empir- ical risk minimization, arXiv preprint arXiv:1710.09412. 12
Reviewed August 14, 2026 · model on record in the stance chip above.
Discussion (0). Continue with ORCID to comment.