REVIEW 4 major objections 6 minor 55 references
Precise Estimation of Renal Vascular Dominant Regions Using Spatially Aware Fully Convolutional Networks, Tensor-Cut and Voronoi Diagrams
T0 review · 4 major / 6 minor · reviewed 2026-08-14 · deepseek-v4-flash
Pith's one-line read Fully automatic kidney-territory mapping reaches 80% Dice.
desk verdict A coherent fully automatic pipeline for renal vascular dominant-region estimation, with solid kidney-segmentation experiments, but the headline 80% accuracy for dominant regions is consistency with a Voronoi simulation, not anatomical truth. read the letter →
The pith
A machine-rendered reading of the paper's core claim, the machinery that carries it, and where it could break.
The reading
What carries the argument
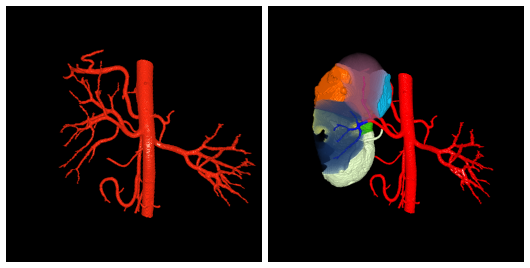
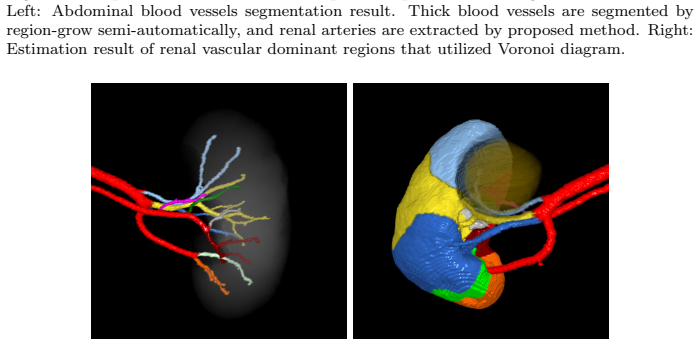
The load-bearing mechanism is the Voronoi diagram of Eq. 5: each branch $B_i$ of the renal artery tree acts as a set of seed points, and every voxel $x$ inside the segmented kidney $X_v$ is assigned to the branch whose minimal Euclidean distance $d(x,B_i)$ is smallest, so each Voronoi cell is the simulated perfusion territory of one artery branch. Around that core, the pipeline uses two supporting mechanisms: a spatially aware 3D fully convolutional network that concatenates normalized $x,y,z$ coordinate channels to the bottom feature map so cropped sub-volumes retain their position in the whole CT, and tensor-cut, which models the Hessian matrix as a second-order tensor, measures tensor distances with an affine-invariant Riemannian metric, and solves a first-order Markov random field by graph cut. The Voronoi construction is also applied at different branch-clustering levels to produce coarse-to-fine partitions.
What would settle it
Compare the predicted dominant regions against observed perfusion in the same patients, for example using CT perfusion maps, selective arterial dye injection, or indocyanine-green fluorescence during surgery. If the boundaries between territories shift by more than a clinically meaningful margin, such as more than 10 mm, in a substantial fraction of cases, the Euclidean-distance Voronoi assumption, not the segmentations, would be the thing that fails.
Extended reading notes
Core claim
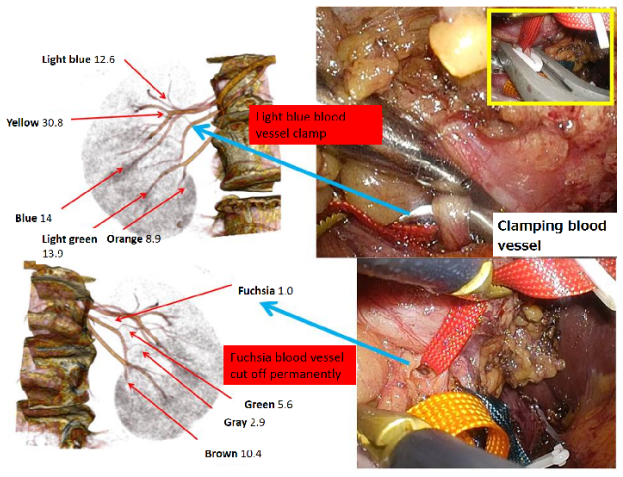
The paper claims that renal vascular dominant regions can be estimated precisely and automatically by treating each renal artery branch as a seed set in a Voronoi diagram computed inside the segmented kidney. For the inputs to that diagram, the paper argues that a 3D U-Net with normalized x, y, z coordinate maps concatenated at the bottom feature map segments kidneys more accurately than plain U-Net or V-Net baselines, and that the tensor-cut method segments tiny, low-contrast renal arteries where Hessian vesselness filters fail. The reported end-to-end accuracy is a Dice coefficient of 80% for dominant regions, measured against simulated ground truth built by applying the same Voronoi rule to manual kidney and artery segmentations. The paper also reports that in one clinical case, surgeons used the predicted dominant regions to clamp two of four tumor-adjacent arteries, with slight residual bleeding in two regions that were not clamped.
Load-bearing premise
The scoring of the 80% accuracy uses simulated ground truth: the same Voronoi algorithm is applied to manual kidney and artery segmentations, so the Dice number measures the cost of automatic segmentation errors, and the whole approach presupposes that Euclidean-distance Voronoi zones are an acceptable model of real blood perfusion territories.
Editorial extensions
If this is right
- Selective clamping in partial nephrectomy could be planned from a CT alone, without manual kidney or artery tracing.
- Adding the coordinate map to a 3D U-Net appears to suppress false positives in kidney segmentation compared with the same network without it.
- Tiny, low-contrast artery branches that Hessian vesselness filters miss can be recovered by tensor-cut, which is required for fine Voronoi partitions.
- Multi-level Voronoi partitions give surgeons both coarse and fine views of which artery branches dominate the region around a tumor.
- The reported Dice of 80% sets a quantitative baseline that future end-to-end pipelines for vascular-territory estimation can be compared against.
Reading between the lines
- A testable prediction is that most of the remaining 20% Dice gap is attributable to under-segmentation of small artery branches near the tumor, not to the Voronoi rule itself; the paper's Cases 2 and 6 point in that direction.
- The method could be extended to other organs with segmental blood supply, such as liver segments or lung lobes, by swapping the FCN and vessel segmentation but keeping the Voronoi partition.
- Because the reference is algorithmically generated, the clinical value of the 80% number depends on a future perfusion-based validation; without that, the metric should be read as an error-propagation study, not an anatomical accuracy claim.
- An immediate extension would be to use the contact-area ratio, such as region 5 with 78% of tumor-adjacent area in the example, as the clamping priority score rather than region volume.
Signed reviews
Editorial analysis
A structured set of objections, weighed in public.
Referee Report
Summary. The paper proposes a fully automatic pipeline for estimating renal vascular dominant regions from contrast-enhanced CT: a spatially aware 3D U-Net-like FCN for kidney segmentation, a tensor-based graph-cut method (tensor-cut) for renal artery segmentation, and a Voronoi diagram (Eq. 5) to partition the kidney into regions attributed to each arterial branch. Kidney segmentation is evaluated on 27 cases with 8-fold cross-validation against U-Net and V-Net baselines. Dominant-region estimation is evaluated in 8 cases by comparing automatic Voronoi partitions against a simulated ground truth built by applying the same Voronoi algorithm to manual kidney and artery segmentations. A single clinical selective-clamping case is presented as an illustration. The authors position the work as a preliminary study and explicitly note that anatomical ground truth for dominant regions is unavailable.
Significance. If the claims were fully supported, the pipeline would be a useful engineering contribution to pre-surgical planning for partial nephrectomy: it is fully automatic, combines well-established components in a sensible way, and the kidney segmentation evaluation is solid for a small in-house dataset, including 8-fold CV and comparisons to two standard baselines. The paper is honest about several limitations, including the lack of anatomical ground truth for dominant regions and the absence of a new quantitative evaluation of renal artery segmentation. However, the central claim of 'precise estimation' of dominant regions is not established by the reported experiments. The 80% Dice figure measures agreement with a simulated reference produced by the same algorithm applied to manual inputs, not accuracy against any independent or anatomical standard. The paper's value currently lies in demonstrating pipeline feasibility, not in validating the Voronoi model as a representation of true perfusion territories.
major comments (4)
- [Abstract & §4.1, Table 1] The abstract claims 'The accuracy of kidney segmentation in 27 cases with 8-fold cross validation reached a Dice score of 95%.' Table 1 reports for the proposed method a left-kidney median DSC of 87.3% and a right-kidney median DSC of 94.7%, with no reported overall 95% figure. The abstract's number appears to be the right-kidney median or a misreading; please state a single overall metric or report all values consistently, and adjust the abstract to match the results table.
- [§3 and §4.2] Section 3 states that 'we did not perform a quantitative evaluation for blood vessel segmentation in this work,' and §4.2 only cites the previous tensor-cut paper (Ref. [44]) for a centerline overlap exceeding 80%. Because the Voronoi partition in Eq. (5) depends directly on the arterial branches B, the accuracy of the dominant-region estimation is load-bearing on a component that is not re-measured on the evaluation cases. The manuscript should either re-measure renal artery segmentation on the 8 cases used for dominant-region evaluation or explicitly quantify how segmentation errors propagate to the Voronoi cells.
- [§4.3, Eq. (5), and Table 2] The quantitative evaluation of dominant-region estimation is circular for validating the Voronoi model. As stated in §4.3, the 'simulated ground truth' is generated by applying the same Voronoi algorithm (Eq. 5) to manual kidney and artery segmentations. Consequently, the Dice coefficients in Table 2 measure how closely the automatic pipeline reproduces the manual inputs under the Euclidean-distance Voronoi rule, not whether that rule corresponds to true renal perfusion territories. The text should be rewritten so that the 80% Dice is presented as a reproducibility/consistency measure, not as 'estimation accuracy.' The single surgical case in §5.3 is anecdotal and does not provide quantitative validation.
- [§5.2 and Fig. 16] The discussion acknowledges under-segmented renal arteries in Cases 2 and 6 and states that for Case 6 'the blue region is over-estimated.' Since these under-segmented arteries directly alter the Voronoi partition, the claim in the same section that 'the renal artery segmentation performance for dominant-region estimation is acceptable in this work' is not supported by quantitative evidence. Please report the effect of segmentation errors on the dominant-region Dice for these and other cases, or temper the claim to reflect that the impact was assessed only qualitatively.
minor comments (6)
- [§5.1] The sentence 'As shown in Table 2, compared with other U-Net-like architectures...' appears to refer to Table 1, which contains the method comparison; Table 2 reports dominant-region Dice. Please correct the reference.
- [Table 3] The column header 'Area(mm3)' should be 'Area(mm²)' since the contact area is a two-dimensional quantity.
- [§2.3, Eq. (5)] The Voronoi partition depends on a branch-clustering level, but the paper does not specify how this level is selected for the reported experiments. Since different clustering levels produce different partitions (Fig. 6), please state the criterion used in the evaluation and whether any parameters were tuned.
- [Fig. 8 and Fig. 9] The captions state 'Validation DSC' for both pre-training and fine-tuning curves and for the comparison plot. In the comparison plot, it would help to state explicitly that the curves show median validation DSC across the 8 folds, with quartile bands, in the caption rather than only in the main text.
- [§2.2] The sentence 'The vesselness enhancement filter transfers the higher dimensional tensor to 1-dimensional Euclidean measurement V' is grammatically unclear and should be rephrased.
- [Table 2] The layout of Table 2 is hard to read: the 'Kidney #' and 'Regions #' rows are typeset as a single line in the supplied text, and the parentheses for Dice values are unbalanced. Please reformat the table so each row is clearly separated.
Circularity Check
The dominant-region Dice score is evaluated against a simulated ground truth generated by the same Voronoi algorithm, so the 80% figure measures segmentation consistency rather than anatomical precision; the central 'precise estimation' claim is therefore partially circular.
-
self definitional
[Section 2.3, Eq. 5; Section 4.3, Table 2]
"Ci ={x∈ Xv|d(x,Bi)≤d(x,Bj)}, for all i≠j ... Since we cannot get the anatomical ground truth of the renal dominant regions, we used the ground truth of both kidney and renal artery to calculate a simulated ground truth of the dominant regions."
Both the automatic dominant-region estimate and the 'simulated ground truth' are produced by the same Voronoi construction (Eq. 5): the former from FCN/tensor-cut segmentations, the latter from manual kidney and artery segmentations. Therefore the Dice score in Table 2 is the Dice between the outputs of an identical mapping applied to two different segmentations. If the automatic segmentation were perfect, the score would be 100% by construction regardless of whether Euclidean-distance Voronoi zones correspond to true blood-perfusion territories. The evaluation cannot validate the Voronoi model as anatomy; the paper's central claim of 'precise estimation' rests on this definitional comparison plus one anecdotal surgical case.
-
self citation load bearing
[Section 3 (Materials); Section 5.2 (Renal artery segmentation)]
"Since we directly used our previous method for blood vessel segmentation, we did not perform a quantitative evaluation for blood vessel segmentation in this work. Detailed experimental results are available in our previous work [44]. ... As demonstrated in our previous work [44], the CO coef. of renal artery segmentation exceeded 80% and extracted about five generations of dichotomous branching that maximally extended from the abdominal aorta. This performance completely meets physician requirements for PN surgical planning."
The renal artery segmentation is a critical geometric input to the Voronoi partition (Eq. 5), and the paper explicitly declines to re-measure its accuracy in this study, importing the 80% centerline-overlap figure from the authors' own prior work. The 'precise estimation' claim therefore relies on a self-citation for the performance of a load-bearing component without independent verification on the evaluation cases. Section 5.2 itself acknowledges under-segmented arteries in Cases 2 and 6 that directly change dominant-region estimates, so the imported accuracy is not merely decorative; it carries the argument that the pipeline meets physician requirements.
full rationale
The kidney-segmentation component is not circular: it is a standard supervised FCN trained on manual labels, evaluated by 8-fold cross-validation, and compared against U-Net and V-Net baselines as well as external methods, giving independent content. The tensor-cut artery segmentation is imported from prior work by the same authors without re-evaluation, which is a self-citation gap but not an equation-level reduction. The principal circularity is in the validation of the final dominant-region estimate: the reference 'ground truth' is generated by applying the same Voronoi algorithm (Eq. 5) to manual kidney and artery segmentations, so the reported 80% Dice is essentially a segmentation-consistency score under the model. The paper is transparent about this limitation ('we cannot get the anatomical ground truth'), and the Voronoi model is openly presented as 'a simple simulation,' but the headline claim of precise estimation is not independently validated. The single clinical case in Section 5.3 is anecdotal and not a quantitative ground truth. Overall, the central derivation of the pipeline is empirical rather than circular, yet the key accuracy claim for dominant regions reduces by construction to an agreement between automatic and manual segmentations under the same algorithm, warranting a partial-circularity score of 6.
Assumptions & free parameters
free parameters (3)
- Tensor-cut weighting parameters lambda_I, lambda_T, omega =
not reported; inherited from prior work [44]
- Number of largest connected components kept in kidney post-processing =
2
- Voronoi branch clustering level =
user-selected per partition
assumptions (4)
- domain assumption Voronoi diagram over Euclidean distance to artery branches models renal vascular dominant regions.
- domain assumption Hessian matrices treated as second-order tensors, measured with an affine-invariant Riemannian metric, capture tubular vessel geometry.
- ad hoc to paper The simulated dominant-region ground truth, generated by applying the same Voronoi algorithm to manual kidney and artery segmentations, is a valid reference for evaluation.
- standard math Graph-cut optimization of the MRF energy in Eq. 4 reaches a meaningful optimum.
Cite this review
Pith. "Pith review of Precise Estimation of Renal Vascular Dominant Regions Using Spatially Aware Fully Convolutional Networks, Tensor-Cut and Voronoi Diagrams." pith.science (2026). https://pith.science/paper/VNUOEXIQ
@misc{pith2026190801543,
  author       = {Pith},
  title        = {Pith review of: Precise Estimation of Renal Vascular Dominant Regions Using Spatially Aware Fully Convolutional Networks, Tensor-Cut and Voronoi Diagrams},
  year         = {2026},
  howpublished = {\url{https://pith.science/paper/VNUOEXIQ}},
  note         = {Machine review of arXiv:1908.01543}
}
read the original abstract
This paper presents a new approach for precisely estimating the renal vascular dominant region using a Voronoi diagram. To provide computer-assisted diagnostics for the pre-surgical simulation of partial nephrectomy surgery, we must obtain information on the renal arteries and the renal vascular dominant regions. We propose a fully automatic segmentation method that combines a neural network and tensor-based graph-cut methods to precisely extract the kidney and renal arteries. First, we use a convolutional neural network to localize the kidney regions and extract tiny renal arteries with a tensor-based graph-cut method. Then we generate a Voronoi diagram to estimate the renal vascular dominant regions based on the segmented kidney and renal arteries. The accuracy of kidney segmentation in 27 cases with 8-fold cross validation reached a Dice score of 95%. The accuracy of renal artery segmentation in 8 cases obtained a centerline overlap ratio of 80%. Each partition region corresponds to a renal vascular dominant region. The final dominant-region estimation accuracy achieved a Dice coefficient of 80%. A clinical application showed the potential of our proposed estimation approach in a real clinical surgical environment. Further validation using large-scale database is our future work.
Figures


Figures from the paper (14 more)






Reference graph
Works this paper leans on
-
[44]
Wang, C., Oda, M., Hayashi, Y., Yoshino, Y., Yamamoto, T., Frangi, A. F., Mori, K., 2016. Tensor-based graph-cut in riemannian metric space and its application to renal artery segmentation. In: International Conference on Medical Image Computing and Computer-Assisted Intervention. Springer, pp. 353–361
work page 2016
-
[1]
Akbari, H., Fei, B., 2012. Automatic 3D segmentation of the kidney in mr images using wavelet feature extraction and probability shape model. In: Medical Imaging 2012: Image Processing. Vol. 8314. International Society for Optics and Photonics, p. 83143D
work page 2012
-
[2]
Spatial PixelCNN: Generating Images from Patches
Akoury, N., Nguyen, A., 2017. Spatial pixelcnn: Generating images from patches. arXiv preprint arXiv:1712.00714
work page Pith review arXiv 2017
-
[3]
Graph cuts and efficient nd image seg- mentation
Boykov, Y., Funka-Lea, G., 2006. Graph cuts and efficient nd image seg- mentation. International journal of computer vision 70 (2), 109–131
work page 2006
-
[4]
Boykov, Y. Y., Jolly, M.-P., 2001. Interactive graph cuts for optimal bound- ary & region segmentation of objects in nd images. In: Computer Vision,
work page 2001
-
[5]
Convolutional Patch Networks with Spatial Prior for Road Detection and Urban Scene Understanding
Brust, C.-A., Sickert, S., Simon, M., Rodner, E., Denzler, J., 2015. Con- volutional patch networks with spatial prior for road detection and urban scene understanding. arXiv preprint arXiv:1502.06344
work page Pith review arXiv 2015
-
[6]
S., Hwang, J.-N., Yuan, C., 2017
Chen, L., Xie, Y., Sun, J., Balu, N., Mossa-Basha, M., Pimentel, K., Hatsukami, T. S., Hwang, J.-N., Yuan, C., 2017. 3D intracranial artery segmentation using a convolutional autoencoder. In: Bioinformatics and Biomedicine (BIBM), 2017 IEEE International Conference on. IEEE, pp. 714–717
work page 2017
-
[7]
Christ, P. F., Elshaer, M. E. A., Ettlinger, F., Tatavarty, S., Bickel, M., Bilic, P., Rempfler, M., Armbruster, M., Hofmann, F., DAnastasi, M., et al., 2016. Automatic liver and lesion segmentation in CT using cas- caded fully convolutional neural networks and 3D conditional random fields. 20 In: International Conference on Medical Image Computing and Comp...
work page 2016
Show all 55 references
-
[8]
Multi-organ segmentation based on spatially-divided probabilistic atlas from 3D abdominal CT images
Chu, C., Oda, M., Kitasaka, T., Misawa, K., Fujiwara, M., Hayashi, Y., Nimura, Y., Rueckert, D., Mori, K., 2013. Multi-organ segmentation based on spatially-divided probabilistic atlas from 3D abdominal CT images. In: International Conference on Medical Image Computing and Com...
2013
-
[9]
S., Brox, T., Ronneberger, O.,
C ¸ i¸ cek,¨O., Abdulkadir, A., Lienkamp, S. S., Brox, T., Ronneberger, O.,
-
[10]
D., Mory, B., Ardon, R., 2012
Cuingnet, R., Prevost, R., Lesage, D., Cohen, L. D., Mory, B., Ardon, R., 2012. Automatic detection and segmentation of kidneys in 3D CT im- ages using random forests. In: International Conference on Medical Image Computing and Computer-Assisted Intervention. Springer, pp. 66–74
2012
-
[11]
F., Niessen, W
Frangi, A. F., Niessen, W. J., Vincken, K. L., Viergever, M. A., 1998. Multiscale vessel enhancement filtering. In: International Conference on Medical Image Computing and Computer-Assisted Intervention. Springer, pp. 130–137
1998
-
[12]
J., Joskowicz, L., Sosna, J., 2010
Freiman, M., Kronman, A., Esses, S. J., Joskowicz, L., Sosna, J., 2010. Non- parametric iterative model constraint graph min-cut for automatic kidney segmentation. In: International Conference on Medical Image Computing and Computer-Assisted Intervention. Springer, pp. 73–80
2010
-
[13]
Multiple hypothesis template tracking of small 3D vessel structures
Friman, O., Hindennach, M., K¨ uhnel, C., Peitgen, H.-O., 2010. Multiple hypothesis template tracking of small 3D vessel structures. Medical image analysis 14 (2), 160–171
2010
-
[14]
Fu, H., Xu, Y., Lin, S., Wong, D. W. K., Liu, J., 2016. Deepvessel: Reti- nal vessel segmentation via deep learning and conditional random field. In: International Conference on Medical Image Computing and Computer- Assisted Intervention. Springer, pp. 132–139
2016
-
[15]
Fu, H., Xu, Y., Wong, D. W. K., Liu, J., 2016. Retinal vessel segmentation via deep learning network and fully-connected conditional random fields. In: Biomedical Imaging (ISBI), 2016 IEEE 13th International Symposium on. IEEE, pp. 698–701
2016
-
[16]
P., Xu, Z., George, K., Lu, L., Summers, R
Harrison, A. P., Xu, Z., George, K., Lu, L., Summers, R. M., Mollura, D. J., 2017. Progressive and multi-path holistically nested neural networks for pathological lung segmentation from CT images. In: International Con- ference on Medical Image Computing and Computer-Assisted ...
2017
-
[17]
Brain tumor segmentation with deep neural networks
Havaei, M., Davy, A., Warde-Farley, D., Biard, A., Courville, A., Bengio, Y., Pal, C., Jodoin, P.-M., Larochelle, H., 2017. Brain tumor segmentation with deep neural networks. Medical image analysis 35, 18–31
2017
-
[18]
Statistical shape models for 3D medical image segmentation: a review
Heimann, T., Meinzer, H.-P., 2009. Statistical shape models for 3D medical image segmentation: a review. Medical image analysis 13 (4), 543–563
2009
-
[19]
Feasibility and accuracy of computational robot-assisted partial nephrectomy planning by virtual partial nephrectomy analysis
Isotani, S., Shimoyama, H., Yokota, I., China, T., Hisasue, S.-i., Ide, H., Muto, S., Yamaguchi, R., Ukimura, O., Horie, S., 2015. Feasibility and accuracy of computational robot-assisted partial nephrectomy planning by virtual partial nephrectomy analysis. International Journ...
2015
-
[20]
F., Simpson, J
Kamnitsas, K., Ledig, C., Newcombe, V. F., Simpson, J. P., Kane, A. D., Menon, D. K., Rueckert, D., Glocker, B., 2017. Efficient multi-scale 3D CNN with fully connected CRF for accurate brain lesion segmentation. Medical image analysis 36, 61–78
2017
-
[21]
Komai, Y., Sakai, Y., Gotohda, N., Kobayashi, T., Kawakami, S., Saito, N.,
-
[22]
Computer-aided kidney seg- mentation on abdominal CT images
Lin, D.-T., Lei, C.-C., Hung, S.-W., 2006. Computer-aided kidney seg- mentation on abdominal CT images. IEEE transactions on information technology in biomedicine 10 (1), 59–65
2006
-
[23]
Segmenting retinal blood vessels with deep neural networks
Liskowski, P., Krawiec, K., 2016. Segmenting retinal blood vessels with deep neural networks. IEEE transactions on medical imaging 35 (11), 2369– 2380
2016
-
[24]
A learning- based automatic clinical organ segmentation in medical images
Liu, X., Samarabandu, J., Li, S., Ross, I., Garvin, G., 2007. A learning- based automatic clinical organ segmentation in medical images. In: Medical Imaging 2007: Image Processing. Vol. 6512. International Society for Optics and Photonics, p. 65120Y
2007
-
[25]
3D segmentation in the clinic: A grand challenge ii-coronary artery tracking
Metz, C., Schaap, M., van Walsum, T., van der Giessen, A., Weustink, A., Mollet, N., Krestin, G., Niessen, W., 2008. 3D segmentation in the clinic: A grand challenge ii-coronary artery tracking. Insight Journal 1 (5), 6
2008
-
[26]
V-net: Fully convolu- tional neural networks for volumetric medical image segmentation
Milletari, F., Navab, N., Ahmadi, S.-A., 2016. V-net: Fully convolu- tional neural networks for volumetric medical image segmentation. In: 2016 Fourth International Conference on 3D Vision (3DV). IEEE, pp. 565–571
2016
-
[27]
A differential geometric approach to the geometric mean of symmetric positive-definite matrices
Moakher, M., 2005. A differential geometric approach to the geometric mean of symmetric positive-definite matrices. SIAM Journal on Matrix Analysis and Applications 26 (3), 735–747. 22
2005
-
[28]
G., Hori, M., Summers, R
Okada, T., Linguraru, M. G., Hori, M., Summers, R. M., Tomiyama, N., Sato, Y., 2015. Abdominal multi-organ segmentation from CT images us- ing conditional shape–location and unsupervised intensity priors. Medical image analysis 26 (1), 1–18
2015
-
[29]
A riemannian framework for tensor computing
Pennec, X., Fillard, P., Ayache, N., 2006. A riemannian framework for tensor computing. International Journal of computer vision 66 (1), 41–66
2006
-
[30]
U-net: Convolutional net- works for biomedical image segmentation
Ronneberger, O., Fischer, P., Brox, T., 2015. U-net: Convolutional net- works for biomedical image segmentation. In: International Conference on Medical image computing and computer-assisted intervention. Springer, pp. 234–241
2015
-
[31]
Towards dense volumetric pancreas segmentation in CT using 3d fully convolutional networks
Roth, H., Oda, M., Shimizu, N., Oda, H., Hayashi, Y., Kitasaka, T., Fuji- wara, M., Misawa, K., Mori, K., 2018. Towards dense volumetric pancreas segmentation in CT using 3d fully convolutional networks. In: Medical Imaging 2018: Image Processing. Vol. 10574. International Soc...
2018
-
[32]
R., Lu, L., Lay, N., Harrison, A
Roth, H. R., Lu, L., Lay, N., Harrison, A. P., Farag, A., Sohn, A., Summers, R. M., 2018. Spatial aggregation of holistically-nested convolutional neural networks for automated pancreas localization and segmentation. Medical image analysis 45, 94–107
2018
-
[33]
R., Oda, H., Zhou, X., Shimizu, N., Yang, Y., Hayashi, Y., Oda, M., Fujiwara, M., Misawa, K., Mori, K., 2018
Roth, H. R., Oda, H., Zhou, X., Shimizu, N., Yang, Y., Hayashi, Y., Oda, M., Fujiwara, M., Misawa, K., Mori, K., 2018. An application of cascaded 3D fully convolutional networks for medical image segmentation. Comput- erized Medical Imaging and Graphics
2018
-
[34]
R., Shen, C., Oda, H., Oda, M., Hayashi, Y., Misawa, K., Mori, K., 2018
Roth, H. R., Shen, C., Oda, H., Oda, M., Hayashi, Y., Misawa, K., Mori, K., 2018. Deep learning and its application to medical image segmentation. Medical Imaging Technology 36 (2), 63–71
2018
-
[35]
Grabcut: Interactive fore- ground extraction using iterated graph cuts
Rother, C., Kolmogorov, V., Blake, A., 2004. Grabcut: Interactive fore- ground extraction using iterated graph cuts. In: ACM transactions on graphics (TOG). Vol. 23. ACM, pp. 309–314
2004
-
[36]
Three-dimensional multi-scale line filter for segmentation and visualization of curvilinear structures in medical images
Sato, Y., Nakajima, S., Shiraga, N., Atsumi, H., Yoshida, S., Koller, T., Gerig, G., Kikinis, R., 1998. Three-dimensional multi-scale line filter for segmentation and visualization of curvilinear structures in medical images. Medical image analysis 2 (2), 143–168
1998
-
[37]
Laparoscopic partial nephrectomy with segmental renal artery clamping: technique and clinical outcomes
Shao, P., Qin, C., Yin, C., Meng, X., Ju, X., Li, J., Lv, Q., Zhang, W., Xu, Z., 2011. Laparoscopic partial nephrectomy with segmental renal artery clamping: technique and clinical outcomes. European urology 59 (5), 849– 855
2011
-
[38]
Precise segmental renal artery clamping un- der the guidance of dual-source computed tomography angiography during laparoscopic partial nephrectomy
Shao, P., Tang, L., Li, P., Xu, Y., Qin, C., Cao, Q., Ju, X., Meng, X., Lv, Q., Li, J., et al., 2012. Precise segmental renal artery clamping un- der the guidance of dual-source computed tomography angiography during laparoscopic partial nephrectomy. European urology 62 (6), 1...
2012
-
[39]
R., Oda, H., Oda, M., Hayashi, Y., Misawa, K., Mori, K., 2018
Shen, C., Roth, H. R., Oda, H., Oda, M., Hayashi, Y., Misawa, K., Mori, K., 2018. On the influence of dice loss function in multi-class organ seg- mentation of abdominal CT using 3d fully convolutional networks. arXiv preprint arXiv:1801.05912
2018 arXiv
-
[40]
Kidney seg- mentation in CT data using hybrid level-set method with ellipsoidal shape constraints
Skalski, A., Heryan, K., Jakubowski, J., Drewniak, T., 2017. Kidney seg- mentation in CT data using hybrid level-set method with ellipsoidal shape constraints. Metrology and Measurement Systems 24 (1), 101–112
2017
-
[41]
J., 2016
Thong, W., Kadoury, S., Pich´ e, N., Pal, C. J., 2016. Convolutional net- works for kidney segmentation in contrast-enhanced CT scans. Computer Methods in Biomechanics and Biomedical Engineering: Imaging & Visual- ization, 1–6
2016
-
[42]
S., 2012
Ukimura, O., Nakamoto, M., Gill, I. S., 2012. Three-dimensional recon- struction of renovascular-tumor anatomy to facilitate zero-ischemia partial nephrectomy. European urology 61 (1), 211–217
2012
-
[43]
Precise renal artery segmentation for estimation of renal vascular dominant regions
Wang, C., Kagajo, M., Nakamura, Y., Oda, M., Yoshino, Y., Yamamoto, T., Mori, K., 2016. Precise renal artery segmentation for estimation of renal vascular dominant regions. In: Medical Imaging 2016: Image Processing. Vol. 9784. International Society for Optics and Photonics, p. 97842M
2016
-
[45]
M., Leiner, T., Viergever, M
Wolterink, J. M., Leiner, T., Viergever, M. A., Iˇ sgum, I., 2015. Automatic coronary calcium scoring in cardiac ct angiography using convolutional neu- ral networks. In: International Conference on Medical Image Computing and Computer-Assisted Intervention. Springer, pp. 589–596
2015
-
[46]
Computational analysis of recovery from is- chemic damage to kidney function undergoing robotic partial nephrectomy for renal tumor
Yoshino, Y., Yamamoto, T., Funahashi, Y., Oda, M., Kagajo, M., Wang, C., Mori, K., Gotoh, M., 2015. Computational analysis of recovery from is- chemic damage to kidney function undergoing robotic partial nephrectomy for renal tumor. In: Supplement of Journal of Endourology. pp...
2015
-
[47]
Deep learning based automatic segmentation of pathological kidney in CT: Local versus global image context
Zheng, Y., Liu, D., Georgescu, B., Xu, D., Comaniciu, D., 2017. Deep learning based automatic segmentation of pathological kidney in CT: Local versus global image context. In: Deep Learning and Convolutional Neural Networks for Medical Image Computing. Springer, pp. 241–255
2017
-
[48]
Constructing a probabilistic model for automated liver region segmentation using non-contrast x-ray torso ct images
Zhou, X., Kitagawa, T., Hara, T., Fujita, H., Zhang, X., Yokoyama, R., Kondo, H., Kanematsu, M., Hoshi, H., 2006. Constructing a probabilistic model for automated liver region segmentation using non-contrast x-ray torso ct images. In: International Conference on Medical Image ...
2006
-
[49]
Anatomynet: Deep learning for fast and fully automated whole-volume segmentation of head and neck anatomy
Zhu, W., Huang, Y., Zeng, L., Chen, X., Liu, Y., Qian, Z., Du, N., Fan, W., Xie, X., 2018. Anatomynet: Deep learning for fast and fully automated whole-volume segmentation of head and neck anatomy. Medical physics
2018
-
[50]
Deeplung: Deep 3d dual path nets for automated pulmonary nodule detection and classification
Zhu, W., Liu, C., Fan, W., Xie, X., 2018. Deeplung: Deep 3d dual path nets for automated pulmonary nodule detection and classification. In: 2018 IEEE Winter Conference on Applications of Computer Vision (WACV). IEEE, pp. 673–681
2018
-
[51]
S., Huang, Y., Xie, X., 2018
Zhu, W., Vang, Y. S., Huang, Y., Xie, X., 2018. Deepem: Deep 3d convnets with em for weakly supervised pulmonary nodule detection. In: Interna- tional Conference on Medical Image Computing and Computer-Assisted Intervention. Springer, pp. 812–820
2018
-
[52]
D., Hager, G
Zhu, W., Xiang, X., Tran, T. D., Hager, G. D., Xie, X., 2018. Adversarial deep structured nets for mass segmentation from mammograms. In: 2018 IEEE 15th International Symposium on Biomedical Imaging (ISBI 2018). IEEE, pp. 847–850. 25
2018
-
[2001]
Proceedings
ICCV 2001. Proceedings. Eighth IEEE International Conference on. Vol. 1. IEEE, pp. 105–112
2001
-
[2014]
Urology 83 (2), 500–507
A novel 3-dimensional image analysis system for case-specific kidney anatomy and surgical simulation to facilitate clampless partial nephrec- tomy. Urology 83 (2), 500–507
-
[2016]
In: International Conference on Medical Image Computing and Computer-Assisted Intervention
3D u-net: learning dense volumetric segmentation from sparse an- notation. In: International Conference on Medical Image Computing and Computer-Assisted Intervention. Springer, pp. 424–432
Reviewed August 14, 2026 · model on record in the stance chip above.
Discussion (0). Continue with ORCID to comment.