REVIEW 3 major objections 7 minor 49 references
Knee menisci segmentation and relaxometry of 3D ultrashort echo time (UTE) cones MR imaging using attention U-Net with transfer learning
T0 review · 3 major / 7 minor · reviewed 2026-08-14 · deepseek-v4-flash
Pith's one-line read A 2D attention U-Net with transfer learning can outline knee menisci on 3D UTE cones MR images at the same level as two human radiologists, and the automatic outlines yield T1, T1ρ, and T2* values statistically indistinguishable from…
desk verdict A useful, credible feasibility study for automatic menisci segmentation and relaxometry in 3D UTE cones MRI, but the 'equivalence' claim is statistically overconfident and should be tightened before publication. read the letter →
The pith
A machine-rendered reading of the paper's core claim, the machinery that carries it, and where it could break.
The reading
What carries the argument
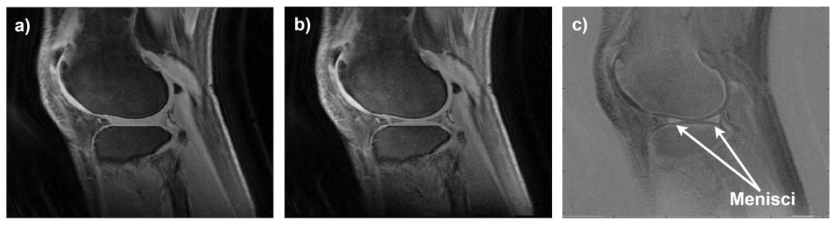
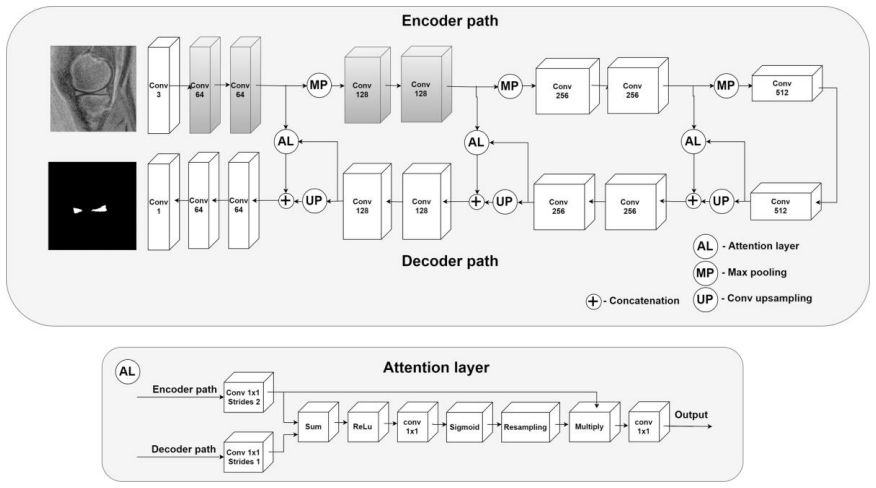
The central object is a 2D attention U-Net, a U-Net whose skip connections are gated by attention layers so that encoder features far from the initial meniscus localization are suppressed. The first two encoder blocks are initialized from the corresponding blocks of a deep network pretrained on a large natural-image dataset, and a trainable 1×1 convolution block in front converts the normalized grayscale subtracted UTE images into the three-channel input format that pretrained network expects. Training uses a Dice-score loss directly, which suits the menisci's small pixel fraction. The resulting segmentations are fed into nonlinear least-squares fitting of the UTE cones data to compute T1, T1ρ, and T2* maps.
What would settle it
Build a consensus ground truth for the same or new UTE cones volumes from a panel of several radiologists (or from higher-resolution histology where available), then compute Dice scores and relaxometry differences for the two CNNs against that consensus. If the CNNs' Dice against consensus falls well below the radiologists' average Dice against consensus, or if the automatic T1, T1ρ, or T2* values differ from the consensus-based values by more than the 1.95%, 2.56-3.03%, and 4.59-6.15% average relative errors reported here, the equivalence claim would fail.
Extended reading notes
Core claim
The central claim is that a 2D attention U-Net with transfer learning, trained on radiologist-outlined regions of interest in subtracted AdiabT1ρ-weighted UTE cones slices, segments the knee menisci at a level equivalent to inter-observer variability. The models achieved Dice scores of 0.860 and 0.833 against the radiologist whose outlines trained them, while the two radiologists' manual segmentations agreed with each other at 0.820. The average T1, T1ρ, and T2* relaxation times computed from the automatic segmentations were not statistically different from those computed from manual outlines, with Pearson correlations between 0.90 and 0.97 and average relative errors of roughly 2% for T1, 3% for T1ρ, and 5-6% for T2*. The two CNNs also agreed with each other more strongly than the radiologists did (Dice 0.882 versus 0.820), which the paper reads as evidence that the learned segmentations are driven by image content rather than by annotator idiosyncrasy.
Load-bearing premise
The load-bearing premise is that the two radiologists' manually drawn outlines, made on subjectively selected subtracted images, are the correct meniscus boundary; because those outlines are both the training labels and the evaluation standard, any systematic error in them is learned and reproduced by the network.
Editorial extensions
If this is right
- Automatic segmentations can replace manual tracing for meniscal T1, T1ρ, and T2* relaxometry on similar 3T UTE cones scans without statistically changing the average values.
- The segmentation accuracy is at or above radiologist inter-observer level: a model trained on one radiologist's outlines agrees with the other radiologist about as well as the two radiologists agree with each other.
- The CNNs produced no false positives on slices without menisci, supporting use of the model in fully automated slice-filtering and quantification pipelines.
- The method could enable efficient extraction of osteoarthritis-relevant biomarkers, including relaxation times and ROI areas, from whole-knee UTE acquisitions.
- Because the two CNNs agreed with each other more strongly than the two radiologists did, automatic segmentations may reduce inter-observer variability in meniscal measurements.
Reading between the lines
- A further step, not tested here, would be to evaluate the same models against a consensus ground truth from many annotators; since the two CNNs agree more than the radiologists do, the models may be averaging out annotator noise, but any systematic boundary bias shared by the radiologists would still be baked into both the labels and the evaluation.
- The error pattern—smallest for T1 and largest for T2*—suggests T2* relaxometry is the most sensitive to boundary disagreements; an OA study using T2* as its primary biomarker may need tighter segmentation agreement than this pipeline currently guarantees on atypical slices.
- Because the method is trained on 2D slices, through-plane meniscus curvature is ignored; a likely extension, consistent with earlier work the paper cites, is to add a 3D refinement network, and a testable prediction is that this would push held-out Dice further above the radiologist baseline.
- The same automatic masks could also be used for morphometric measures such as meniscal volume or extrusion on UTE data, an extension the paper mentions as future whole-joint work but does not validate here.
Signed reviews
Editorial analysis
A structured set of objections, weighed in public.
Referee Report
Summary. This paper presents a transfer-learning-based 2D attention U-Net for segmenting knee menisci in 3D UTE cones MR images and for computing T1, T1ρ, and T2* from the resulting masks. Sixty-one subjects were imaged; two radiologists independently outlined menisci on subtracted AdiabT1ρ-weighted images; the data were split into training/validation/test sets (36/10/15), with 191 test slices from 15 menisci. The authors report Dice scores of 0.860 and 0.833 for the two CNNs versus radiologist inter-observer Dice of 0.820, high correlations (0.90-0.97) between manual and automatic relaxometry values, and no statistically significant differences in average T1, T1ρ, and T2* between manual and automatic segmentations. They conclude that the automatic segmentations are equivalent to the radiologists' inter-observer variability and can replace manual ROIs for meniscal relaxometry.
Significance. If the claims hold, this would be a useful practical result: it is, to the authors' knowledge, the first demonstration of fully automatic meniscal segmentation and relaxometry on 3D UTE cones data. The study has real strengths: a held-out test set, validation-based model selection, two independent radiologist reference standards, separate reporting for medial and lateral menisci, AUC and false-positive checks, and Bland-Altman plots. The segmentation performance (Dice around 0.83-0.86) is in line with prior knee menisci segmentation work. However, the load-bearing statistical claims of equivalence in both segmentation and relaxometry are not supported by the analyses as reported.
major comments (3)
- [Methods, 'Model development and performance evaluation'; Results, Table 2] The claim of 'no associated differences' in T1, T1ρ, and T2* rests on t-tests applied to 191 2D images derived from only 15 test menisci. Adjacent 2D slices from the same meniscus are spatially correlated, so the effective sample size is at most 15, not 191. With n=15, the tests are underpowered, and a non-significant p-value does not establish equivalence. The manuscript should report per-meniscus or per-subject averages and use an equivalence test (e.g., TOST with a pre-specified margin) or a linear mixed-effects model that accounts for within-meniscus correlation. Without this, the abstract's statement that there were 'no associated differences' is not warranted.
- [Results, Table 1; Discussion] The segmentation-equivalence claim ('equivalent to the inter-observer variability of two radiologists') is based on descriptive comparison of average Dice scores (0.860 and 0.833 versus 0.820). No formal non-inferiority or equivalence test is reported for the CNN-versus-radiologist agreement relative to the radiologist inter-observer agreement. The only significance test mentioned for Dice (CNN1 vs CNN2 0.882 versus Rad1 vs Rad2 0.820, p<0.001) is not described in the Methods and appears to treat per-slice Dice values as independent. A formal test, or a clearly worded claim of 'comparable' rather than 'equivalent', is needed.
- [Methods, 'UTE imaging and data collection'; Discussion] The reference standard is based on ROIs drawn on subtracted AdiabT1ρ-weighted images selected 'based on subjective assessment', and the Discussion acknowledges the selection was 'strictly subjective'. Because the CNNs are trained to reproduce these specific ROIs, systematic errors in the manual outlines or in the choice of subtraction image are propagated into the automatic segmentations and the relaxometry comparison. The authors should assess the sensitivity of their conclusions to the choice of subtraction image, or at minimum discuss how this limitation bears on the claim that the method can 'replace' manual ROIs.
minor comments (7)
- [Abstract and Conclusions] The phrase 'no associated differences' should be rephrased to 'no statistically significant differences were detected' unless equivalence testing with a prespecified margin is provided.
- [Methods, 'Model development and performance evaluation'] The test set is described as '191 2D images from 15 menisci' while the data split describes 15 subjects; clarify whether '15 menisci' refers to 15 subjects or 15 individual menisci, and state how many medial/lateral menisci are included.
- [Table 1] There is a formatting error in the 95% CI for the CNN2 row: '0.885 0.904' is missing a dash and should read '0.885-0.904'.
- [Figure 1 caption] The caption says 'NIR value' but the text uses 'NAFP' (number of adiabatic full passages); please correct this inconsistency.
- [Discussion] The text refers to 'cartridge compartments' where 'cartilage compartments' is intended; also, in the Methods there is a duplicated 'T1' in 'per adiabatic T1T1ρ preparation.'
- [Methods, network description] The '1D convolutional block' added in front of the VGG19 blocks is described as consisting of 1x1 convolutional filters; calling it a 1D convolutional block is confusing and should be clarified.
- [General] No code or data availability statement is provided, which limits reproducibility of the transfer-learning implementation.
Circularity Check
No significant circularity: held-out evaluation and independent relaxometry fitting keep the segmentation and relaxometry claims self-contained.
full rationale
The paper's derivation chain is a supervised segmentation study: radiologist ROIs are used to train two attention U-Nets, the trained models are applied to a held-out test set (36/10/15 subject split; 191 2D images from 15 menisci), and relaxometry values are then computed from both manual and automatic ROIs using the same UTE-Cones fitting procedure. The only fitted quantities are the CNN weights, and they are fit to training ROIs; the test-set Dice scores and relaxometry correlations are therefore not forced by construction. The relaxometry results are not an input to the CNN: T1, T1rho, and T2* are obtained by Levenberg-Marquardt fitting of UTE-Cones data within the ROIs, so agreement between manual and automatic segmentations is a post-hoc validation, not a tautology. Citations to prior work on UTE-Cones sequences and fitting equations (e.g., refs. 8, 9, 33) supply imaging methods, not the segmentation result, and no uniqueness theorem or ansatz is imported from the authors' own prior work to foreclose alternatives. The paper itself acknowledges that the image selection for ROI outlining was 'strictly subjective,' which is a ground-truth validity limitation, but it does not make the derivation circular. The statistical concern that 191 2D images from 15 menisci are treated as independent in t-tests, and that no formal equivalence test is reported, affects the strength of the 'no associated differences' claim, but this is a correctness/statistical-power issue rather than a circularity issue. Overall, the central claims are grounded in held-out data and independent fitting, so no circular step is present.
Assumptions & free parameters
free parameters (6)
- CNN weights and biases =
Trained on 36 subjects, 458 2D images augmented to 2748
- Learning rate and momentum =
0.001 and 0.9
- Batch size =
32
- Learning rate decay and early stopping =
Drop factor 0.5 every 5 epochs, patience 15 epochs
- Edge-aware contrast manipulation parameters =
Not specified
- Preprocessing crop and resizing =
Crop to 192x192, resize to 224x224
assumptions (5)
- standard math Dice score-based loss is appropriate for heavily imbalanced segmentation
- domain assumption Features from the first two VGG19 blocks trained on ImageNet transfer usefully to grayscale MR images
- domain assumption Manual ROIs by two radiologists on subtracted AdiabT1rho-weighted images are valid ground truth
- domain assumption 2D slices containing the meniscus are sufficient for relaxometry estimation
- domain assumption UTE-Cones relaxometry fitting equations from prior literature are accurate
Cite this review
Pith. "Pith review of Knee menisci segmentation and relaxometry of 3D ultrashort echo time (UTE) cones MR imaging using attention U-Net with transfer learning." pith.science (2026). https://pith.science/paper/QTW4GHLI
@misc{pith2026190801594,
  author       = {Pith},
  title        = {Pith review of: Knee menisci segmentation and relaxometry of 3D ultrashort echo time (UTE) cones MR imaging using attention U-Net with transfer learning},
  year         = {2026},
  howpublished = {\url{https://pith.science/paper/QTW4GHLI}},
  note         = {Machine review of arXiv:1908.01594}
}
abstract
The purpose of this work is to develop a deep learning-based method for knee menisci segmentation in 3D ultrashort echo time (UTE) cones magnetic resonance (MR) imaging, and to automatically determine MR relaxation times, namely the T1, T1$\rho$, and T2* parameters, which can be used to assess knee osteoarthritis (OA). Whole knee joint imaging was performed using 3D UTE cones sequences to collect data from 61 human subjects. Regions of interest (ROIs) were outlined by two experienced radiologists based on subtracted T1$\rho$-weighted MR images. Transfer learning was applied to develop 2D attention U-Net convolutional neural networks for the menisci segmentation based on each radiologist's ROIs separately. Dice scores were calculated to assess segmentation performance. Next, the T1, T1$\rho$, T2* relaxations, and ROI areas were determined for the manual and automatic segmentations, then compared.The models developed using ROIs provided by two radiologists achieved high Dice scores of 0.860 and 0.833, while the radiologists' manual segmentations achieved a Dice score of 0.820. Linear correlation coefficients for the T1, T1$\rho$, and T2* relaxations calculated using the automatic and manual segmentations ranged between 0.90 and 0.97, and there were no associated differences between the estimated average meniscal relaxation parameters. The deep learning models achieved segmentation performance equivalent to the inter-observer variability of two radiologists. The proposed deep learning-based approach can be used to efficiently generate automatic segmentations and determine meniscal relaxations times. The method has the potential to help radiologists with the assessment of meniscal diseases, such as OA.
Figures
Reference graph
Works this paper leans on
-
[1]
Osteoarthritis: a disease of the joint as an organ
Loeser RF, Goldring SR, Scanzello CR, Goldring MB. Osteoarthritis: a disease of the joint as an organ. Arthritis Rheum. 2012;64(6):1697-1707
work page 2012
-
[2]
Badlani JT, Borrero C, Golla S, Harner CD, Irrgang JJ. the Effects of Meniscus Injury on the Development of Knee Osteoarthritis: data From the Osteoarthritis Initiative. Am J Sports Med. 2013;41(6):1238-1244
work page 2013
-
[3]
Berthiaume M-J, Raynauld J-P, Martel-Pelletier J, et al. Meniscal tear and extrusion are strongly associated with progression of symptomatic knee osteoarthritis as assessed by quantitative magnetic resonance imaging. Ann Rheum Dis. 2005;64(4):556-563
work page 2005
-
[4]
Hunter DJ, Zhang YQ, Niu JB, et al. The association of meniscal pathologic changes with cartilage loss in symptomatic knee osteoarthritis. Arthritis Rheum. 2006;54(3):795-801
work page 2006
-
[5]
Baum T, Joseph GB, Karampinos DC, Jungmann PM, Link TM, Bauer JS. Cartilage and meniscal T2 relaxation time as non-invasive biomarker for knee osteoarthritis and cartilage repair procedures. Osteoarthr Cartil. 2013;21(10):1474-1484
work page 2013
-
[6]
Joseph GB, Baum T, Alizai H, et al. Baseline mean and heterogeneity of MR cartilage T2 are associated with morphologic degeneration of cartilage, meniscus, and bone marrow over 3 years - data from the Osteoarthritis Initiative. Osteoarthr Cartil. 2012;20(7):727-735
work page 2012
-
[7]
UTE imaging in the musculoskeletal system
Chang EY, Du J, Chung CB. UTE imaging in the musculoskeletal system. J Magn Reson imaging. 2015;41(4):870-883
work page 2015
-
[8]
3D adiabatic T1ρ prepared ultrashort echo time cones sequence for whole knee imaging
Ma Y-J, Carl M, Searleman A, Lu X, Chang EY, Du J. 3D adiabatic T1ρ prepared ultrashort echo time cones sequence for whole knee imaging. Magn Reson Med. 2018;80(4):1429-1439
work page 2018
Show all 49 references
-
[9]
Whole knee joint T1 values measured in vivo at 3T by combined 3D ultrashort echo time cones actual flip angle and variable flip angle methods
Ma Y-J, Zhao W, Wan L, et al. Whole knee joint T1 values measured in vivo at 3T by combined 3D ultrashort echo time cones actual flip angle and variable flip angle methods. Magn Reson Med. 2019;81(3):1634-1644
2019
-
[10]
Correlation of semiquantitative vs quantitative MRI meniscus measures in osteoarthritic knees: results from the Osteoarthritis Initiative
Blöcker K, Guermazi A, Wirth W, et al. Correlation of semiquantitative vs quantitative MRI meniscus measures in osteoarthritic knees: results from the Osteoarthritis Initiative. Skeletal Radiol. 2014;43(2):227-232
2014
-
[11]
Segmentation of joint and musculoskeletal tissue in the study of arthritis
Pedoia V, Majumdar S, Link TM. Segmentation of joint and musculoskeletal tissue in the study of arthritis. Magn Reson Mater Physics, Biol Med. 2016;29(2):207-221
2016
-
[12]
A survey on deep learning in medical image analysis
Litjens G, Kooi T, Bejnordi BE, et al. A survey on deep learning in medical image analysis. Med Image Anal. 2017;42:60-88
2017
-
[13]
U-net: Convolutional networks for biomedical image segmentation
Ronneberger O, Fischer P, Brox T. U-net: Convolutional networks for biomedical image segmentation. In: International Conference on Medical Image Computing and Computer-Assisted Intervention. 2015:234-241
2015
-
[14]
Automated segmentation of knee bone and cartilage combining statistical shape knowledge and convolutional neural networks: Data from the Osteoarthritis Initiative
Ambellan F, Tack A, Ehlke M, Zachow S. Automated segmentation of knee bone and cartilage combining statistical shape knowledge and convolutional neural networks: Data from the Osteoarthritis Initiative. Med Image Anal. 2018;52:109- 118
2018
-
[15]
Deep convolutional neural network and 3D deformable approach for tissue segmentation in musculoskeletal magnetic resonance imaging
Liu F, Zhou Z, Jang H, Samsonov A, Zhao G, Kijowski R. Deep convolutional neural network and 3D deformable approach for tissue segmentation in musculoskeletal magnetic resonance imaging. Magn Reson Med. 2018;79(4):2379- 2391
2018
-
[16]
Deep feature learning for knee cartilage segmentation using a triplanar convolutional neural network
Prasoon A, Petersen K, Igel C, Lauze F, Dam E, Nielsen M. Deep feature learning for knee cartilage segmentation using a triplanar convolutional neural network. In: International Conference on Medical Image Computing and Computer-Assisted Intervention. 2013:246-253
2013
-
[17]
Deep convolutional neural network for segmentation of knee joint anatomy
Zhou Z, Zhao G, Kijowski R, Liu F. Deep convolutional neural network for segmentation of knee joint anatomy. Magn Reson Med. 2018;80(6), 2759-2770
2018
-
[18]
Use of 2D U-Net Convolutional Neural Networks for Automated Cartilage and Meniscus Segmentation of Knee MR Imaging Data to Determine Relaxometry and Morphometry
Norman B, Pedoia V, Majumdar S. Use of 2D U-Net Convolutional Neural Networks for Automated Cartilage and Meniscus Segmentation of Knee MR Imaging Data to Determine Relaxometry and Morphometry. Radiology. 2018;288(1):177-185
2018
-
[19]
Knee menisci segmentation using convolutional neural networks: data from the Osteoarthritis Initiative
Tack A, Mukhopadhyay A, Zachow S. Knee menisci segmentation using convolutional neural networks: data from the Osteoarthritis Initiative. Osteoarthr Cartil. 2018;26(5):680-688
2018
-
[20]
Automated segmentation of the menisci from MR images
Fripp J, Bourgeat P, Engstrom C, Ourselin S, Crozier S, Salvado O. Automated segmentation of the menisci from MR images. In: IEEE International Symposium on Biomedical Imaging: From Nano to Macro. 2009:510-513
2009
-
[21]
Automated segmentation and analysis of normal and osteoarthritic knee menisci from magnetic resonance images - data from the Osteoarthritis Initiative
Paproki A, Engstrom C, Chandra SS, Neubert A, Fripp J, Crozier S. Automated segmentation and analysis of normal and osteoarthritic knee menisci from magnetic resonance images - data from the Osteoarthritis Initiative. Osteoarthr Cartil. 2014;22(9):1259-1270
2014
-
[22]
The unified extreme learning machines and discriminative random fields for automatic knee cartilage and meniscus segmentation from multi-contrast MR images
Zhang K, Lu W, Marziliano P. The unified extreme learning machines and discriminative random fields for automatic knee cartilage and meniscus segmentation from multi-contrast MR images. Mach Vis Appl. 2013;24(7):1459- 1472
2013
-
[23]
T1ρ relaxation time of the meniscus and its relationship with T1ρ of adjacent cartilage in knees with acute ACL injuries at 3 T
Bolbos RI, Link TM, Ma CB, Majumdar S, Li X. T1ρ relaxation time of the meniscus and its relationship with T1ρ of adjacent cartilage in knees with acute ACL injuries at 3 T. Osteoarthr Cartil. 2009;17(1):12-18
2009
-
[24]
Meniscal measurements of T1ρ and T2 at MR imaging in healthy subjects and patients with osteoarthritis
Rauscher I, Stahl R, Cheng J, et al. Meniscal measurements of T1ρ and T2 at MR imaging in healthy subjects and patients with osteoarthritis. Radiology. 2008;249(2):591-600
2008
-
[25]
Semi-automated segmentation to assess the lateral meniscus in normal and osteoarthritic knees
Swanson MS, Prescott JW, Best TM, et al. Semi-automated segmentation to assess the lateral meniscus in normal and osteoarthritic knees. Osteoarthr Cartil. 2010;18(3):344-353
2010
-
[26]
Ultrashort TE T1ρ (UTE T1ρ) imaging of the Achilles tendon and meniscus
Du J, Carl M, Diaz E, et al. Ultrashort TE T1ρ (UTE T1ρ) imaging of the Achilles tendon and meniscus. Magn Reson Med. 2010;64(3):834-842
2010
-
[27]
Very deep convolutional networks for large-scale image recognition
Simonyan K, Zisserman A. Very deep convolutional networks for large-scale image recognition. arXiv e‐prints. 2014
2014
-
[28]
Going deeper with convolutions
Szegedy C, Liu W, Jia Y, et al. Going deeper with convolutions. In: Proceedings of the IEEE Conference on Computer Vision and Pattern Recognition. 2015:1-9
2015
-
[29]
Imagenet: A large-scale hierarchical image database
Deng J, Dong W, Socher R, Li L-J, Li K, Fei-Fei L. Imagenet: A large-scale hierarchical image database. In: Proceedings of the IEEE Conference on Computer Vision and Pattern Recognition. 2009:248-255
2009
-
[30]
Object detectors emerge in deep scene cnns
Zhou B, Khosla A, Lapedriza A, Oliva A, Torralba A. Object detectors emerge in deep scene cnns. arXiv e‐prints. 2014
2014
-
[31]
A Deep Feature Fusion Methodology for Breast Cancer Diagnosis Demonstrated on Three Imaging Modality Datasets
Antropova N, Huynh BQ, Giger ML. A Deep Feature Fusion Methodology for Breast Cancer Diagnosis Demonstrated on Three Imaging Modality Datasets. Med Phys. 2017;44(10):5126-5171
2017
-
[32]
Training constrained deconvolutional networks for road scene semantic segmentation
Ros G, Stent S, Alcantarilla PF, Watanabe T. Training constrained deconvolutional networks for road scene semantic segmentation. arXiv e‐prints. 2016
2016
-
[33]
An algorithm for least-squares estimation of nonlinear parameters
Marquardt DW. An algorithm for least-squares estimation of nonlinear parameters. J Soc Ind Appl Math. 1963;11(2):431-441
1963
-
[34]
Elastix: a toolbox for intensity-based medical image registration
Klein S, Staring M, Murphy K, Viergever MA, Pluim JPW. Elastix: a toolbox for intensity-based medical image registration. IEEE Trans Med Imaging. 2010;29(1):196-205
2010
-
[35]
Fast parallel image registration on CPU and GPU for diagnostic classification of Alzheimer’s disease
Shamonin DP, Bron EE, Lelieveldt BPF, Smits M, Klein S, Staring M. Fast parallel image registration on CPU and GPU for diagnostic classification of Alzheimer’s disease. Front Neuroinform. 2014;7:50
2014
-
[36]
Learn to pay attention
Jetley S, Lord NA, Lee N, Torr PHS. Learn to pay attention. arXiv e‐prints. 2018
2018
-
[37]
Attention U-Net: Learning Where to Look for the Pancreas
Oktay O, Schlemper J, Folgoc L Le, et al. Attention U-Net: Learning Where to Look for the Pancreas. arXiv e‐prints. 2018
2018
-
[38]
Convolutional neural networks for medical image analysis: Full training or fine tuning? IEEE Trans Med Imaging
Tajbakhsh N, Shin JY, Gurudu SR, et al. Convolutional neural networks for medical image analysis: Full training or fine tuning? IEEE Trans Med Imaging. 2016;35(5):1299-1312
2016
-
[39]
Good practice in CNN feature transfer
Zheng L, Zhao Y, Wang S, Wang J, Tian Q. Good practice in CNN feature transfer. arXiv e‐prints. 2016
2016
-
[40]
Breast mass classification in sonography with transfer learning using a deep convolutional neural network and color conversion
Byra M, Galperin M, Ojeda-Fournier H, et al. Breast mass classification in sonography with transfer learning using a deep convolutional neural network and color conversion. Med Phys. 2019;46(2):746-755
2019
-
[41]
V-net: Fully convolutional neural networks for volumetric medical image segmentation
Milletari F, Navab N, Ahmadi S-A. V-net: Fully convolutional neural networks for volumetric medical image segmentation. In: Proceedings of the Fourth International Conference on 3D Vision. 2016:565-571
2016
-
[42]
Generalised Dice overlap as a deep learning loss function for highly unbalanced segmentations
Sudre CH, Li W, Vercauteren T, Ourselin S, Cardoso MJ. Generalised Dice overlap as a deep learning loss function for highly unbalanced segmentations. In: Deep Learning in Medical Image Analysis and Multimodal Learning for Clinical Decision Support. Springer; 2017:240-248
2017
-
[43]
Local Laplacian Filters: Edge-aware Image Processing with a Laplacian Pyramid
Paris S, Hasinoff SW, Kautz J. Local Laplacian Filters: Edge-aware Image Processing with a Laplacian Pyramid. Commun ACM. 2015;58(3):81-91
2015
-
[44]
Adam: A method for stochastic optimization
Kingma D, Ba J. Adam: A method for stochastic optimization. arXiv e‐prints. 2014
2014
-
[45]
Understanding the difficulty of training deep feedforward neural networks
Glorot X, Bengio Y. Understanding the difficulty of training deep feedforward neural networks. In: Proceedings of the Thirteenth International Conference on Artificial Intelligence and Statistics. 2010:249-256
2010
-
[46]
TensorFlow: A System for Large-Scale Machine Learning
Abadi M, Barham P, Chen J, et al. TensorFlow: A System for Large-Scale Machine Learning. In: USENIX Symposium on Operating Systems Design and Implementation. 2016:265-283
2016
-
[47]
An introduction to ROC analysis
Fawcett T. An introduction to ROC analysis. Pattern Recognit Lett. 2006;27(8):861-874
2006
-
[48]
Segmentation of knee images: a grand challenge
Heimann T, Morrison BJ, Styner MA, Niethammer M, Warfield S. Segmentation of knee images: a grand challenge. http://www.ski10.org/ski10.pdf
-
[49]
Why rankings of biomedical image analysis competitions should be interpreted with care
Maier-Hein L, Eisenmann M, Reinke A, et al. Why rankings of biomedical image analysis competitions should be interpreted with care. Nat Commun. 2018;9(1):5217. Table 1. The average Dice scores (plus median and 95% CI) calculated using the manual and automatic segmentations. Ra...
2018
Reviewed August 14, 2026 · model on record in the stance chip above.
Discussion (0). Continue with ORCID to comment.