REVIEW 4 major objections 4 minor 37 references
Stress-Plus-X (SPX) Graph Layout
T0 review · 4 major / 4 minor · reviewed 2026-08-14 · deepseek-v4-flash
Pith's one-line read SPX graph layout minimizes stress while optimizing crossings, angles, and upwardness in one cost function.
desk verdict A practical multi-criteria layout framework whose crossing-angle objective is honestly a soft surrogate, not a true minimum maximizer; worth reviewing after the claims are corrected. read the letter →
The pith
A machine-rendered reading of the paper's core claim, the machinery that carries it, and where it could break.
The reading
What carries the argument
The load-bearing object is the combined cost function $cost(C,u,\gamma,\rho) = \mathrm{stress}(C) + K \times \sum_{P} \mathrm{penalties}(C,u,\gamma,P)$, with coordinates $C$, balancing hyperparameter $K$, penalty weights in $P$, and separating-line variables $u$ and $\gamma$. Two edges $A$ and $B$ do not cross exactly when a line separates them; linear-programming duality restates this as inequalities $Au+\gamma e \geq 0$ and $Bu+(1+\gamma)e \leq 0$, and the positive parts of the violations form a per-pair penalty that is zero for non-crossing pairs. The optimizer alternates: with coordinates fixed, it solves a linear program for the best $u$ and $\gamma$ for each edge pair; with those fixed, gradient descent moves the coordinates. The crossing-angle version weights each crossing penalty by $\cos^2(\theta)$ where $\theta$ is the crossing angle, so the smallest angles dominate, and upwardness enters as constraints $y_v > y_u$ on directed edges. This machinery lets the user combine criteria simply by adding a penalty to the sum.
What would settle it
Run SPX on a graph outside the two convergence-test graphs with a fixed K and record combined cost, crossings, stress, and crossing angle over 100 iterations for all six gradient variants; the convergence assumption fails if no variant drives the cost down or if the metrics oscillate. A stronger check is to enumerate the true minimum of the combined cost on small graphs and compare it with SPX's final layout, since a consistent large gap would show the framework is not actually jointly optimizing.
Extended reading notes
Core claim
The central claim is that multiple graph layout criteria can be folded into one combined cost function together with stress, and that minimizing it by alternating a linear program with gradient descent produces drawings that are good on every criterion rather than extreme on one. The paper formalizes 'no crossing' for a pair of edges as the existence of a separating line; the violation of the resulting inequalities becomes a positive penalty, and the crossing-angle variant multiplies that penalty by $\cos^2$ of the angle between crossing edges, making tiny angles costly and also rewarding the removal of crossings. Upwardness is enforced as linear constraints on vertex heights for directed acyclic graphs. Empirically, SPX beats stress-only layouts on crossings, comes within a factor of two of dedicated crossing-angle optimizers while beating them on stress, drawing area, and neighborhood preservation, and produces upward drawings of DAGs with lower stress and area than layered baselines while matching them on crossings.
Load-bearing premise
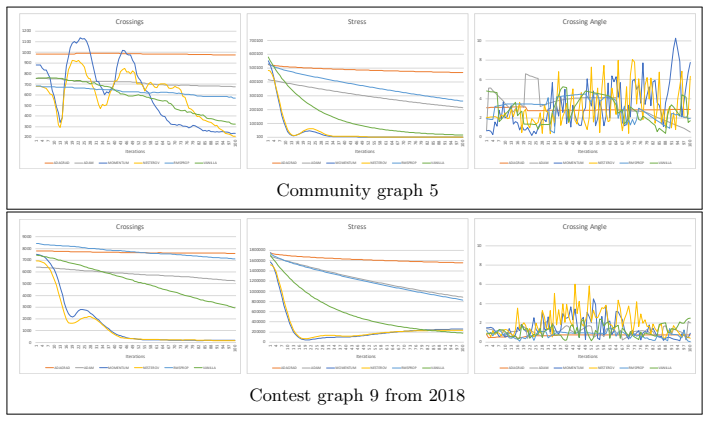
The load-bearing premise is that the alternating optimization scheme (linear programming for the separating lines, then gradient descent on coordinates) converges to a good minimum of the combined cost on every graph, but the paper demonstrates convergence on only two graphs and reports that some gradient-descent variants diverge on one of them.
Editorial extensions
If this is right
- A user can get a layout that is readable under several measures at once from a single run, instead of running separate single-criterion algorithms and choosing among extreme results.
- Adding a new readability criterion to SPX only requires writing a penalty over edge pairs and inserting it with a weight, so the framework can absorb future criteria such as resolution, area, or neighborhood preservation.
- For directed acyclic graphs, SPX is an alternative to layered drawing: it preserves upwardness while reporting lower stress and smaller drawing area than standard layered layouts.
- The hyperparameter K gives a concrete dial for the stress-versus-X trade-off, which visualization systems can expose to end users.
Reading between the lines
- The paper's convergence plots show that no single gradient variant works on all graphs; a robust version of SPX could select the variant or step schedule automatically by the combined cost, turning the current multi-start sweep into an adaptive solver.
- Because the per-edge-pair linear programs are the computational bottleneck, replacing them with a batched or barrier formulation could scale SPX from hundred-vertex graphs to the larger contest graphs it currently handles in hours.
- The cos-squared weighting mainly rewards increasing the smallest crossing angle; a soft-min over crossing angles might close the remaining gap to dedicated angle optimizers while keeping stress in the loop.
- The readability studies the paper cites motivate a direct human-subject test of whether balanced SPX drawings actually speed up graph tasks compared with extreme single-criterion drawings.
Signed reviews
Editorial analysis
A structured set of objections, weighed in public.
Referee Report
Summary. The paper introduces Stress-Plus-X (SPX), a framework for graph layout that augments classical stress minimization with penalty terms for additional readability criteria: edge crossings, crossing angle, and upwardness for directed graphs. The objective is a weighted sum of stress and the penalties, with a hyperparameter K balancing stress against the X terms. The optimization alternates between solving a linear program for the auxiliary variables u and gamma of the crossing penalties and gradient descent on the vertex coordinates. The authors evaluate SPX against dedicated single-criterion algorithms on graph drawing contest graphs, community graphs, and directed acyclic graphs, and report that SPX produces layouts that are competitive on multiple metrics while staying close to state-of-the-art performance on the individual criteria. They also provide an open-source implementation.
Significance. If the claims were fully supported, SPX would be a useful practical contribution to multi-criteria graph layout, a topic for which few general frameworks exist. The paper offers a flexible, extensible formulation and an honest discussion of trade-offs, and the release of source code and benchmark data strengthens reproducibility. However, the central claims about explicitly optimizing the minimum crossing angle and about achieving results close to single-criterion state-of-the-art are not supported by the paper's own objective definition and data. The upwardness constraint mechanism is also underspecified. With revisions that correct these overstatements and clarify the optimization, the framework could be a valuable heuristic for balanced graph drawing.
major comments (4)
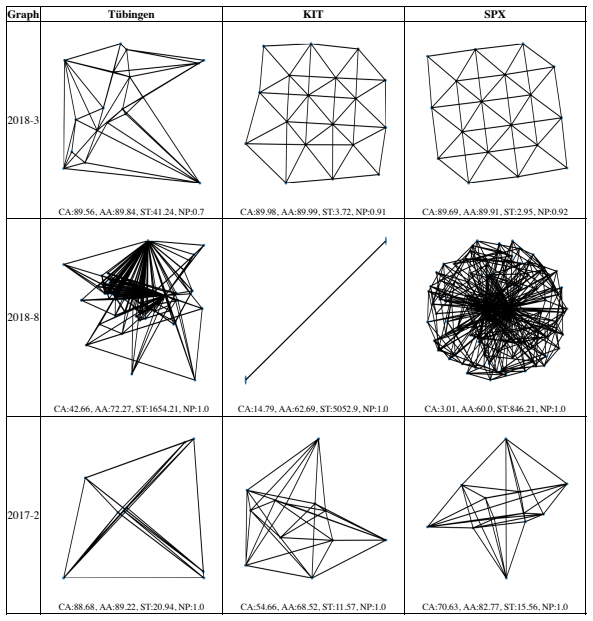
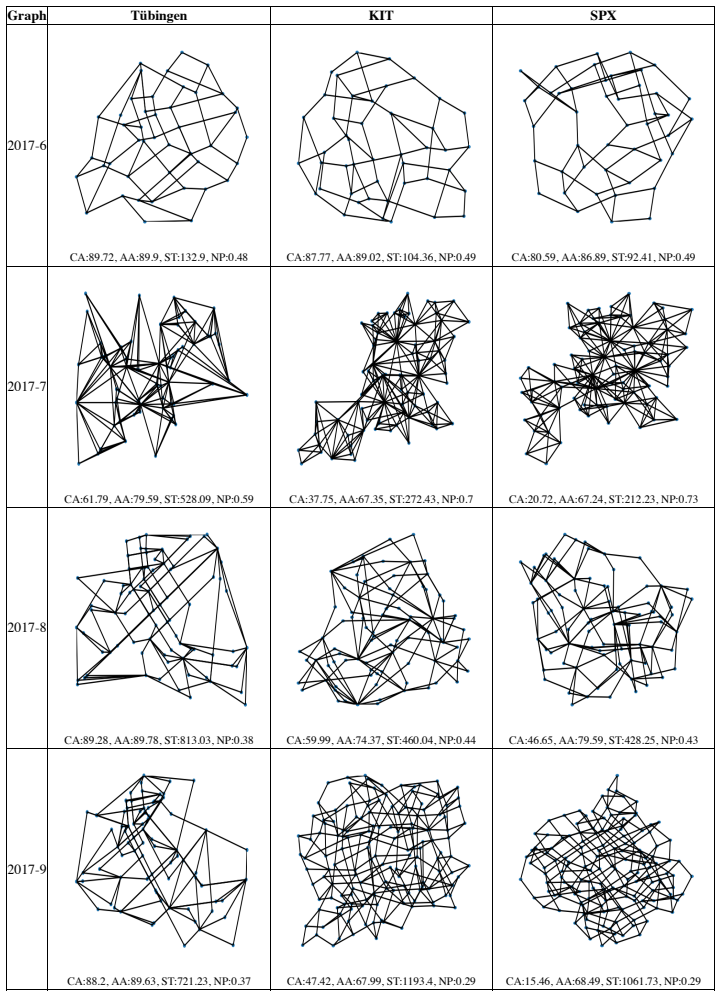
- [Section 3.2] The sentence "this modified penalty function explicitly maximizes the minimum crossing angle" is not correct as stated. The penalty is a weighted sum over crossing edge pairs of the crossing penalty of Eq. (2) multiplied by cos^2(theta_i). Minimizing this sum is a soft surrogate for angle quality; it can be reduced by improving most angles even if one very small angle remains, and the term competes with the stress term in Eq. (3). A genuine min-max formulation would require constraints of the form theta_i >= theta_min for all crossings and then maximize theta_min. The abstract's claim that SPX "simultaneously optimizes ... minimum crossing angle" therefore overstates what the objective actually does. Table 6 corroborates this: SPX's minimum crossing angles on several graphs are far below the dedicated angle optimizers (2018-8: 3.01 degrees vs 42.66 and 17.97; 2017-9: 15.46 degrees vs 88.20 and 47.64), which is not just a matter of balancing but a sign that the objective does not directly target the minimum. Please rephrase the claim as "encourages large crossing angles" or add an explicit min-max component.
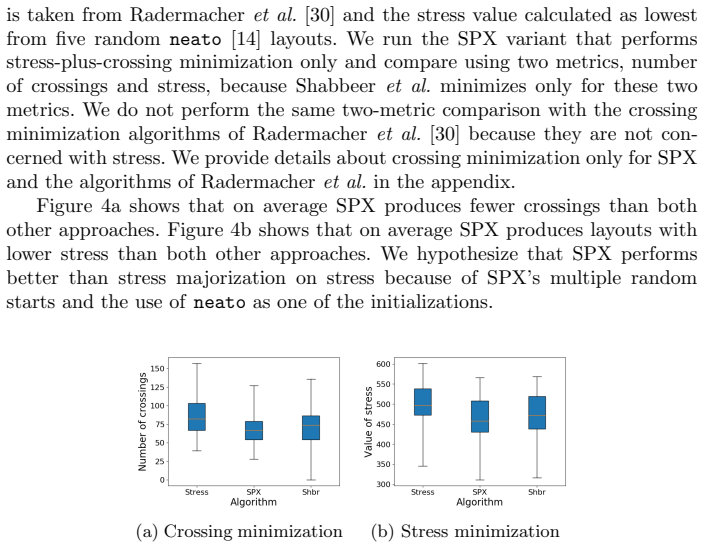
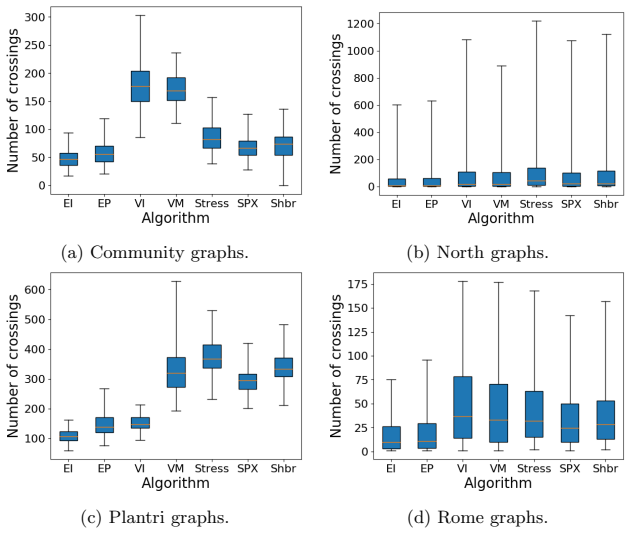
- [Abstract and Section 6.3] The abstract states that SPX "achieves results that are close to the state-of-the-art algorithms that optimize these metrics individually," and Section 6.3 claims the crossing-angle results are "generally within a factor of two of the other two teams." The data in the paper contradict these assertions. For crossing angles, Table 6 shows several graphs where SPX is more than a factor of two worse than both Tubingen and KIT (e.g., 2018-8: 3.01 vs 42.66 and 17.97; 2017-7: 20.72 vs 61.79; 2017-9: 15.46 vs 88.20 and 47.64). For crossing minimization, Tables 2-5 show that SPX never outperforms the EI or EP variants of Radermacher et al. on any of the four graph classes; its mean crossings are substantially higher (e.g., Plantri: 296.54 vs EI 109.45; Rome: 33.87 vs EI 16.95). The paper's contribution is the trade-off across criteria, not closeness to single-criterion optimizers, and the text should state this honestly rather than claiming near-state-of-the-art performance.
- [Section 3.3 and Algorithm 1] The paper says that upwardness is "enforced directly with a linear constraint (y_v > y_u)", but Algorithm 1's coordinate update is unconstrained gradient descent on the cost function. No projection, barrier term, or penalty for constraint violation is described anywhere in the optimization procedure. Since the evaluation section claims that SPX always produces completely upward drawings, the mechanism for enforcing these constraints must be specified and verified. As written, the upwardness results are not reproducible and the claim that upwardness is part of the SPX optimization is unsupported.
- [Section 3.5] The alternating optimization in Algorithm 1 has no convergence guarantee. The paper demonstrates convergence on only two graphs (Figure 3) and notes that some gradient-descent variants diverge after reaching a minimum. The evaluation, however, applies all six variants across all datasets and selects the layout that minimizes the objective. This raises the question whether the reported results actually correspond to meaningful minima of the combined cost function, and the paper does not report the sensitivity of the final metrics to the choice of variant, K, or initialization. Please either provide a stopping rule that guarantees a non-increasing objective or report the distribution of final objective values and the variability of the reported metrics across the parameter sweep.
minor comments (4)
- [Algorithm 1] The header of Algorithm 1 says "Stress-plux-X"; this should be "Stress-Plus-X".
- [Section 3.4] The sentence "choosing the layout that maximizes the objective" should read "minimizes the objective," since Eq. (3) is a cost function to be reduced.
- [Section 4.4 / Table 1] The area comparison is confounded because SPX is evaluated without any resolution constraint, while the other algorithms may implicitly enforce minimum separation. The caveat is acknowledged in the text, but Table 1 still reports SPX as best in area; consider reporting area after a fair postprocessing step or labeling the metric as "area ignoring resolution."
- [Section 6.3] The statement "generally within a factor of two of the other two teams" should be replaced with a precise numeric summary (e.g., median ratio or percentage of graphs within a factor of two), because Table 6 shows that in several cases the factor exceeds two by a wide margin.
Circularity Check
No circularity: SPX's objective and evaluation are externally anchored; the crossing-angle wording is an overclaim, not a circular reduction.
full rationale
The derivation chain in SPX is not circular. The central cost function (Eq. 3) is a weighted sum of stress plus penalty terms; the crossing penalty is inherited from Shabbeer et al. via the Farkas separation formulation (Eqs. 1-2), and the new crossing-angle term adds a cos^2(theta_i) factor to that same penalty. No 'prediction' is defined in terms of the fitted hyperparameters: K is swept over a range and rho is a binary edge-intersection indicator, not a parameter fit to make the reported metrics true. The evaluation uses independent contest graphs, Radermacher et al.'s 400-graph corpus, and standard readability metrics (stress, crossings, crossing angle, area, neighborhood preservation), so the reported results are externally checkable. The upwardness constraint y_v > y_u is a hard constraint, so SPX drawings being upward is guaranteed by design, but the comparisons for upward drawings are on stress, area, and crossings, which are not forced by the constraint. The one notable overstatement is Section 3.2's claim that the cos^2-weighted penalty 'explicitly maximizes the minimum crossing angle'; minimizing a sum of cos^2 terms is a surrogate for angle quality, not a min-max optimization of the minimum angle. That is a correctness/validity issue, not a circular reduction: the measured crossing-angle values are not equal to the objective by construction. Minor self-citations, such as the graphmetrics library [7] and the neighborhood-preservation definition [23], are code- and standard-metric support and are not load-bearing. No step reduces to its own inputs, so the circularity score is 0.
Assumptions & free parameters
free parameters (3)
- K (balancing hyperparameter) =
swept from 2^-5 to 2^5; no single reported best
- rho_i binary crossing weight =
1 if edges intersect, 0 otherwise
- cos^2(theta) coefficient in crossing-angle penalty =
cos^2(theta)
assumptions (4)
- standard math Farkas' theorem characterization of edge non-crossing (Eq. 1 and Eq. 2)
- domain assumption Stress majorization provides a good initial layout and a meaningful base objective
- domain assumption Minimizing the combined penalty objective genuinely improves the target readability metrics
- ad hoc to paper Alternating LP and gradient descent converges to useful layouts
Cite this review
Pith. "Pith review of Stress-Plus-X (SPX) Graph Layout." pith.science (2026). https://pith.science/paper/Q64MRSQA
@misc{pith2026190801769,
  author       = {Pith},
  title        = {Pith review of: Stress-Plus-X (SPX) Graph Layout},
  year         = {2026},
  howpublished = {\url{https://pith.science/paper/Q64MRSQA}},
  note         = {Machine review of arXiv:1908.01769}
}
read the original abstract
Stress, edge crossings, and crossing angles play an important role in the quality and readability of graph drawings. Most standard graph drawing algorithms optimize one of these criteria which may lead to layouts that are deficient in other criteria. We introduce an optimization framework, Stress-Plus-X (SPX), that simultaneously optimizes stress together with several other criteria: edge crossings, minimum crossing angle, and upwardness (for directed acyclic graphs). SPX achieves results that are close to the state-of-the-art algorithms that optimize these metrics individually. SPX is flexible and extensible and can optimize a subset or all of these criteria simultaneously. Our experimental analysis shows that our joint optimization approach is successful in drawing graphs with good performance across readability criteria.
Figures

Figures from the paper (9 more)




Reference graph
Works this paper leans on
-
[1]
Thirty Essays on Geometric Graph Theory (2012)
´Abrego, B.M., Fern´ andez-Merchant, S., Salazar, G.: The rectilinear crossing num- ber of kn: Closing in (or are we?). Thirty Essays on Geometric Graph Theory (2012). https://doi.org/10.1007/978-1-4614-0110-0 2
-
[2]
In: Proceedings of the 18th International Conference on Graph Draw- ing
Argyriou, E.N., Bekos, M.A., Symvonis, A.: Maximizing the total resolution of graphs. In: Proceedings of the 18th International Conference on Graph Draw- ing. pp. 62–67. GD’10, Springer-Verlag, Berlin, Heidelberg (2011), http://dl. acm.org/citation.cfm?id=1964371.1964378
-
[3]
A Heuristic Approach towards Drawings of Graphs with High Crossing Resolution
Bekos, M.A., F¨ orster, H., Geckeler, C., Holl¨ ander, L., Kaufmann, M., Spallek, A.M., Splett, J.: A heuristic approach towards drawings of graphs with high cross- ing resolution. CoRR abs/1808.10519 (2018), http://arxiv.org/abs/1808. 10519
work page Pith review arXiv 2018
-
[4]
Handbook of Graph Drawing and Visualization pp
Buchheim, C., Chimani, M., Gutwenger, C., J¨ unger, M., Mutzel, P.: Crossings and planarization. Handbook of Graph Drawing and Visualization pp. 43–85 (2013)
work page 2013
-
[5]
Journal of the American Statistical Association 104(485), 209–219 (2009)
Chen, L., Buja, A.: Local multidimensional scaling for nonlinear dimension reduc- tion, graph drawing, and proximity analysis. Journal of the American Statistical Association 104(485), 209–219 (2009)
work page 2009
-
[6]
Dagrejs: dagrejs/dagre, https://github.com/dagrejs/dagre/wiki
-
[7]
https://github.com/felicedeluca/graphmetrics (2019)
De Luca, F.: graphmetrics library. https://github.com/felicedeluca/graphmetrics (2019)
work page 2019
-
[8]
A Greedy Heuristic for Crossing-Angle Maximization
Demel, A., D¨ urrschnabel, D., Mchedlidze, T., Radermacher, M., Wulf, L.: A greedy heuristic for crossing-angle maximization. CoRR abs/1807.09483 (2018)
work page Pith review arXiv 2018
Show all 37 references
-
[9]
In: International Symposium on Graph Drawing and Network Visualization
Devanny, W., Kindermann, P., L¨ offler, M., Rutter, I.: Graph drawing contest re- port. In: International Symposium on Graph Drawing and Network Visualization. pp. 575–582. Springer (2017)
2017
-
[10]
In: International Symposium on Graph Drawing and Network Visualization
Devanny, W., Kindermann, P., L¨ offler, M., Rutter, I.: Graph drawing contest re- port. In: International Symposium on Graph Drawing and Network Visualization. pp. 609–617. Springer (2018)
2018
-
[11]
In: International Symposium on Graph Drawing
Duncan, C.A., Gutwenger, C., Nachmanson, L., Sander, G.: Graph drawing contest report. In: International Symposium on Graph Drawing. pp. 575–579. Springer (2012)
2012
-
[12]
Dwyer, T.: Scalable, versatile and simple constrained graph layout. Comput. Graph. Forum 28, 991–998 (2009)
2009
-
[13]
IEEE transactions on visualization and com- puter graphics 12, 821–8 (09 2006)
Dwyer, T., Koren, Y., Marriott, K.: Ipsep-cola: An incremental procedure for sep- aration constraint layout of graphs. IEEE transactions on visualization and com- puter graphics 12, 821–8 (09 2006). https://doi.org/10.1109/TVCG.2006.156
2006 doi
-
[14]
In: International Symposium on Graph Drawing
Ellson, J., Gansner, E., Koutsofios, L., North, S.C., Woodhull, G.: Graphviz—open source graph drawing tools. In: International Symposium on Graph Drawing. pp. 483–484. Springer (2001)
2001
-
[15]
Software: Practice and Experience 21(11), 1129–1164 (1991)
Fruchterman, T.M.J., Reingold, E.M.: Graph drawing by force-directed placement. Software: Practice and Experience 21(11), 1129–1164 (1991). https://doi.org/10.1002/spe.4380211102, https://onlinelibrary.wiley.com/ doi/abs/10.1002/spe.4380211102
1991 doi
-
[16]
In: Pach, J
Gansner, E.R., Koren, Y., North, S.: Graph drawing by stress majorization. In: Pach, J. (ed.) Graph Drawing. pp. 239–250. Springer Berlin Heidelberg, Berlin, Heidelberg (2005)
2005
-
[17]
Gansner, E.R., North, S.C., Vo, K.P.: Technique for drawing directed graphs (08 1990), uS Patent 4,953,106
1990
-
[18]
http://graphdrawing.de/contest2018/challenge.html
gdchallenge: Graph drawing live challenge on crossing angle maximization (auto- matic). http://graphdrawing.de/contest2018/challenge.html
-
[19]
In: International Symposium on Graph Drawing
Gutwenger, C., L¨ offler, M., Nachmanson, L., Rutter, I.: Graph drawing contest report. In: International Symposium on Graph Drawing. pp. 501–506. Springer (2014)
2014
-
[20]
Huang, W., Eades, P., Hong, S.H.: Larger crossing angles make graphs easier to read. J. Vis. Lang. Comput. 25(4), 452–465 (Aug 2014). https://doi.org/10.1016/j.jvlc.2014.03.001, http://dx.doi.org/10.1016/j.jvlc. 2014.03.001
2014 doi
-
[21]
Journal of Visual Languages & Computing24(4), 262 – 272 (2013)
Huang, W., Eades, P., Hong, S.H., Lin, C.C.: Improving multiple aesthetics pro- duces better graph drawings. Journal of Visual Languages & Computing24(4), 262 – 272 (2013). https://doi.org/https://doi.org/10.1016/j.jvlc.2011.12.002, http:// www.sciencedirect.com/science/articl...
2013 doi
-
[22]
Information Processing Letters 31(1), 7 – 15 (1989)
Kamada, T., Kawai, S.: An algorithm for drawing general undi- rected graphs. Information Processing Letters 31(1), 7 – 15 (1989). https://doi.org/https://doi.org/10.1016/0020-0190(89)90102-6, http: //www.sciencedirect.com/science/article/pii/0020019089901026
1989
-
[23]
Kruiger, J.F., Rauber, P.E., Martins, R.M., Kerren, A., Kobourov, S., Telea, A.C.: Graph layouts by t-sne. Comput. Graph. Forum 36(3), 283–294 (Jun 2017). https://doi.org/10.1111/cgf.13187, https://doi.org/10.1111/cgf.13187
2017 doi
-
[24]
Psychometrika 29(1), 1–27 (1964)
Kruskal, J.B.: Multidimensional scaling by optimizing goodness of fit to a non- metric hypothesis. Psychometrika 29(1), 1–27 (1964)
1964
-
[25]
Journal of machine learn- ing research 9(Nov), 2579–2605 (2008)
Maaten, L.v.d., Hinton, G.: Visualizing data using t-sne. Journal of machine learn- ing research 9(Nov), 2579–2605 (2008)
2008
-
[26]
arXiv preprint arXiv:1802.03426 (2018)
McInnes, L., Healy, J., Melville, J.: Umap: Uniform manifold approximation and projection for dimension reduction. arXiv preprint arXiv:1802.03426 (2018)
2018 arXiv
-
[27]
15th International Symposium on Graph Drawing (02 2007)
Mutzel, P., Chimani, M., Gutwenger, C., Klein, K.: Ogdf an open graph draw- ing framework. 15th International Symposium on Graph Drawing (02 2007). https://doi.org/10.17877/DE290R-7670
2007 doi
-
[28]
Pich, C.: Applications of multidimensional scaling to graph drawing. Ph.D. thesis (2009)
2009
-
[29]
(ed.) Graph Drawing
Purchase, H.: Which aesthetic has the greatest effect on human understanding? In: DiBattista, G. (ed.) Graph Drawing. pp. 248–261. Springer Berlin Heidelberg, Berlin, Heidelberg (1997)
1997
-
[30]
In: The 20th Workshop on Algorithm Engineer- ing and Experiments (ALENEX’18)
Radermacher, M., Reichard, K., Rutter, I., Wagner, D.: A geometric heuristic for rectilinear crossing minimization. In: The 20th Workshop on Algorithm Engineer- ing and Experiments (ALENEX’18). p. 129–138. Pagh, R., Venkatasubramanian, S. (eds.) (2018). https://doi.org/https:/...
2018 doi
-
[31]
CoRR abs/1609.04747 (2016), http://arxiv.org/abs/1609.04747
Ruder, S.: An overview of gradient descent optimization algorithms. CoRR abs/1609.04747 (2016), http://arxiv.org/abs/1609.04747
2016 arXiv
-
[32]
In: International Symposium on Graph Drawing
Seemann, J.: Extending the sugiyama algorithm for drawing uml class diagrams: Towards automatic layout of object-oriented software diagrams. In: International Symposium on Graph Drawing. pp. 415–424. Springer (1997)
1997
-
[33]
In: NIPS Workshop on Challenges of Data Visualization (2010)
Shabbeer, A., Ozcaglar, C., Gonzalez, M., Bennett, K.P.: Optimal embedding of heterogeneous graph data with edge crossing constraints. In: NIPS Workshop on Challenges of Data Visualization (2010)
2010
-
[34]
Psychometrika 27(2), 125–140 (1962)
Shepard, R.N.: The analysis of proximities: multidimensional scaling with an un- known distance function. Psychometrika 27(2), 125–140 (1962)
1962
-
[35]
IEEE Transactions on Systems, Man, and Cybernetics 11(2), 109–125 (1981)
Sugiyama, K., Tagawa, S., Toda, M.: Methods for visual understanding of hierar- chical system structures. IEEE Transactions on Systems, Man, and Cybernetics 11(2), 109–125 (1981)
1981
-
[36]
IEEE Transactions on Visualization and Computer Graphics 24(1), 489–499 (Jan 2018)
Wang, Y., Wang, Y., Sun, Y., Zhu, L., Lu, K., Fu, C., Sedlmair, M., Deussen, O., Chen, B.: Revisiting stress majorization as a unified framework for interactive con- strained graph visualization. IEEE Transactions on Visualization and Computer Graphics 24(1), 489–499 (Jan 2018)...
2018
-
[37]
Information visualization 1(2), 103–110 (2002) 6 Appendix Further detail about the graphs used for evaluation of the upward criteria is in Appendix 6.1
Ware, C., Purchase, H., Colpoys, L., McGill, M.: Cognitive measurements of graph aesthetics. Information visualization 1(2), 103–110 (2002) 6 Appendix Further detail about the graphs used for evaluation of the upward criteria is in Appendix 6.1. We provide further evaluation o...
2002
Reviewed August 14, 2026 · model on record in the stance chip above.
Discussion (0). Continue with ORCID to comment.