REVIEW 4 major objections 5 minor 54 references
Characterizing the limits of human stability during motion: perturbative experiment validates a model-based approach for the Sit-to-Stand task
T0 review · 4 major / 5 minor · reviewed 2026-08-14 · deepseek-v4-flash
Pith's one-line read A 'stability basin' built from a person's own motion predicts sit-to-stand failure before it happens.
desk verdict A promising first validation of the Stability Basin idea, but the 90% failure-accuracy claim is undermined by a terminal-set loophole for late failures. read the letter →
The pith
A machine-rendered reading of the paper's core claim, the machinery that carries it, and where it could break.
The reading
What carries the argument
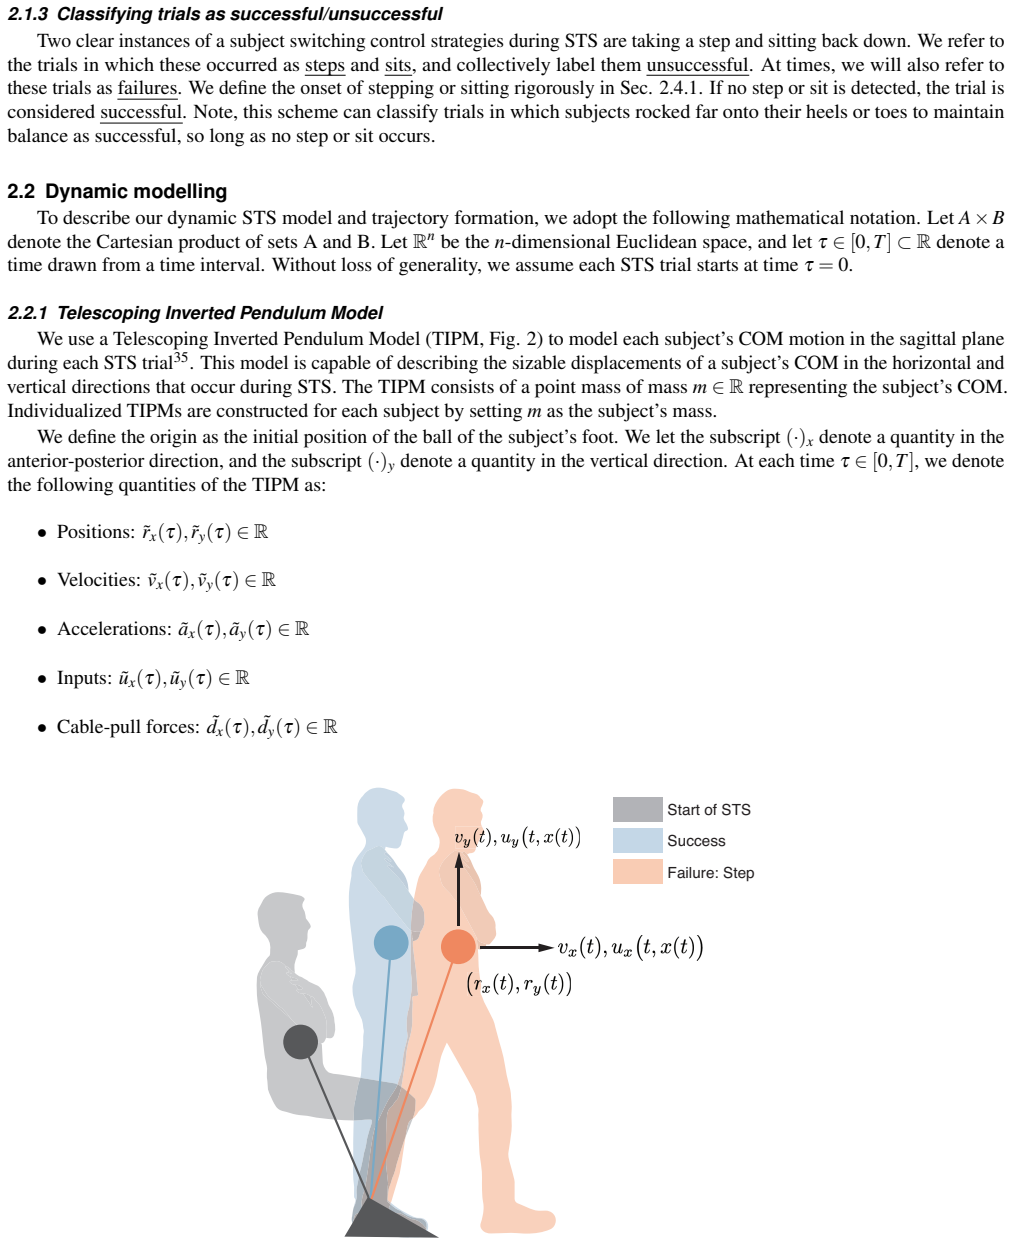
The central object is the Stability Basin, defined for each subject and sit-to-stand strategy as the set of times and body states from which the model can reach standing without violating control limits. Body motion is represented by a Telescoping Inverted Pendulum Model: a point mass at the center of mass with separate horizontal and vertical position and velocity states. Two data-driven objects make the basin match the individual: a 'bounded feedforward plus feedback' (BFF+FB) controller, whose feedforward term may range over an envelope fitted by quadratic programming to the inverse-dynamics inputs of all successful trials, and a standing set formed as a zonotope — a symmetric polytope described by a center and generators — that encloses the final states of successful trials, with each generator expanded by 5%. Reachability analysis flows the standing set backward through time under the pendulum dynamics and input envelope, yielding time-indexed basins; a trial is predicted to fail if its observed trajectory exits the basin before the step or sit event, and to succeed if it never exits.
What would settle it
Run cable-pull trials that deliberately push a subject through states the basin labels unsafe while coaching them to recover with a strategy that never appears in the successful trials used to build the basin (for example, a quick corrective step); if those trials are recovered without stepping or sitting, the envelope under-covers the true stable region. A cheaper check is to rebuild each basin with the standing set expanded by 0% and by 20% instead of 5% and see whether the reported accuracy survives; if it changes sharply, the headline numbers depend on that tuning choice.
Extended reading notes
Core claim
The paper's central claim is that a Stability Basin — the set of body states from which a person can finish standing under their own control strategy — can be computed from successful trials alone and then, in a perturbed trial, correctly separates recoverable perturbations from those that force a strategy switch. In the experiment, cable pulls applied to the waist of 11 subjects during natural, momentum-transfer, and quasi-static sit-to-stand motions produced 198 trials in which the subject stepped or sat back down; such events define failure. State trajectories from motion capture were checked against each subject's basin, and the basin predicted 110 of 121 steps and 71 of 77 sits before their onset (failure accuracy 90.9% and 92.2%, combined 91.4%), while 718 of 750 successful trials stayed inside the basin (95.7%). Three alternative constructions — a linear-quadratic regulator controller, a single feedforward-plus-feedback controller, and a naive envelope around successful trajectories — predicted successful trials only 9.5%, 46.8%, and 16.7% of the time, respectively, meaning they grossly under-estimate the stable region. The paper concludes that the bounded, data-driven input model is what makes the basin both accurate and not overly conservative.
Load-bearing premise
The whole prediction rests on the assumption that the forces a person applied and the standing poses observed during successful trials cover every recovery strategy that person could actually use; if a person recovers using an action outside that observed range, the computed basin will flag them as unstable even though they are not.
Editorial extensions
If this is right
- The method classifies whether a perturbed sit-to-stand trial will end in a step or sit before that event occurs, using only center-of-mass kinematics from the trial.
- Because the basin is built exclusively from successful trials, it can be applied to frail or fall-prone individuals without ever perturbing them to the point of falling.
- Each strategy-specific basin computes in under a second on a laptop, which makes the approach fast enough for clinical screening or for near-real-time feedback.
- Repeated assessments could track whether an individual's basin shrinks or grows over time, giving a quantitative, task-specific fall-risk monitoring tool.
- Wearable assistive devices could use the basin as a safety constraint or optimization target, adjusting support when the user is about to exit the stable region.
Reading between the lines
- The paper's 17 misclassified failures lie, on average, closer to successful trajectories and occur earlier in the pull than correct failure predictions, which suggests the basin edge is a gray zone rather than a hard boundary — a possibility the paper does not test.
- Varying the 5% expansion of the standing set (for instance, 0% and 20%) would show how much of the reported accuracy depends on that tuning constant; the paper does not report such a sensitivity check.
- If a person can recover with a strategy never shown in the successful trials used to fit the input envelope — such as a deliberate lunge — the method would label it a failure; a protocol that elicits and tests such alternate recoveries could expose under-coverage of the envelope.
- The same backwards-reachability pipeline should transfer to other aperiodic tasks, such as step-ups or reaching, provided the completion set and failure definitions are equally well specified; this is a natural next application not addressed in the paper.
Signed reviews
Editorial analysis
A structured set of objections, weighed in public.
Referee Report
Summary. The paper proposes a data-driven method to compute subject- and strategy-specific Stability Basins (SBs) for the Sit-to-Stand (STS) task, using a Telescoping Inverted Pendulum Model, bounded feedforward-plus-feedback (BFF+FB) control bounds estimated from successful trials (Eqs. 6-8), and a standing zonotope XT built from successful final states. The SB is computed by backwards reachability with CORA. The method is validated on an 11-subject perturbative STS experiment with 948 trials, including 198 cable-pull-induced failures (steps and sits). The authors report that SBs predict 90.91% of steps and 92.21% of sits before failure onset, and 95.73% of successful trials in a leave-one-out procedure, outperforming LQR, FF+FB, and naive trajectory-envelope baselines. The central claim is that a stability basin constructed only from successful-trial kinematics and control bounds can classify whether a perturbed STS trial will end in a step or sit before the failure occurs.
Significance. If the validation is sound, this is a significant methodological contribution: it provides the first experimental validation of a reachability-based Stability Basin for an aperiodic, non-periodic movement, and it does so with a computationally tractable pipeline (about 0.76 s per SB) that uses only successful trials, which is clinically attractive. The comparison against LQR, FF+FB, and a naive envelope is a useful benchmark, and the data/code release (GitHub) supports reproducibility. However, the central validation claim is currently not established at the level the abstract implies: the pooled 'over 90%' failure rate is not achieved in the Momentum-Transfer condition, and a substantial fraction of failure trials have their defined onset after the normalized trial end, where the terminal-set check may make failure predictions nearly tautological. These issues are addressable with additional analysis of the existing data, so the contribution is potentially strong but needs revision.
major comments (4)
- [Sec. 2.4.1, Table 1] The resetting of tf to 1 for failures whose onset occurs after the trial end, combined with a standing zonotope XT built exclusively from successful final states, makes the terminal check x(1)∈XT nearly tautological for late-onset failures. Table 1 reports mean step onsets of 107.27% (natural) and 114.30% (MT) of normalized trial time with standard deviations of 20.92 and 32.66; assuming approximate normality, roughly 60-70% of natural and MT step trials have onset after t=1. For those trials, the prediction is based on the full trajectory up to t=1, and any exit from the SB—including an exit at t=1 because the subject has not reached the successful standing set—counts as a correct failure prediction. Because the paper does not report first-exit times or the lead time between the first SB exit and tf, the reported 90.91% step and 92.21% sit rates do not establish that the SB boundary is crossed before the behavioral failure. Please report the fraction of failure trials with tf>1, the distribution of first-exit times, and re-compute accuracy using only trials with tf≤1 and with a minimum lead-time requirement.
- [Abstract, Table 2] The headline claim of 'over 90% accuracy' for failure predictions is a pooled rate that is not achieved in the Momentum-Transfer condition. Table 2 reports 33/40 (82.5%) steps and 17/19 (84.75%) sits for MT, while natural and QS strategies are at least 92%. The abstract and introduction state an unqualified 'over 90%' accuracy, which is unsupported for a full third of the tested strategy conditions. Please report per-strategy rates with confidence intervals and qualify the abstract claim accordingly.
- [Sec. 2.3.1, Remark 3] The input envelope used to construct the SB is fit only to the non-perturbed portions of successful cable-pull trials; the reactive control inputs during the 250 ms perturbation are discarded in the inverse-dynamics computation. Thus the BFF+FB set does not actually cover the control inputs a human uses to recover from the perturbation, which is the central modeling assumption the validation is intended to test. If the envelope is too narrow during the perturbation window, the SB will be overconservative and failure predictions will be inflated. Please report how many successful trials contribute to the envelope at each time step, and compare failure-prediction rates for SB variants that include perturbed-window inputs from successful CP trials or use an explicitly enlarged input bound during perturbation.
- [Sec. 2.4.3, Table 2] All prediction rates are pooled across 11 subjects and across trials without accounting for within-subject correlation or reporting subject-level variability. Because each subject contributes many trials (for example, 591 cable-pull trials across subjects), a small number of subjects could dominate the aggregate. Please provide per-subject accuracy tables, confidence intervals (e.g., by bootstrap or a mixed-effects model), and the range of per-subject success and failure prediction rates.
minor comments (5)
- [Sec. 2.4.3] The leave-one-out description is ambiguous: 'After forming the standing set, we leave one successful trial out...'—it is not clear whether the left-out trial's final state is included in the standing zonotope XT. If it is, the t=1 membership of that trial is guaranteed by construction; please clarify and, if appropriate, also leave the trial out of the XT construction.
- [Sec. 2.5.1] The LQR weighting matrices Q=I and R=10^-4 I are reported as 'found empirically to produce the best results,' but the data used for this tuning are not specified. If the weights were tuned on the validation set, the comparison in Table 4 is biased; please state the tuning procedure and whether the validation data were used.
- [Table 4, Sec. 3] The statement that the SB 'estimates the stable region with over 45% more accuracy' is not defined precisely. The table mixes success and failure rates with different denominators; please report a single pre-specified accuracy metric (e.g., balanced accuracy or Matthews correlation coefficient) and give per-strategy values.
- [General] The paper would benefit from confidence intervals or Bayesian credible intervals for the main prediction rates; with only 11 subjects and modest numbers of failures per strategy, the reported percentages (e.g., 17/19 sits for MT) have wide uncertainty.
- [Appendix B] The phrase 'where the times at which the peak horizontal COM velocities occur are coincident' should specify whether the alignment is done on filtered data and whether the same alignment is used for all strategies; the QS procedure uses vertical COM velocity, which is a different criterion and could affect comparability.
Circularity Check
Part of the reported accuracy is by construction: late failures are scored as exits from the successful-final-state set at t=1, and the standing set is not left out when 'predicting' successful trials.
-
self definitional
[Sec. 2.4.1 (Determining onset of failure); Sec. 2.4.3 (Evaluation procedure); Table 1 note]
"Since we are using a procedure based on an average nominal trial for aligning and segmenting trials (detailed in Appendix B), it is possible for the onset of stepping or sitting to occur after the trial end time t = 1. ... We consider a trial with a step or sit occurring later than the trial’s end to be unsuccessful, and set t f = 1 in this case. If x exits the SB at any time step, the trial is predicted to fail."
For a trial with t_f = 1, the prediction uses the whole interval [0,1]. The SB is computed as the backward reachable set from the standing set XT, so at t = 1 the SB is XT (up to CORA overapproximation). The failure prediction therefore reduces to checking whether x(1) lies outside XT, the zonotope built from the final states of successful trials. Table 1 reports mean step onsets of 107.27% (natural) and 114.30% (MT) and a mean MT sit onset of 99.38%, and the paper says such late onsets were 'often' observed. For these trials the reported 'predicted prior to onset' result is a terminal-set membership test (not in the successful-endpoint set) rather than evidence that the reachable dynamics anticipated the step or sit.
-
fitted input called prediction
[Sec. 2.3.2 (Generating the standing set); Sec. 2.4.3 (Evaluation procedure)]
"We define XT⊂ X as a zonotope that encompasses the final states (i.e., the states at 100%STS) of all successful trials observed for a given STS strategy. ... After forming the standing set, we leave one successful trial out of the BFF+FB computations in (8)."
The leave-one-out excludes the tested successful trial only from the BFF+FB controller fit, not from the standing set. Since the SB is the backward reachable set from XT, the tested trial’s final state is guaranteed to be inside the SB at t = 1 by construction. The reported 95.73% successful-trial accuracy therefore includes a terminal-time component that is true by definition. The naive method, by contrast, is assessed with a leave-one-out envelope; if it included the tested trial it would also score near 100% at the terminal time. This unequal handling inflates the BFF+FB success rate and the claimed >45% improvement over alternatives.
full rationale
The paper is not globally circular: the BFF+FB input bounds are genuinely fit on successful trials and then tested on left-out successes and on all failures, and the failure ground truth (step/sit) is externally observed and was not used to build the SB. The comparison to the naive envelope also shows that reachability adds some discrimination. However, two evaluation choices make parts of the headline accuracies true by construction. First, for late failures t_f is reset to 1, so the prediction horizon ends at the terminal set; since the SB at t=1 is the standing set XT, the failure prediction for those trials reduces to a terminal-set membership test rather than a dynamical prediction. Second, the leave-one-out procedure for successful trials leaves the standing set intact, so the tested successful trial’s endpoint is inside XT by construction; this inflates the reported success rate and makes the comparison to the naive method unequal. The self-citation to Shia et al. (ref 31) is not the source of circularity: it supplies the SB concept and an LQR baseline, but the experimental validation here is independent of that citation.
Assumptions & free parameters
free parameters (7)
- BFF+FB input envelope (ff_lb, ff_ub, K(t)) =
per time step, per subject, per strategy
- Standing zonotope generator expansion =
5%
- LQR weighting matrices Q and R =
Q=I4x4, R=1e-4 I2x2
- Toe displacement threshold =
3 inches in anterior-posterior direction
- Segmentation thresholds (Tmin, Tmax, start/end criteria) =
Tmin=0.75 s, Tmax=1.5*Tnom, start at 20% max acceleration, end at 99% max vertical position
- Reachability time step =
0.005 (0.5% STS)
- Cable-pull peak force levels =
low, medium, high calibrated per subject
assumptions (6)
- domain assumption The telescoping inverted pendulum point-mass model in Eq. 3 captures the sagittal-plane COM dynamics relevant to STS stability.
- domain assumption Successful-trial input bounds (BFF+FB, Eqs. 6-8) enclose all possible human recovery inputs for a given strategy.
- domain assumption A failure of control strategy is fully and correctly detected by stepping or sitting back down.
- ad hoc to paper The standing set XT is a zonotope with 5% expansion that covers all true standing states.
- standard math CORA's reachability over-approximation of the linearized dynamics preserves the true stability boundary closely enough.
- domain assumption Trial segmentation by matching to an average nominal trajectory does not systematically distort failure onset times.
Cite this review
Pith. "Pith review of Characterizing the limits of human stability during motion: perturbative experiment validates a model-based approach for the Sit-to-Stand task." pith.science (2026). https://pith.science/paper/LDKGM7GR
@misc{pith2026190801876,
  author       = {Pith},
  title        = {Pith review of: Characterizing the limits of human stability during motion: perturbative experiment validates a model-based approach for the Sit-to-Stand task},
  year         = {2026},
  howpublished = {\url{https://pith.science/paper/LDKGM7GR}},
  note         = {Machine review of arXiv:1908.01876}
}
read the original abstract
Falls affect a growing number of the population each year. Clinical methods to identify those at greatest risk for falls usually evaluate individuals while they perform specific motions such as balancing or Sit-to-Stand (STS). Unfortunately these techniques have been shown to have poor predictive power and are unable to identify the magnitude, direction, and timing of perturbations that can cause an individual to lose stability during motion. To address this limitation, the recently proposed Stability Basin (SB) aims to characterize the set of perturbations that will cause an individual to fall under a specific motor control strategy. The SB is defined as the set of configurations that do not lead to failure for an individual under their chosen control strategy. This paper presents a novel method to compute the SB and the first experimental validation of the SB with an 11-person perturbative STS experiment involving forwards or backwards pulls from a motor-driven cable. The individually-constructed SBs are used to identify when a trial fails, i.e., when an individual must switch control strategies (indicated by a step or sit) to recover from a perturbation. The constructed SBs correctly predict the outcome of trials where failure was observed with over 90% accuracy, and correctly predict the outcome of successful trials with over 95% accuracy. The SB was compared to three other methods and was found to estimate the stable region with over 45% more accuracy in all cases. This study demonstrates that SBs offer a novel model-based approach for quantifying stability during motion, which could be used in physical therapy for individuals at risk of falling.
Figures


Figures from the paper (7 more)




Reference graph
Works this paper leans on
-
[1]
Falls in older people: Epidemiology, risk factors and strategies for prevention
Rubenstein, L. Falls in older people: Epidemiology, risk factors and strategies for prevention. Age Ageing 35 Suppl 2, ii37–ii41, DOI: 10.1093/ageing/afl084 (2006)
-
[2]
Stevens, J. A., Corso, P. S., Finkelstein, E. A. & Miller, T. R. The costs of fatal and non-fatal falls among older adults. Inj. Prev. 12, 290–295, DOI: 10.1136/ip.2005.011015 (2006). https://injuryprevention.bmj.com/content/12/5/290.full.pdf
work page Pith review arXiv 2006
-
[3]
Heinrich, S., Rapp, K., Rissmann, U., Becker, C. & König, H.-H. Cost of falls in old age: a systematic review. Osteoporos. Int. 21, 891–902, DOI: 10.1007/s00198-009-1100-1 (2010). 14/19
-
[4]
Robertson, M. C., Devlin, N., Gardner, M. M. & Campbell, A. J. Effectiveness and economic evaluation of a nurse delivered home exercise programme to prevent falls. 1: Randomised controlled trial. BMJ 322, 697, DOI: 10.1136/bmj.322.7288.697 (2001). http://www.bmj.com/content/322/7288/697.full.pdf
-
[5]
Bloem, B., Boers, I., Cramer, M., Westendorp, R. & Gerschlager, W. Falls in the elderly. i. identification of risk factors. Wiener klinische Wochenschrift 113, 352–62 (2001)
work page 2001
-
[6]
Network analysis and disease subnets for the SARS-CoV-2/Human interactome
Delbaere, K., Hauer, K. & Lord, S. Evaluation of the incidental and planned exercise questionnaire (ipeq) for older people. Br. J. Sports Medicine 44, 1029–34, DOI: 10.1136/bjsm.2009.060350 (2009)
work page Pith review arXiv 2009
-
[7]
Hauer, K. et al. Validation of the falls efficacy scale and falls efficacy scale international in geriatric patients with and without cognitive impairment: Results of self-report and interview-based questionnaires. J. Gerontol. 56, 190–9, DOI: 10.1159/000236027 (2009)
-
[8]
Measuring balance in the elderly: Preliminary development of an instrument
Berg, K. Measuring balance in the elderly: Preliminary development of an instrument. Physiother. Can. 41, 304–311, DOI: 10.3138/ptc.41.6.304 (1989)
Show all 54 references
-
[9]
& Richardson, S
Podsiadlo, D. & Richardson, S. The timed up and go: A test of basic functional mobility for frail elderly persons. J. Am. Geriatr. Soc. 39, 142–8, DOI: 10.1111/j.1532-5415.1991.tb01616.x. (1991)
1991
-
[10]
& Gustafson, Y
Lundin-Olsson, L., Nyberg, L. & Gustafson, Y . Stops walking when talking as a predictor of falls in the elderly.Lancet 349, 617, DOI: 10.1016/S0140-6736(97)24009-2 (1997)
1997 doi
-
[11]
Weinstein, N
D. Weinstein, N. Unrealistic optimism about susceptibility to health problems: Conclusions from a community-wide sample. J. Behav. Medicine 10, 481–500, DOI: 10.1007/BF00846146 (1987)
1987 doi
-
[12]
Response bias, social desirability and dissimulation
Furnham, A. Response bias, social desirability and dissimulation. Pers. Individ. Differ. 7, 385–400, DOI: 10.1016/ 0191-8869(86)90014-0 (1986)
1986
-
[13]
& Woollacott, M
Shumway-Cook, A., Brauer, S. & Woollacott, M. Predicting the probability for falls in community-dwelling older adults using the timed up & go test. Phys. Ther. 80, 896–903, DOI: 10.1093/ptj/80.9.896 (2000). /oup/backfile/content_public/ journal/ptj/80/9/10.1093_ptj_80.9.896/3/p...
2000 doi
-
[14]
& Mollinger, L
Steffen, T., Hacker, T. & Mollinger, L. Age- and gender-related test performance in community-dwelling elderly people: Six-minute walk test, berg balance scale, timed up & go test, and gait speeds. Phys. Ther. 82, 128–37 (2002)
2002
-
[15]
C., Simonsen, O., Sinkjaer, T
Laessoe, U., Hoeck, H. C., Simonsen, O., Sinkjaer, T. & V oigt, M. Fall risk in an active elderly population - can it be assessed? J. Negat. Results Biomed. 6, 2, DOI: 10.1186/1477-5751-6-2 (2007)
2007 doi
-
[16]
W., Berg, K., Chesworth, B
Muir, S. W., Berg, K., Chesworth, B. & Speechley, M. Use of the berg balance scale for predicting multiple falls in community-dwelling elderly people: A prospective study. Phys. Ther. 88, 449–459, DOI: 10.2522/ptj.20070251 (2008). /oup/backfile/content_public/journal/ptj/88/4/1...
2008 doi
-
[17]
Hausdorff, J., A. Rios, D. & K. Edelberg, H. Gait variability and fall risk in community-living older adults: A 1-year prospective study. Arch. Phys. Medicine Rehabil. 82, 1050–6, DOI: 10.1053/apmr.2001.24893 (2001)
2001
-
[18]
Lockhart, T. E. & Liu, J. Differentiating fall-prone and healthy adults using local dynamic stability. Ergonomics 51, 1860–1872, DOI: 10.1080/00140130802567079 (2008). PMID: 19034782, https://doi.org/10.1080/00140130802567079
2008 doi
-
[19]
Biomechanical and age-related differences in balance recovery using the tether-release method
Hsiao-Wecksler, E. Biomechanical and age-related differences in balance recovery using the tether-release method. J. Electromyogr. Kinesiol. 18, 179–87, DOI: 10.1016/j.jelekin.2007.06.007 (2008)
2008 doi
-
[20]
A., Salapaka, S
Hur, P., Duiser, B. A., Salapaka, S. M. & Hsiao-Wecksler, E. T. Measuring robustness of the postural control system to a mild impulsive perturbation. IEEE Transactions on Neural Syst. Rehabil. Eng. 18, 461–467, DOI: 10.1109/TNSRE.2010. 2052133 (2010)
2010 doi
-
[21]
& Van Dieen, J
Bruijn, S., Meijer, O., Beek, P. & Van Dieen, J. Assessing the stability of human locomotion: a review of current measures. J. Royal Soc. Interface 11, DOI: 10.1098/rsif.2013.0900 (2014)
2014
-
[22]
& Dériaz, O
Terrier, P. & Dériaz, O. Kinematic variability, fractal dynamics and local dynamic stability of treadmill walking. J. NeuroEngineering Rehabil. 8, 12, DOI: 10.1186/1743-0003-8-12 (2011)
2011 doi
-
[23]
& Cavanagh, P
Dingwell, J., Cusumano, J., Sternad, D. & Cavanagh, P. Slower speeds in patients with diabetic neuropathy lead to improved local dynamic stability of continuous overground walking. J. Biomech. 33, 1269 – 1277, DOI: https: //doi.org/10.1016/S0021-9290(00)00092-0 (2000)
2000 doi
-
[24]
J., Borrie, M
Campbell, A. J., Borrie, M. J. & Spears, G. F. Risk factors for falls in a community-based prospective study of people 70 years and older. J. Gerontol. 44, 112–117 (1989)
1989
-
[25]
& Sinke, W
Hof, A., Gazendam, M. & Sinke, W. The condition for dynamic stability. J. Biomech. 38, 1–8 (2005). 15/19
2005
-
[26]
& Patton, J
Pai, Y .-C. & Patton, J. Center of mass velocity-position predictions for balance control.J. Biomech. 30, 347 – 354, DOI: https://doi.org/10.1016/S0021-9290(96)00165-0 (1997)
1997 doi
-
[27]
& Corbeil, P
Simoneau, M. & Corbeil, P. The effect of time to peak ankle torque on balance stability boundary: experimental validation of a biomechanical model. Exp. Brain Res. 165, 217–228, DOI: 10.1007/s00221-005-2290-1 (2005)
2005 doi
-
[28]
& Chou, L.-S
Fujimoto, M. & Chou, L.-S. Dynamic balance control during sit-to-stand movement: An examination with the center of mass acceleration. J. Biomech. 45, 543 – 548, DOI: https://doi.org/10.1016/j.jbiomech.2011.11.037 (2012)
2012 doi
-
[29]
& Studenski, S
Hughes, M., Weiner, D., Schenkman, M., Long, R. & Studenski, S. Chair rise strategies in the elderly. Clin. Biomech. 9, 187 – 192, DOI: https://doi.org/10.1016/0268-0033(94)90020-5 (1994)
1994 doi
-
[30]
Krebs, D
Riley, P., E. Krebs, D. & A. Popat, R. Biomechanical analysis of failed sit-to-stand. In IEEE Transactions on Rehabilitation Engineering, vol. 5, 353–9 (1998)
1998
-
[31]
& Vasudevan, R
Shia, V ., Moore, T., Holmes, P., Bajcsy, R. & Vasudevan, R. Stability basin estimates fall risk from observed kinematics, demonstrated on sit-to-stand task. J. Biomech. (2018)
2018
-
[32]
C-Motion Inc., Germantown, MD, USA
Visual3D. C-Motion Inc., Germantown, MD, USA
-
[33]
The MathWorks, Natick, MA, USA
MATLAB Statistics and Machine Learning Toolbox (2017). The MathWorks, Natick, MA, USA
2017
-
[34]
Winter, D. A. Biomechanics and Motor Control of Human Movement (John Wiley & Sons, 2005)
2005
-
[35]
& Cappozzo, A
Papa, E. & Cappozzo, A. A telescopic inverted-pendulum model of the musculo-skeletal system and its use for the analysis of the sit-to-stand motor task. J. Biomech. 32, 1205 – 1212, DOI: https://doi.org/10.1016/S0021-9290(99)00103-7 (1999)
1999 doi
-
[36]
The relative roles of feedforward and feedback in the control of rhythmic movements
Kuo, A. The relative roles of feedforward and feedback in the control of rhythmic movements. Mot. control 6, 129–145 (2002)
2002
-
[37]
Optimality principles in sensorimotor control
Todorov, E. Optimality principles in sensorimotor control. Nat. Neurosci. 7, 907–915, DOI: 10.1038/nn1309 (2004)
2004 doi
-
[38]
Winter, D. A. The Biomechanics and Motor Control of Human Gait: Normal, Elderly and Pathological (Waterloo Biomechanics, 1991)
1991
-
[39]
& Buss, M
Althoff, M., Stursberg, O. & Buss, M. Reachability analysis of nonlinear systems with uncertain parameters using conservative linearization. In 2008 47th IEEE Conference on Decision and Control, 4042–4048, DOI: 10.1109/CDC.2008. 4738704 (2008)
2008 doi
-
[40]
& Krogh, B
Stursberg, O. & Krogh, B. H. Efficient representation and computation of reachable sets for hybrid systems. In Hybrid Systems: Computation and Control, 482–497, DOI: 10.1007/3-540-36580-X_35 (Springer Berlin Heidelberg, Berlin, Heidelberg, 2003)
-
[41]
An introduction to CORA 2015
Althoff, M. An introduction to CORA 2015. In Applied Verification for Continuous and Hybrid Systems, 120–151 (2015)
2015
-
[42]
& Grebenyuk, D
Althoff, M. & Grebenyuk, D. Implementation of interval arithmetic in CORA 2016. In Applied Verification for Continuous and Hybrid Systems, 91–105 (2016)
2016
-
[43]
& Rodman, L
Lancaster, P. & Rodman, L. The Algebraic Riccati Equation, vol. 14 (1995)
1995
-
[44]
& Chou, L.-S
Fujimoto, M. & Chou, L.-S. Region of stability derived by center of mass acceleration better identifies individuals with difficulty in sit-to-stand movement. Annals Biomed. Eng. 42, 733–741, DOI: 10.1007/s10439-013-0945-9 (2014)
2014 doi
-
[45]
& Srinivasan, M
Wang, Y . & Srinivasan, M. Stepping in the direction of the fall: the next foot placement can be predicted from current upper body state in steady-state walking. Biol. Lett. 10, 20140405, DOI: 10.1098/rsbl.2014.0405 (2014). https:// royalsocietypublishing.org/doi/pdf/10.1098/r...
2014
-
[46]
Park, S., Horak, F. B. & Kuo, A. D. Postural feedback responses scale with biomechanical constraints in human standing. Exp. Brain Res. 154, 417–427, DOI: 10.1007/s00221-003-1674-3 (2004)
2004 doi
-
[47]
& Sheikh, Y
Cao, Z., Simon, T., Wei, S.-E. & Sheikh, Y . Realtime multi-person 2D pose estimation using part affinity fields. InCVPR (2017)
2017
-
[48]
Derivation of formulae used to calculate energy expenditure in man
M Brockway, J. Derivation of formulae used to calculate energy expenditure in man. Clin. Nutr. 41, 463–71 (1987)
1987
-
[49]
& David Remy, C
R Koller, J., Gates, D., Ferris, D. & David Remy, C. ’body-in-the-loop’ optimization of assistive robotic devices: A validation study. In Robotics: Science and Systems, DOI: 10.15607/RSS.2016.XII.007 (2016)
2016 doi
-
[50]
National Instruments
LabVIEW. National Instruments. 16/19 A Generating cable pull perturbations Two high-torque motors were attached to cable-pulley systems and placed in front of and behind the test platform. The cables were attached to a belt around the subject’s waist, and the height of the pul...
-
[51]
Manually segment each trial, starting several seconds before the subject begins to stand and ending several seconds after they have reached standing
-
[52]
(b) Average the subject’s five nominal trials together to form a single average nominal COM position trajectory
To create an average nominal trial: (a) Take the manual segmentations of the subject’s five nominal trials, and align their COM position trajectories such that the times at which the peak horizontal COM velocities occur are coincident. (b) Average the subject’s five nominal tria...
-
[53]
nominal traj
To segment each trial: 17/19 Raw nominal data Average nominal trajectory align peaks Raw data to segment Best scaled avg. nominal traj. Scaled avg. nominal traj. Best scaled avg. nominal traj. Figure 10. This figure illustrates the segmentation procedure. Step 2(b) of the proce...
-
[54]
Let Tmin = 0.75s and Tmax = 1.5Tnom
To segment each QS trial: 18/19 (a) Iterate over times T∈ [Tmin,Tmax], where the interval is discretized into 100 samples. Let Tmin = 0.75s and Tmax = 1.5Tnom. (b) Rescale the average nominal trajectory to be defined over [0,T ]. (c) Manually align the scaled average nominal tr...
Reviewed August 14, 2026 · model on record in the stance chip above.
Discussion (0). Continue with ORCID to comment.