REVIEW 2 major objections 4 minor 35 references
Analytical Performance Models for NoCs with Multiple Priority Traffic Classes
T0 review · 2 major / 4 minor · reviewed 2026-08-14 · deepseek-v4-flash
Pith's one-line read This paper claims that priority-aware NoC latency can be computed analytically by decomposing the network into independent queues with modified service times, matching cycle-accurate simulation to about 97% accuracy and speeding up…
desk verdict A legitimate new step for priority-aware NoC analytical models, but the headline 97% accuracy is conditional on an unvalidated independence assumption in the service-rate transformation and a calibrated residual time. read the letter →
The pith
A machine-rendered reading of the paper's core claim, the machinery that carries it, and where it could break.
The reading
What carries the argument
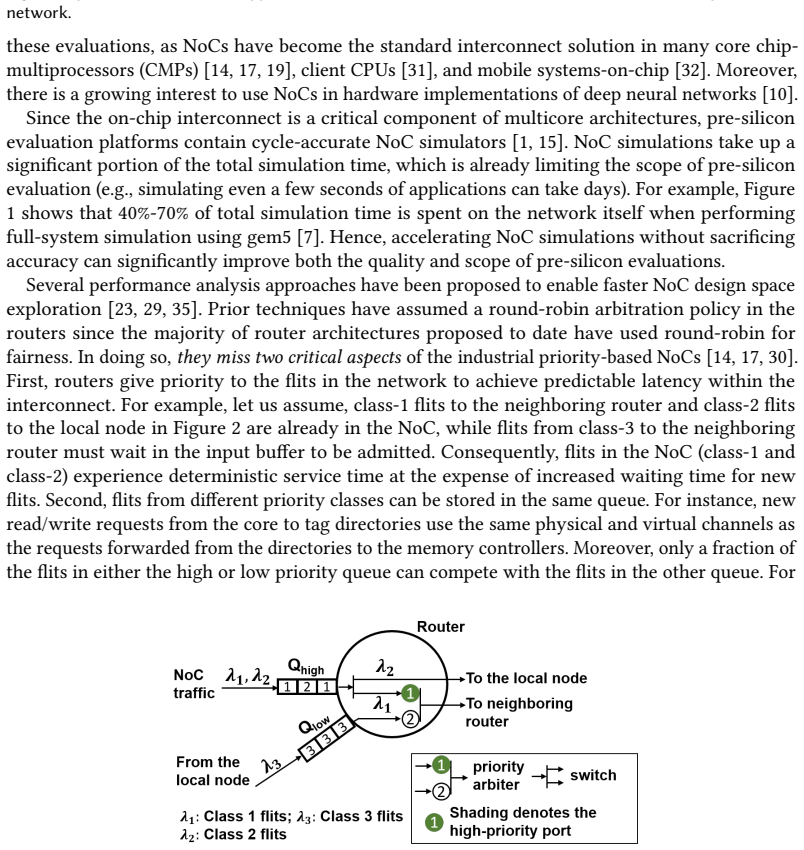
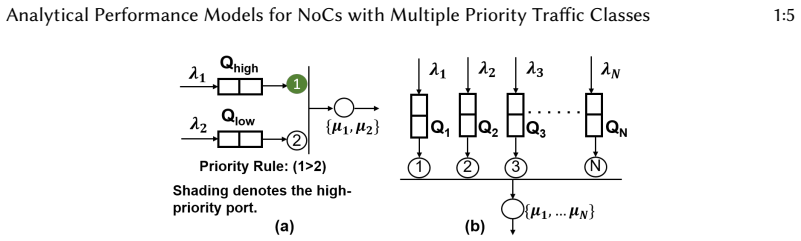
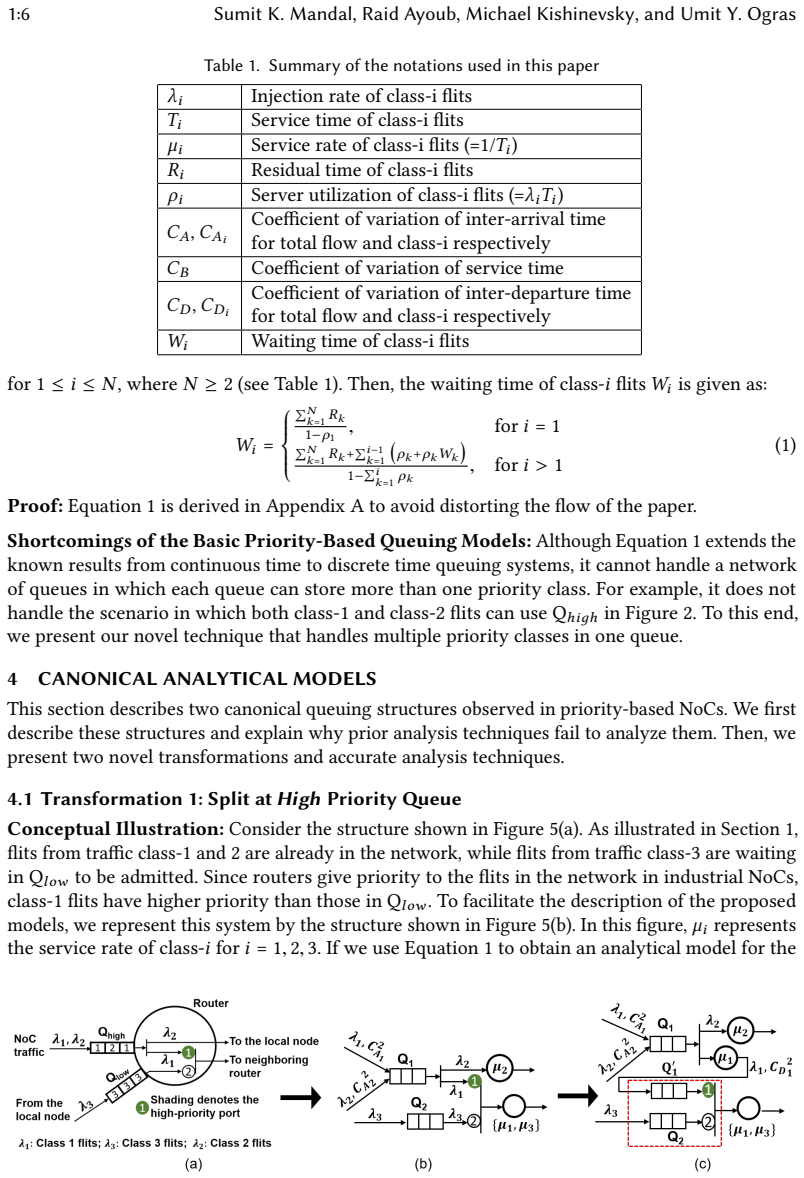
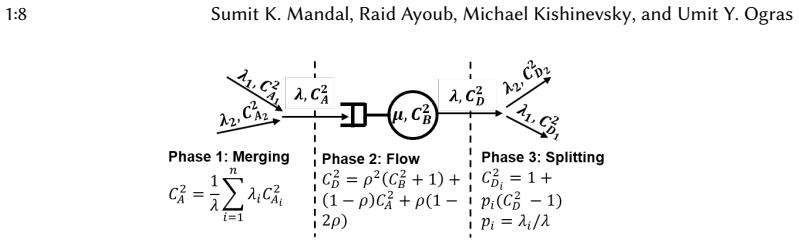
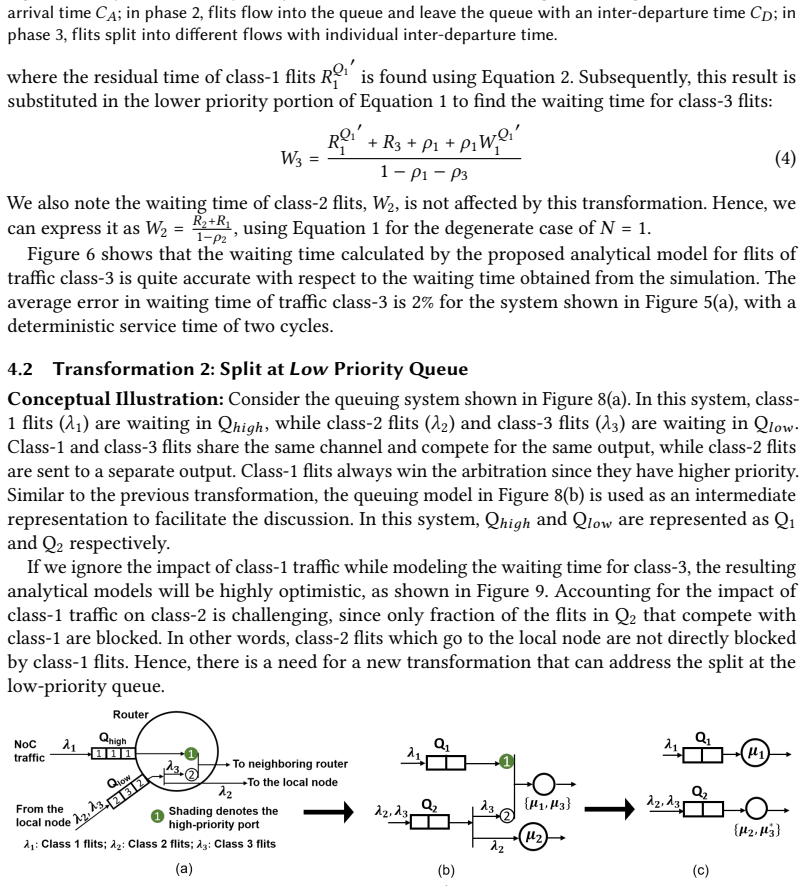
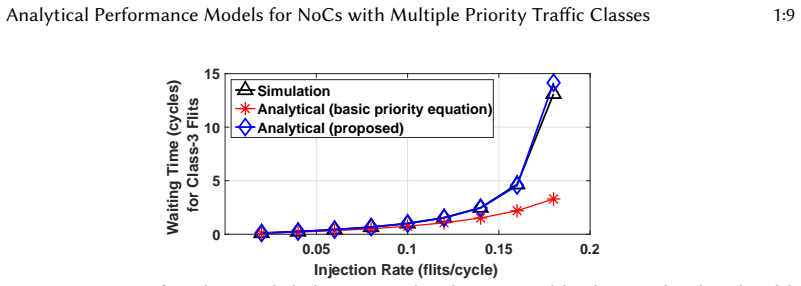
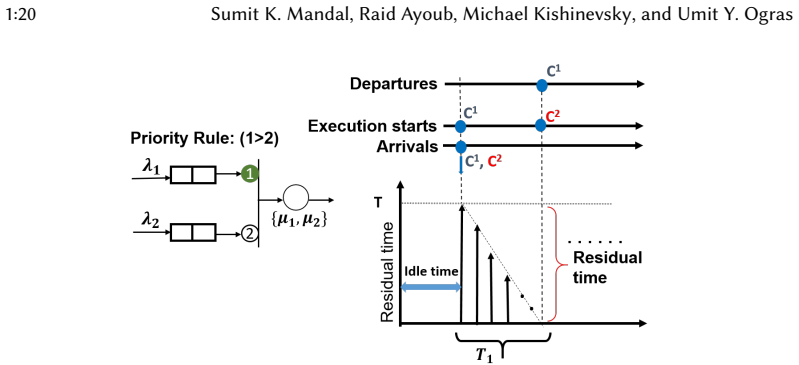
The central objects are two canonical queuing structures and two transformations that turn them into standard priority queues. The structural transformation (split at high priority queue) decomposes traffic at a high-priority queue by computing the coefficient of variation of class-1 inter-departure time via the input-traffic decomposition of [9], then treating the remaining two-class structure as a basic priority queue whose waiting times are given by the paper's Lemma 1. The service-rate transformation (split at low priority queue) modifies the service time and residual time of a low-priority class to account for blocking by a higher-priority class: class-3's service time becomes $T_3^* = T_3 + T_1 p/(1-p)$ with $p = \rho_1 + \lambda_1 R_3$, and its residual time $R_3^*$ is set by equating the two ways of computing $W_3$ (Equation 6 and Equation 10). Algorithm 1 iterates these two transformations over all queues and classes to produce the end-to-end waiting-time expression. The machinery is what carries the argument: it converts a messy network of shared priority queues into independent Geo/G/1 queues, each solvable by the closed-form waiting-time formula in Lemma 1.
What would settle it
Compare the proposed analytical model against a cycle-accurate simulator on the two-queue split-at-low-priority structure (Figure 8a) using a bursty class-1 arrival process, such as alternating high-injection and low-injection periods at the same average rate. If the predicted class-3 waiting time from Equation 12 deviates from simulation by more than the few percent reported for geometric traffic, the independence assumption in Transformation 2 is the cause.
Extended reading notes
Core claim
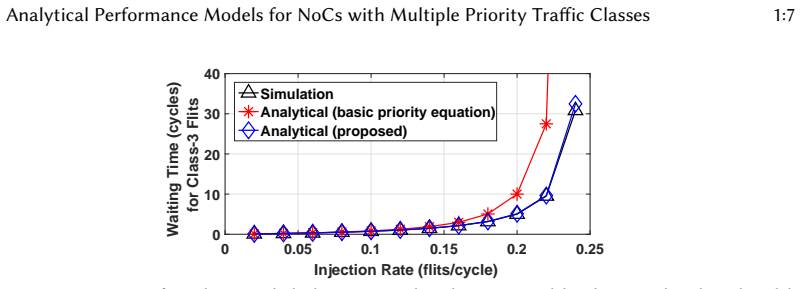
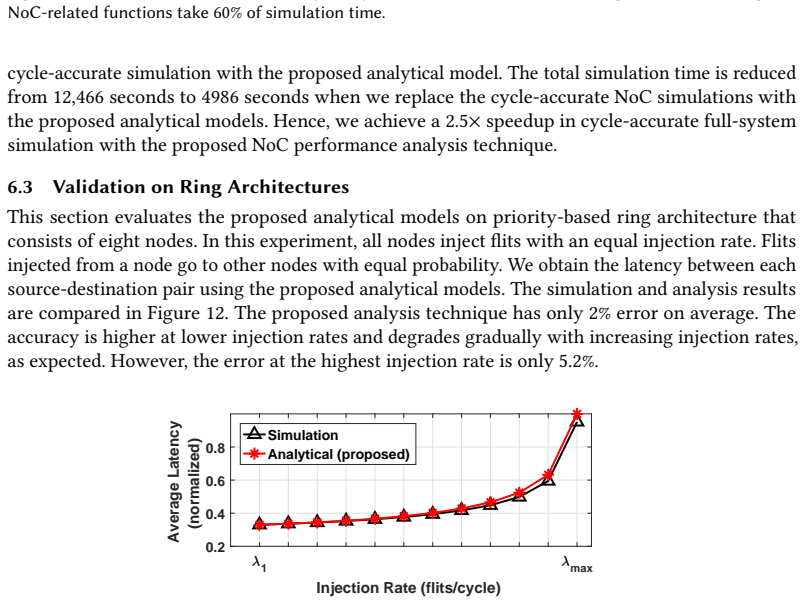
The paper's central claim is that priority-aware NoC latency reduces to a per-class waiting-time formula in which each shared queue has been replaced by an equivalent queue with modified service-time statistics. Transformation 1 (split at high priority queue) handles the case where two classes share a high-priority queue and one of them leaves at a separate output; it uses the first two moments of the inter-departure time of the competing class so that the remaining structure becomes a standard priority queue. Transformation 2 (split at low priority queue) handles the case where a low-priority class shares its output with a higher-priority class; it inflates the low-priority service time by the expected extra busy period caused by higher-priority blocking, $T_3^* = T_3 + \Delta T_3$ with $\Delta T_3 = T_1 p/(1-p)$ for $p = \rho_1 + \lambda_1 R_3$. An iterative algorithm applies these transformations queue-by-queue to produce closed-form end-to-end latency for each traffic class. The paper evaluates this recipe on ring and mesh NoCs and on an industrial server processor floorplan, reporting average accuracy of 97% versus cycle-accurate simulation and up to 2.5x speedup in full-system simulation. The claim, in short: priority arbitration in an NoC can be modeled as a network of independent Geo/G/1 queues with modified service times, without losing the accuracy needed for design-space exploration.
Load-bearing premise
The whole calculation rests on treating each block of a low-priority flit as an independent, memoryless event; if real traffic comes in bursts, so that one block tends to follow another, the predicted waiting times for lower-priority classes will be too low.
Editorial extensions
If this is right
- For any NoC with priority arbitration and multiple traffic classes, end-to-end latency per class can be computed from injection rates, topology, and routing alone, without cycle-by-cycle simulation.
- The same two transformations can be applied iteratively to arbitrary ring and 2D-mesh topologies, so the method scales to the 64-router mesh whose 4096 source-destination pairs would be intractable for probability-generating-function approaches.
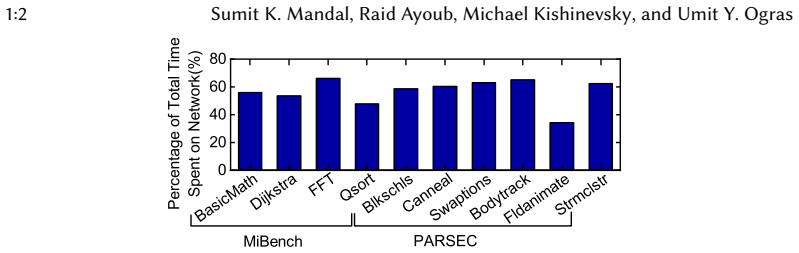
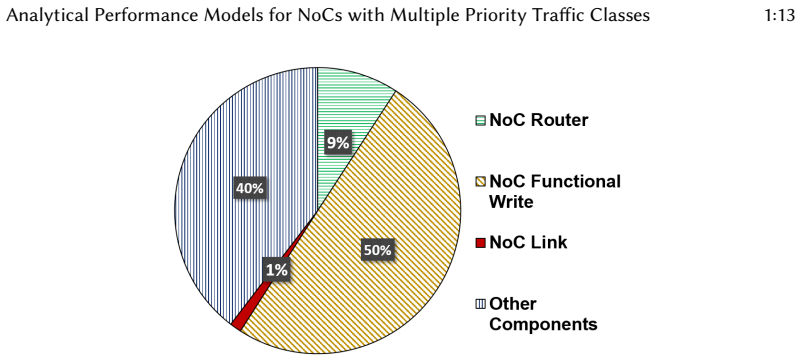
- Since network simulation takes 40-70% of total full-system simulation time, replacing it with the analytical model shortens full-system runtime by up to 2.5x, giving designers more simulations per day.
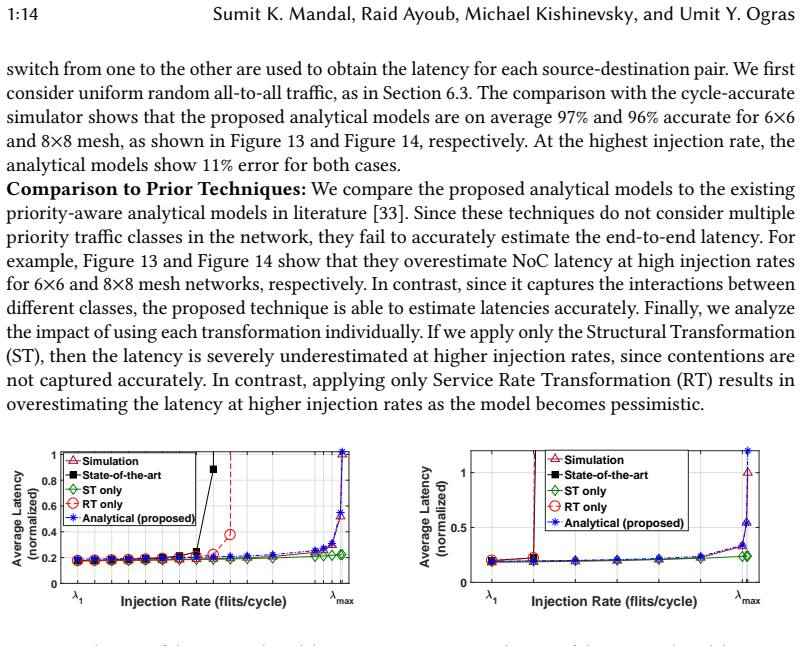
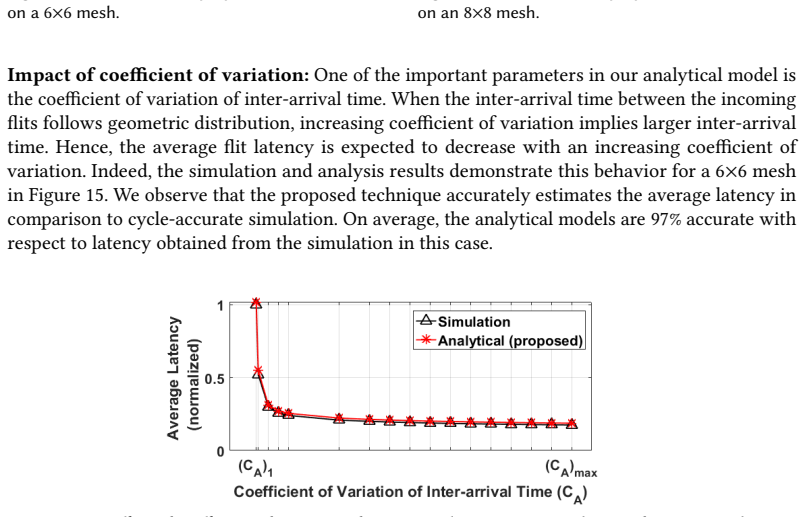
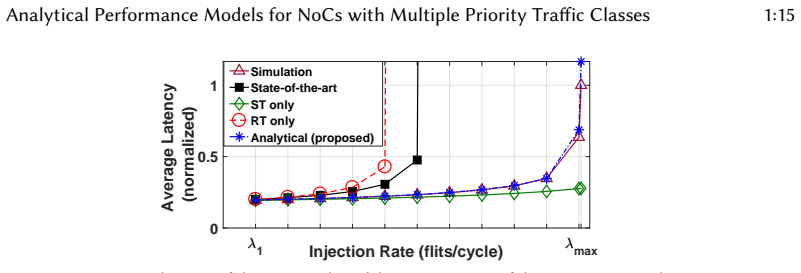
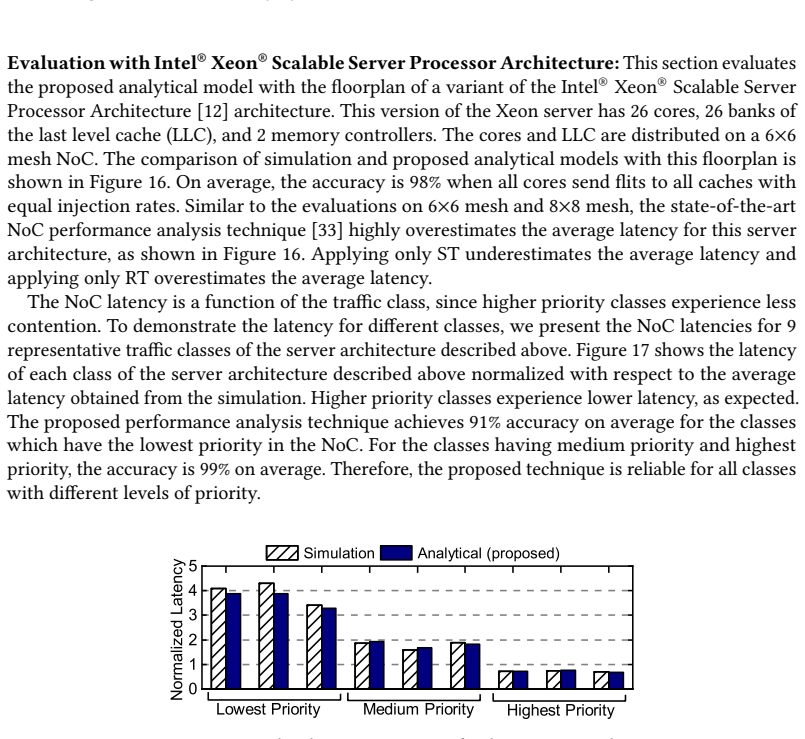
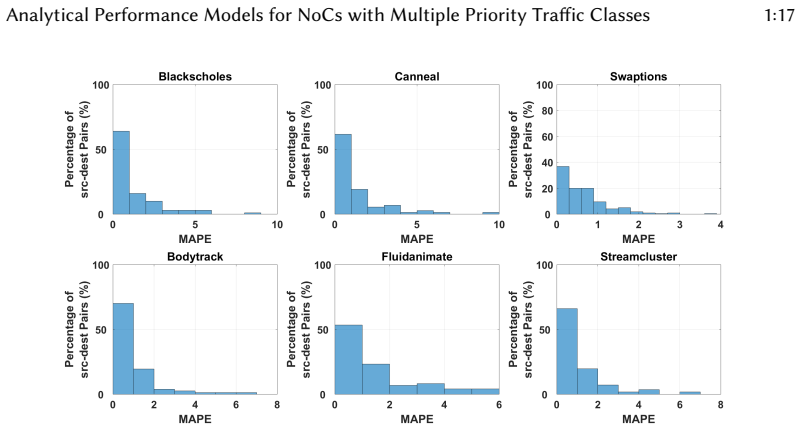
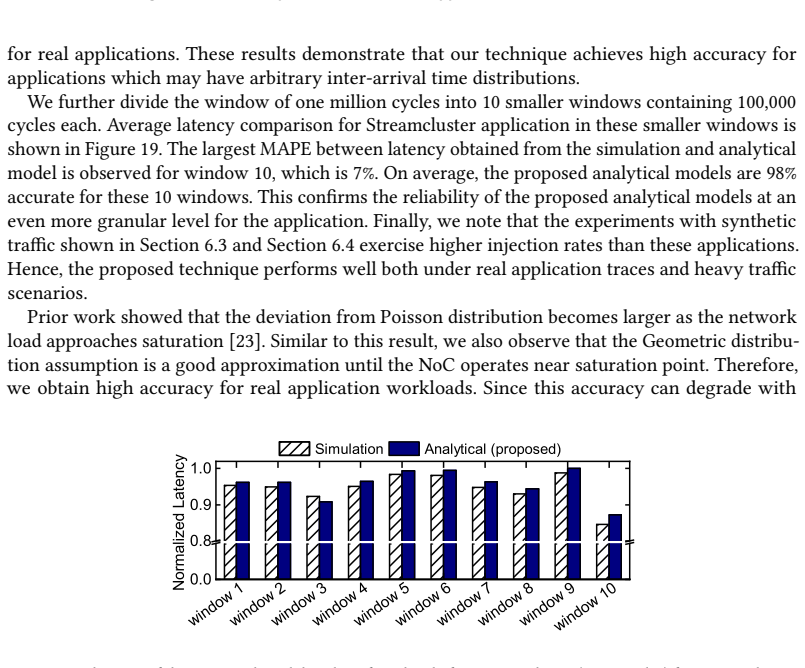
- Accuracy holds across cache-coherency traffic at different cache hit rates (around 96-99% on the address and data networks) and across real application traces, with average error around 3%, though error grows near saturation (up to 11% at the highest injection rates).
Reading between the lines
- A natural test of the paper's idea is to relax the geometric inter-arrival assumption: replace the fixed per-class injection rate with burstiness parameters estimated from traces, and recompute p and the modified service time. The paper leaves that as future work, but the two transformations are stated in terms of moments, so they could plausibly accept burstier inputs.
- The same decompose-the-queue, inflate-the-lower-priority-service-time recipe could be applied to other shared-server arbitration policies, such as weighted round-robin or reservation-based bandwidth, by redefining p as the probability that a flit is blocked by a competing flow; the paper makes no such claim.
- The speedup number depends on the workload: if the network consumes only the low end of the reported 40-70% of simulation time, the expected full-system speedup from replacing the NoC simulator would be closer to 1.5x than 2.5x.
- Because the paper validates on a particular industrial architecture and a few real applications, the strongest test of generality is to run the same two transformations on other production NoC floorplans and traffic mixes; that test is not reported in the paper.
Signed reviews
Editorial analysis
A structured set of objections, weighed in public.
Referee Report
Summary. The paper proposes an analytical performance modeling framework for priority-based networks-on-chip (NoCs) with multiple traffic classes sharing queues. The authors identify two canonical queuing structures that arise in industrial priority-based NoCs and introduce two transformations: a structural transformation that splits traffic at a high-priority queue, and a service-rate transformation that modifies the service time and residual time of lower-priority classes to account for blocking by higher-priority traffic. They also present an iterative algorithm that applies these transformations to decompose an arbitrary NoC into independent queues and compute end-to-end latencies per traffic class. The approach is validated against a cycle-accurate industrial simulator on ring and mesh topologies, a server-like floorplan, and PARSEC application traces, reporting about 97% average accuracy and up to 2.5x speedup of full-system simulation when replacing the cycle-accurate NoC simulation with the analytical model.
Significance. If the reported accuracy and speedup hold, this is a valuable contribution to pre-silicon evaluation of industrial NoCs, where priority arbitration and multiple traffic classes in the same queue are common but prior analytical models either assume fair arbitration or do not handle multi-class queues. The paper provides complete derivations for the discrete-time Geo/G/1 waiting-time formulas (Lemma 1 and Appendix A), a systematic decomposition algorithm, and extensive validation on realistic architectures and workloads. The two-moment decomposition for the structural transformation is standard and well grounded. The service-rate transformation is more heuristic: it calibrates the modified residual time on a special case (lambda2 = 0) rather than deriving it from first principles, and it relies on an independence assumption for blocking runs that is not directly tested. These caveats affect the generality of the central 97% accuracy claim but do not invalidate the overall approach, which can likely be strengthened with additional validation and clearer statement of assumptions.
major comments (2)
- [Section 4.2, Eq. (11)] The derivation of the additional busy period DeltaT3 assumes that each time a class-3 flit is blocked by class-1 traffic, the blocking events are independent and geometrically distributed with probability p = rho1 + lambda1*R3. This is a load-bearing assumption: DeltaT3 enters the modified service time T*3, the utilization rho*3, and the residual time R*3 in Eqs. (9)-(11), and these in turn determine the predicted waiting times W2 and W3 in Eq. (12). The paper does not test this assumption under bursty or correlated arrival processes, even though real application traffic is known to deviate from geometric inter-arrival times (as the authors themselves note in Section 3.2 and Section 6.5). The reported results already show accuracy degradation near saturation (11% error at the highest injection rate for 6x6 and 8x8 meshes in Section 6.4, and 93.9% accuracy for the data network at 100% LLC hit rate in Table 2), which is consistent with the Geo/G/1 assumption breaking down. The authors should either add a validation experiment with bursty/correlated traffic to support the independence assumption, or explicitly characterize the traffic conditions under which the geometric blocking model is expected to be accurate.
- [Section 4.2, Eq. (11)] The calibration of R*3 in Eq. (11) is a model-fitting step, not a derivation. The paper should highlight this and distinguish the calibrated prediction from the independently derived parts of the model. The current presentation gives the impression that R*3 is derived from the Geo/G/1 residual-time theory, when in fact it is chosen to match a known special case. This distinction matters for assessing the strength of the 97% accuracy claim.
minor comments (4)
- [Algorithm 1] In Algorithm 1, the reference waiting time W_ref is computed using Eq. 6, but Eq. 6 is specific to the two-class case. The algorithm should explain how this expression generalizes when more than one higher-priority class is present, or specify that the same form is used with sums over higher-priority classes.
- [Abstract and Section 6.4] The text in Section 6.4 says 'the proposed analytical models are on average 97% and 96% accurate' for the two mesh sizes, but the abstract and introduction state '97% accuracy' without this qualification. Please make the reported accuracy ranges explicit in the summary of results.
- [Appendix A] Equation (16) and the line following it introduce the discrete-time correction rho1; please add a sentence explaining that this term arises from the boundary of the summation for class-1 residual time, to make the derivation self-contained.
- [General] The manuscript contains a few instances where Cyrillic characters appear in English text (e.g., 'Q hiдh' in Section 3.2) and some figure labels are difficult to read. These should be corrected for a polished final version.
Circularity Check
Partial local calibration in Eq. 11 defines R*3 by construction, but the central 97%-accuracy claim rests on independent cycle-accurate simulation comparisons.
-
self definitional
[Section 4.2, Transformation 2, Equations (10)-(11)]
"When λ2 is set to zero, this expression should give the class-3 waiting time W3|λ2=0 found in Equation 6. Hence, we can find the following expression for R∗3 by combining Equation 6 and Equation 10: R∗3 = (1− ρ∗3)(W3|λ2=0 − ∆T3) (11)"
The modified residual time R*3 is not obtained from an independent analysis of the modified service process; it is defined as the value that forces the transformed Geo/G/1 formula in Eq. 10 to reproduce the paper's own waiting-time formula, Eq. 6, in the λ2=0 special case. Therefore, the statement that the transformed model 'should give' Eq. 6 is true by construction, and any validation of the model in that λ2=0 special case would be circular. The circularity is local: the nonzero-λ2 predictions of W2 and W3 in Eq. 12 are not forced by this definition, and the paper's headline 97% accuracy is an independent empirical comparison against cycle-accurate simulation, not a consequence of the calibration.
full rationale
The paper's central claim—97% accuracy versus cycle-accurate simulation and 2.5x full-system speedup—is an external, falsifiable comparison: no model parameter is fitted to the Garnet2.0/SystemC simulation data used in Section 6. The only by-construction step occurs in Transformation 2, where Eq. 11 defines R*3 as the value that makes the modified-service Geo/G/1 expression reproduce the paper's own discrete-time priority waiting-time formula (Eq. 6) when λ2=0. Thus the λ2=0 case is a consistency condition rather than an independent prediction; this is a mild calibration step, not a statistical fit to measured data. The subsequent predictions for nonzero λ2 in Eq. 12 use this calibrated R*3 together with the geometric blocking-run ansatz of Eqs. 7-8, so they retain genuine predictive content. The self-citations [23]-[25] are used only as caveats or as references to the in-house simulator, not to justify the transformations. The geometric i.i.d. blocking assumption near saturation is a correctness risk, not a circularity, because it is not obtained by assuming the conclusion. Overall, the derivation is largely self-contained, with a single local calibration that does not undermine the externally validated accuracy claim.
Assumptions & free parameters
assumptions (5)
- domain assumption Flit inter-arrival times follow a geometric distribution (Geo/G/1 model)
- domain assumption The first two moments (mean and squared coefficient of variation) of inter-arrival and inter-departure processes are sufficient to characterize traffic in the structural transformation
- ad hoc to paper Blocking of a low-priority class-3 flit by high-priority class-1 traffic occurs as independent geometric events with probability p = rho1 + lambda1*R3
- domain assumption Nonpreemptive priority arbitration: flits already in the network have priority over newly injected flits, and higher-class flits always win arbitration
- domain assumption Steady-state and stationarity of traffic; injections are throttled by outstanding-request credits so interface blocking can be ignored
invented entities (2)
-
Virtual queue Q1' in the structural transformation
-
Modified service time T*3 and residual time R*3 in the service rate transformation
Cite this review
Pith. "Pith review of Analytical Performance Models for NoCs with Multiple Priority Traffic Classes." pith.science (2026). https://pith.science/paper/7QKHNFMP
@misc{pith2026190802408,
  author       = {Pith},
  title        = {Pith review of: Analytical Performance Models for NoCs with Multiple Priority Traffic Classes},
  year         = {2026},
  howpublished = {\url{https://pith.science/paper/7QKHNFMP}},
  note         = {Machine review of arXiv:1908.02408}
}
read the original abstract
Networks-on-chip (NoCs) have become the standard for interconnect solutions in industrial designs ranging from client CPUs to many-core chip-multiprocessors. Since NoCs play a vital role in system performance and power consumption, pre-silicon evaluation environments include cycle-accurate NoC simulators. Long simulations increase the execution time of evaluation frameworks, which are already notoriously slow, and prohibit design-space exploration. Existing analytical NoC models, which assume fair arbitration, cannot replace these simulations since industrial NoCs typically employ priority schedulers and multiple priority classes. To address this limitation, we propose a systematic approach to construct priority-aware analytical performance models using micro-architecture specifications and input traffic. Our approach consists of developing two novel transformations of queuing system and designing an algorithm which iteratively uses these two transformations to estimate end-to-end latency. Our approach decomposes the given NoC into individual queues with modified service time to enable accurate and scalable latency computations. Specifically, we introduce novel transformations along with an algorithm that iteratively applies these transformations to decompose the queuing system. Experimental evaluations using real architectures and applications show high accuracy of 97% and up to 2.5x speedup in full-system simulation.
Figures
Figures from the paper (16 more)

Reference graph
Works this paper leans on
-
[20]
A. E. Kiasari, Z. Lu, and A. Jantsch. An Analytical Latency Model for Networks-on-Chip. IEEE Trans. on Very Large Scale Integration (VLSI) Systems , 21(1):113–123, 2013
work page 2013
-
[1]
N. Agarwal et al. GARNET: A Detailed on-chip Network Model Inside a Full-system Simulator. In 2009 IEEE intl. symp. on performance analysis of systems and software , pages 33–42
work page 2009
-
[2]
I. Awan and R. Fretwell. Analysis of Discrete-Time Queues with Space and Service Priorities for Arbitrary Arrival Processes. In Parallel and Distributed Systems. Proc. 11th Intl Conf. on , volume 2, pages 115–119, 2005
work page 2005
-
[3]
A. Bartolini et al. A Virtual Platform Environment For Exploring Power, Thermal And Reliability Management Control Strategies In High-Performance Multicores. In Proc. of the Great lakes Symp. on VLSI , pages 311–316, 2010
work page 2010
-
[4]
A. W. Berger and W. Whitt. Workload Bounds in Fluid Models with Priorities. Performance evaluation, 41(4):249–267, 2000
work page 2000
-
[5]
D. P. Bertsekas, R. G. Gallager, and P. Humblet. Data Networks, volume 2. Prentice-Hall International New Jersey, 1992
work page 1992
- [6]
-
[7]
N. Binkert et al. The Gem5 Simulator. SIGARCH Comp. Arch. News, May. 2011
work page 2011
Show all 35 references
-
[8]
Bogdan and R
P. Bogdan and R. Marculescu. Non-stationary Traffic Analysis and its Implications on Multicore Platform Design. IEEE Trans. on Computer-Aided Design of Integrated Circuits and Systems , 30(4):508–519, 2011
2011
-
[9]
Bolch, S
G. Bolch, S. Greiner, H. De Meer, and K. S. Trivedi. Queueing Networks and Markov Chains: Modeling and Performance Evaluation with Computer Science Applications . John Wiley & Sons, 2006
2006
-
[10]
Choi et al
W. Choi et al. On-Chip Communication Network for Efficient Training of Deep Convolutional Networks on Heteroge- neous Manycore Systems. IEEE Trans. on Computers , 67(5):672–686, 2017
2017
-
[11]
A. C. de Melo. The New Linux Perf Tools. In Linux Kongress, volume 18, 2010
2010
-
[12]
Doweck et al
J. Doweck et al. Inside 6th-generation Intel Core: New Microarchitecture Code-named Skylake. IEEE Micro, (2):52–62, 2017
2017
-
[13]
Ikehara and M
S. Ikehara and M. Miyazaki. Approximate Analysis of Queueing Networks with Nonpreemptive Priority Scheduling. In Proc. 11th Int. Teletraffic Congr
-
[14]
Jeffers, J
J. Jeffers, J. Reinders, and A. Sodani. Intel Xeon Phi Processor High Performance Programming: Knights Landing Edition . Morgan Kaufmann, 2016
2016
-
[15]
Jiang et al
N. Jiang et al. A Detailed and Flexible Cycle-accurate Network-on-chip Simulator. In 2013 IEEE Intl. Symp. on Performance Analysis of Systems and Software (ISPASS) , pages 86–96
2013
-
[16]
Jin and G
X. Jin and G. Min. Modelling and Analysis of Priority Queueing Systems with Multi-class Self-similar Network Traffic: a Novel and Efficient Queue-decomposition Approach. IEEE Trans. on Communications , 57(5), 2009
2009
-
[17]
J. A. Kahle et al. Introduction to the Cell multiprocessor. IBM journal of Research and Development , 49(4.5):589–604, 2005
2005
-
[18]
Kashif and H
H. Kashif and H. Patel. Bounding Buffer Space Requirements for Real-time Priority-aware Networks. In Asia and South Pacific Design Autom. Conf. , pages 113–118, 2014
2014
-
[19]
C. N. Keltcher, K. J. McGrath, A. Ahmed, and P. Conway. The AMD Opteron Processor for Multiprocessor Servers. IEEE Micro, 23(2):66–76, 2003
2003
-
[21]
Leupers et al
R. Leupers et al. Virtual Manycore platforms: Moving towards 100+ processor cores. In Proc. of DATE, pages 1–6, 2011
2011
-
[22]
P. S. Magnusson et al. Simics: A Full System Simulation Platform. Computer, 35(2):50–58. ACM Transactions on Embedded Computing Systems, Vol. 1, No. 1, Article 1. Publication date: January 2019. Analytical Performance Models for NoCs with Multiple Priority Traffic Classes 1:19
2019
-
[23]
U. Y. Ogras, P. Bogdan, and R. Marculescu. An Analytical Approach for Network-on-Chip Performance Analysis. IEEE Trans. on Computer-Aided Design of Integrated Circuits and Systems , 29(12):2001–2013, 2010
2001
-
[24]
U. Y. Ogras, Y. Emre, J. Xu, T. Kam, and M. Kishinevsky. Energy-Guided Exploration of On-Chip Network Design for Exa-Scale Computing. In Proc. of Intl. Workshop on System Level Interconnect Prediction , pages 24–31, 2012
2012
-
[25]
U. Y. Ogras, M. Kishinevsky, and S. Chatterjee. xPLORE: Communication Fabric Design and Optimization Framework. Developed at Strategic CAD Labs, Intel Corp
-
[26]
P. P. Pande, C. Grecu, M. Jones, A. Ivanov, and R. Saleh. Performance Evaluation and Design Trade-offs for Network- on-Chip Interconnect Architectures. IEEE transactions on Computers , 54(8):1025–1040, 2005
2005
-
[27]
Patel et al
A. Patel et al. MARSS: a Full System Simulator for Multicore x86 CPUs. In Design Autom. Conf., pages 1050–1055, 2011
2011
-
[28]
Y. Qian, Z. Lu, and W. Dou. Analysis of Worst-case Delay Bounds for Best-effort Communication in Wormhole Networks on Chip. In 2009 3rd ACM/IEEE Interl. Symp. on Networks-on-Chip , pages 44–53
2009
-
[29]
Qian et al
Z.-L. Qian et al. A Support Sector Regression (SVR)-based Latency Model for Network-on-Chip (NoC) Architectures. IEEE Trans. on Computer-Aided Design of Integrated Circuits and Systems , 35(3):471–484, 2015
2015
-
[30]
Rico et al
A. Rico et al. ARM HPC Ecosystem and the Reemergence of Vectors. In Proc. of the Computing Frontiers Conf. , pages 329–334. ACM, 2017
2017
-
[31]
Rotem and S
E. Rotem and S. P. Engineer. Intel Architecture, Code Name Skylake Deep Dive: A New Architecture to Manage Power Performance and Energy Efficiency. In Intel Developer Forum, 2015
2015
-
[32]
M. P. Singh and M. K. Jain. Evolution of Processor Architecture in Mobile Phones. Intl. Journ. of Computer Applications, 90(4), 2014
2014
-
[33]
Walraevens
J. Walraevens. Discrete-time Queueing Models with Priorities . PhD thesis, Ghent University, 2004
2004
-
[34]
Wettin et al
P. Wettin et al. Performance Evaluation of Wireless NoCs in Presence of Irregular Network Routing Strategies. In Proc. of the conf. on DATE, page 272, 2014
2014
-
[35]
Wu et al
Y. Wu et al. Analytical Modelling of Networks in Multicomputer Systems under Bursty and Batch Arrival Traffic. The Journ. of Supercomputing, 51(2):115–130, 2010. APPENDIX A Residual time calculation: Residual time is the delay of serving the next flit due to the remaining serv...
2010
Reviewed August 14, 2026 · model on record in the stance chip above.
Discussion (0). Continue with ORCID to comment.