REVIEW 3 major objections 5 minor 39 references
Task-Oriented Optimal Sequencing of Visualization Charts
T0 review · 3 major / 5 minor · reviewed 2026-08-14 · deepseek-v4-flash
Pith's one-line read Task-oriented chart sequencing can be learned from expert demonstrations and matches user preferences in three analysis tasks.
desk verdict A genuinely new IRL-based approach to task-conditioned chart sequencing with real user studies, but a load-bearing inconsistency between Eq. 5 and Eq. 6 means the learned reward may not match the policy that was actually evaluated. read the letter →
The pith
A machine-rendered reading of the paper's core claim, the machinery that carries it, and where it could break.
The reading
What carries the argument
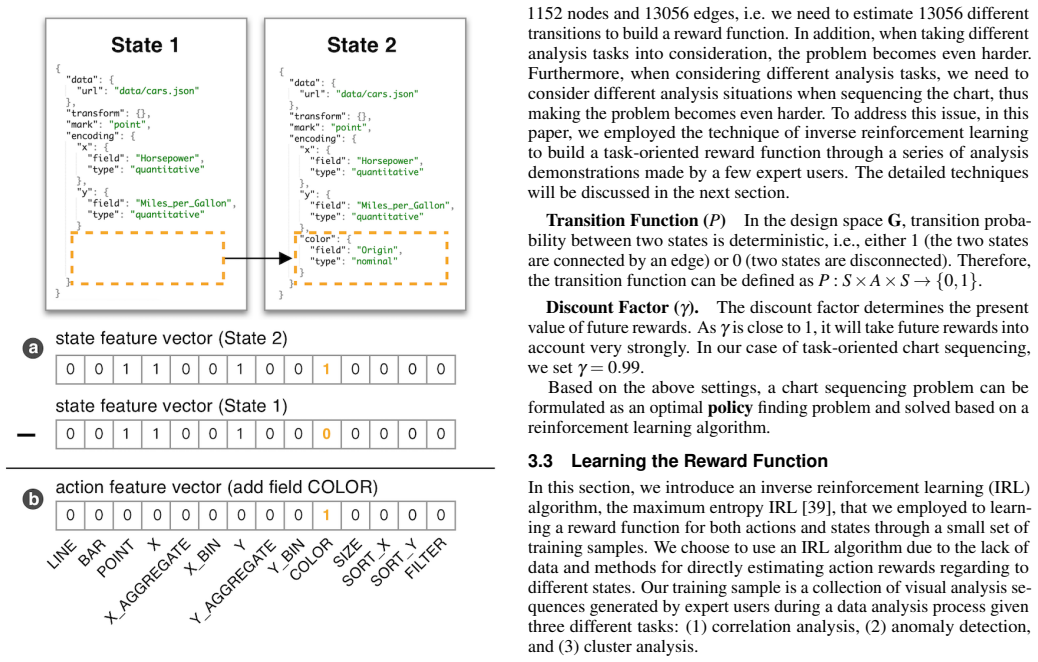
The central object is a Markov decision process laid over the GraphScape design-space graph, where each node is a chart specification encoded as a 14-dimensional one-hot state vector and each edge is an edit action represented by the difference of two state vectors. The reward is learned by maximum-entropy inverse reinforcement learning, which linearly combines state and action rewards with the GraphScape perception cost scaled by $\lambda = 0.3$; optimal sequencing then comes from value iteration over this MDP. The mechanism works by letting expert demonstrations fix the task-relevant ordering of operations while the perception cost keeps transitions readable.
What would settle it
Run the learned policy on held-out expert demonstrations for the same three tasks but datasets with different semantic field types, such as time series versus categorical, and compare the model's next-chart ranking to the experts' choices; if the rank correlation drops far below the reported $\tau_b = 0.64$ or loses significance, the claim that the reward captures task-oriented reasoning is falsified.
Extended reading notes
Core claim
The central claim is that a reward function of the form $R_T(s_{i-1}, a_i, s_i) = (R_T(s_{i-1}) + R_T(a_i)) + \lambda \cdot (-c(a_i))$, with $\lambda = 0.3$, learned by maximum-entropy inverse reinforcement learning from expert demonstrations, is sufficient to rank chart sequences and next-chart actions in a task-oriented way. The paper reports Kendall $\tau_b = 0.64$ and Spearman $\rho = 0.78$ for next-chart recommendations, versus $\tau_b = 0.51$ for the task-only reward and $\tau_b = 0.11$ for a perception-cost-only ranking, and interprets this as evidence that the learned task rewards capture the analytic reasoning users perform.
Load-bearing premise
The load-bearing premise is that analyst preferences about chart order reduce to a linear reward over the 14-dimensional state and action features plus a fixed GraphScape perception cost, so that the policy learned for three chart types and three tasks generalizes to other settings.
Editorial extensions
If this is right
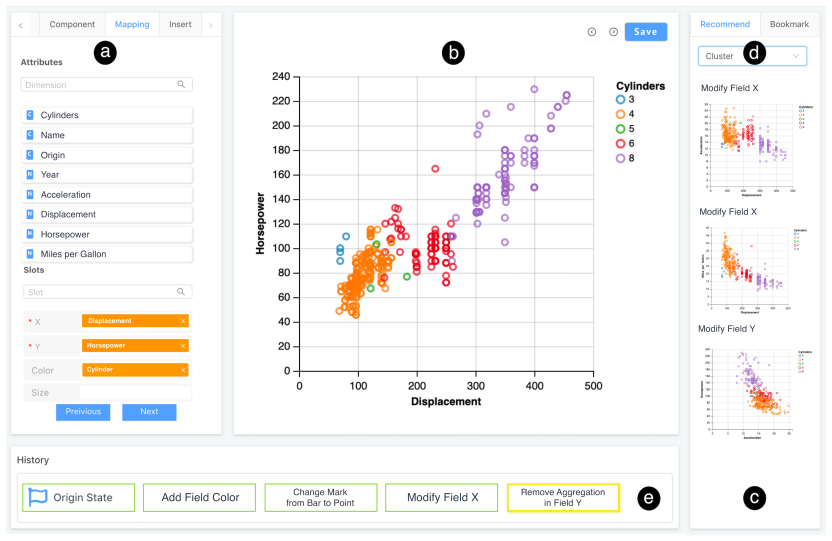
- For a given analysis task, chart sequences can be ranked automatically, so a system can recommend not just a target chart but an ordered path of edits that leads to it.
- Next-chart recommendations that combine task rewards with perception costs align with user preferences more strongly than recommendations based on either factor alone.
- The same reward-learning procedure can be retargeted to other analysis tasks by collecting expert demonstrations for those tasks, since no task-specific hand-coded rules are needed.
- In reasoning and presentation scenarios, the optimal sequence can be used to narrate how a data pattern such as a cluster, anomaly, or correlation was found.
- Task-oriented ranking can serve as a decision aid when multiple chart transitions have equal perception cost.
Reading between the lines
- A natural next test is whether the learned reward transfers across datasets whose semantic fields differ while chart types stay the same; the paper's limitation L2 suggests the authors suspect it may not.
- Because the perception weight $\lambda$ is fixed at 0.3, the framework implies a trade-off curve between analytic fidelity and perceptual continuity; tuning $\lambda$ per scenario could alter the ranking, and this was not explored.
- The Markov assumption means the reward ignores the history of previous charts; sequences that tell a coherent story may require non-Markovian or memory-based rewards.
- The user studies used only three chart types; the same method on richer design spaces may need many more demonstrations, or the one-hot feature representation may need augmentation.
Signed reviews
Editorial analysis
A structured set of objections, weighed in public.
Referee Report
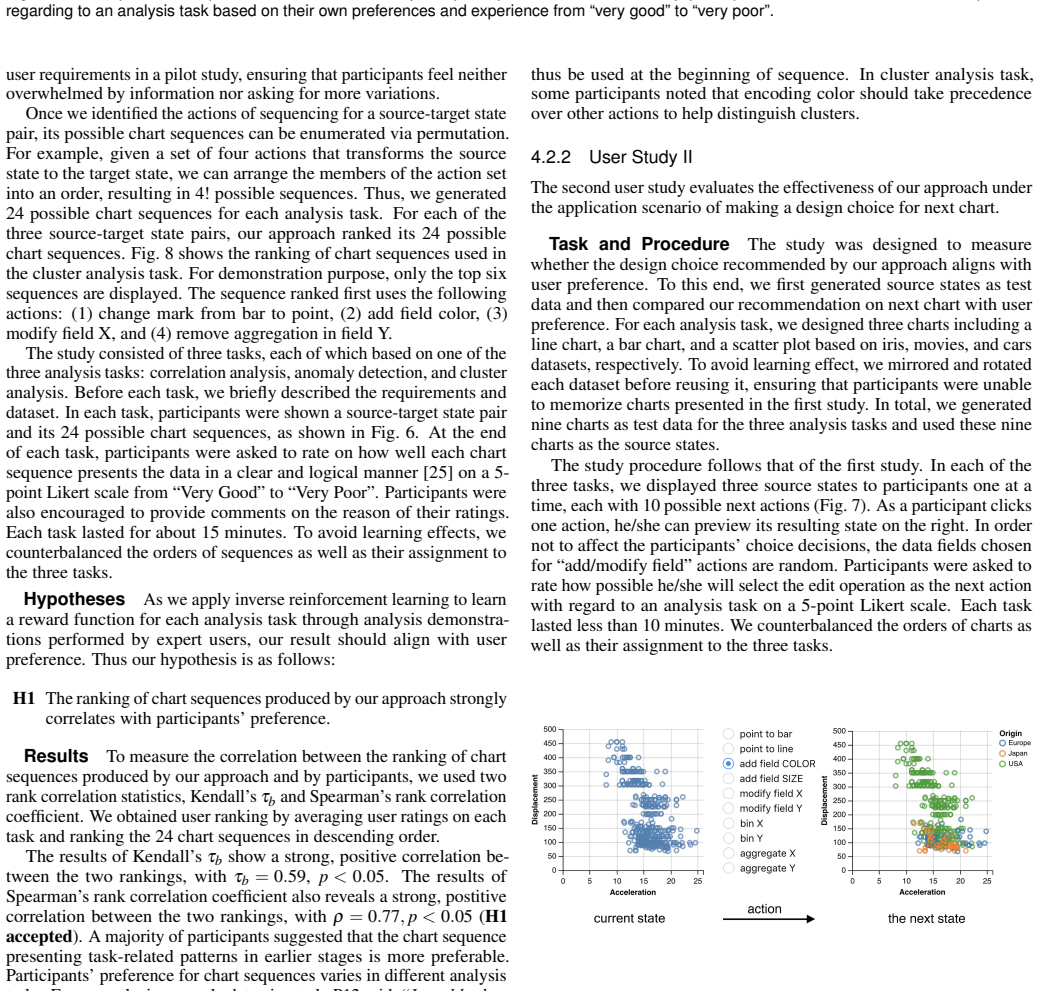
Summary. The paper proposes a task-oriented chart sequencing method. The chart design space (bar, line, and scatter charts) is modeled as a Markov decision process; a reward function is learned via maximum entropy inverse reinforcement learning from a small set of expert demonstrations (60 sequences, 20 each for correlation analysis, anomaly detection, and cluster analysis), augmented with the GraphScape perception cost; an optimal policy is found with value iteration. The method is evaluated by one case study and two user studies with 20 participants. User Study I reports that the method's ranking of chart sequences correlates with averaged user preference (Kendall tau_b = 0.59, Spearman rho = 0.77). User Study II reports that the method's next-chart recommendation correlates with user preference (tau_b = 0.64, rho = 0.78) and, based on point estimates, outperforms Task-Only (tau_b = 0.51) and GraphScape (tau_b = 0.11). The authors conclude that hypotheses H1, H2.1, and H2.2 are accepted.
Significance. The work addresses a real gap: most prior chart-sequencing work considers perception or low-level edit costs, whereas this paper explicitly targets analysis tasks. The authors deserve credit for running controlled user studies with real participants, for evaluating against external user preference rather than only training likelihood, and for candidly acknowledging limitations L1 and L2, especially that the design space is decoupled from the underlying data. If the reward-learning chain is sound, the approach is a useful step toward task-aware visualization recommendation. However, two load-bearing issues currently prevent the paper from supporting its strongest claims: the printed IRL objective and reward function are algebraically inconsistent, and the claimed superiority over baselines is not supported by any statistical test of the difference between correlation coefficients.
major comments (3)
- [§3.3.1, Eq. (5); §3.3.2, Eq. (6)] The IRL objective in Eq. (5) and the reward optimized in Eq. (6) are inconsistent as printed. Eq. (3) defines fa = fs_{t} - fs_{t-1}. Substituting this into Eq. (6), the transition reward telescopes to theta^T fs_i - lambda c(a_i), so the cumulative task reward of a trajectory is effectively a function of the states, with the action feature cancelling. Eq. (5), by contrast, models sequence probability with an exponent that sums theta^T(fs_j + fa_j), which introduces a boundary term theta^T(fs_n - fs_0) and double-counts the final (and, depending on the summation convention, intermediate) states. The maximum-entropy IRL procedure therefore fits theta to a different feature expectation from the one the value-iteration policy optimizes in Eq. (6). Unless Eq. (5) is a typographical error and the implementation used a corrected feature map, the learned theta need not define the policy evaluated in Section 4, and the reported user-study correlations cannot be attributed to the model described in Section 3.3. The paper provides no code or released demonstrations that would allow a reader to resolve this ambiguity.
- [§4.2.2, Table 1 and Results] The claim that "our approach outperforms the two baselines (H2.2 accepted)" is based solely on comparing point estimates of rank-correlation coefficients (0.64 vs. 0.51 vs. 0.11). No test for the difference between correlated correlation coefficients (e.g., Steiger's test), no bootstrap confidence intervals, and no multiple-comparison adjustment are reported. Given that Task-Only achieves tau_b = 0.51 with p = 0.039, the gap between 0.64 and 0.51 may be within sampling variability. The authors should supply a formal significance test of the difference or weaken the superiority claim to a descriptive observation.
- [§4.2.1, Results] The rank correlations are computed against an averaged user ranking, but no inter-rater reliability measure (e.g., Krippendorff's alpha or average pairwise agreement) is reported. Without knowing how much the 20 participants agreed, the strength of the reported correlation with the averaged ranking is difficult to interpret. I would request an inter-rater reliability statistic or a per-participant analysis as supporting evidence.
minor comments (5)
- [§3.3.1, Eq. (4)] The text says "logP(ζi|θ) indicates the entropy of the distribution captured by P(·)"; Eq. (4) is actually a log-likelihood. The connection to the maximum-entropy principle should be stated more carefully.
- [§2.2] There is a typo: "it unables to rank paths" should be "it is unable to rank paths."
- [§4.2.2, Table 1] The GraphScape row is labeled inconsistently ("GraphScape" vs. "GraphSpace" in the hypothesis statement); please unify the naming.
- [§3.2.2] The transition from the Vega-Lite grammar components (11 optional values) to the 14-dimensional one-hot state vector is not fully explained; please clarify how the three component types map to the 14 dimensions.
- [§4.1] The case study reports qualitative "powerful" and "meaningful" feedback from a single expert. This is fine as an illustration, but the language should not imply general effectiveness beyond the two controlled studies.
Circularity Check
No significant circularity: the IRL reward is trained on expert demonstrations and evaluated against independent user preference rankings.
full rationale
The central derivation chain is self-contained and externally evaluated. The reward parameter theta is learned by maximum entropy IRL from 60 expert demonstrations (Section 3.3.3), and the resulting reward in Eq. 6 is used by value iteration to produce sequence/action rankings (Section 3.4). User Study I and II compare those rankings with ratings from 20 participants who did not provide training demonstrations, on chart sequences and next-chart choices that are newly generated for the studies; this is an external benchmark rather than a restatement of the fitted reward. The Task-Only baseline is an explicit ablation and GraphScape is an independent external model, so the comparison also has independent content. GraphScape's perception cost in Eq. 6 is borrowed, not self-cited. There are correctable internal consistency issues between the feature expectation in Eq. 5 and the telescoping reward in Eq. 6 (e.g., the task reward of a transition reduces to theta^T fs_i, so the cumulative task reward is the final-state reward, while the exponent in Eq. 5 interleaves states and actions), but that is a correctness/implementation-fidelity concern, not a circular definition: the paper does not define the learned quantity in terms of the predicted quantity. No fitted parameter is renamed as a prediction, and no load-bearing uniqueness claim is imported from the authors' prior work. Under the rule that an honest non-finding is appropriate when the evaluation is genuinely external, the circularity score is 0.
Assumptions & free parameters
free parameters (3)
- lambda (reward balance weight) =
0.3
- reward weight vector theta =
not reported
- discount factor gamma =
0.99
assumptions (5)
- domain assumption The 14-dimensional one-hot state and action feature representation derived from Vega-Lite grammar is expressive enough for task-oriented sequencing.
- domain assumption GraphScape perception costs c(a_i) are valid cognitive costs for edit operations in the smaller three-chart-type design space.
- domain assumption 60 demonstration sequences, 20 per task from three expert users, are sufficient and representative for learning each task reward.
- domain assumption The sequencing problem is Markov: the best next chart depends only on the current chart state.
- standard math Maximum entropy IRL is appropriate for recovering a reward from small, possibly biased demonstrations.
Cite this review
Pith. "Pith review of Task-Oriented Optimal Sequencing of Visualization Charts." pith.science (2026). https://pith.science/paper/6DTLIX7Y
@misc{pith2026190802502,
  author       = {Pith},
  title        = {Pith review of: Task-Oriented Optimal Sequencing of Visualization Charts},
  year         = {2026},
  howpublished = {\url{https://pith.science/paper/6DTLIX7Y}},
  note         = {Machine review of arXiv:1908.02502}
}
read the original abstract
A chart sequence is used to describe a series of visualization charts generated in the exploratory analysis by data analysts. It provides information details in each chart as well as a logical relationship among charts. While existing research targets on generating chart sequences that match human's perceptions, little attention has been paid to formulate task-oriented connections between charts in a chart design space. We present a novel chart sequencing method based on reinforcement learning to capture the connections between charts in the context of three major analysis tasks, including correlation analysis, anomaly detection, and cluster analysis. The proposed method formulates a chart sequencing procedure as an optimization problem, which seeks an optimal policy to sequencing charts for the specific analysis task. In our method, a novel reward function is introduced, which takes both the analysis task and the factor of human cognition into consideration. We conducted one case study and two user studies to evaluate the effectiveness of our method under the application scenarios of visualization demonstration, sequencing charts for reasoning analysis results, and making a chart design choice. The study results showed the power of our method.
Figures


Figures from the paper (5 more)



Reference graph
Works this paper leans on
-
[1]
Plotly community feed. https://plot.ly/feed. Accessed: 2019-03- 03
work page 2019
-
[2]
https://en.wikipedia.org/wiki/ Principle_of_maximum_entropy
Principle of maximum entropy. https://en.wikipedia.org/wiki/ Principle_of_maximum_entropy. Accessed: 2019-03-02
work page 2019
-
[3]
https://public.tableau.com/en-us/s/ gallery
Tableau public gallery. https://public.tableau.com/en-us/s/ gallery. Accessed: 2019-03-03
work page 2019
- [4]
-
[5]
R. A. Amar, J. R. Eagan, and J. T. Stasko. Low-level components of analytic activity in information visualization. IEEE Symposium on Infor- mation Visualization., pp. 111–117, 2005
work page 2005
-
[6]
D. Asimov. The grand tour: a tool for viewing multidimensional data. SIAM journal on scientific and statistical computing 6.1 , pp. 128–143, 1985
work page 1985
- [7]
-
[8]
M. Bostock, V . Ogievetsky, and J. Heer. D3 data-driven documents. IEEE Transactions on Visualization and Computer Graphics, 17(12):2301–2309, 2011
work page 2011
Show all 39 references
-
[9]
S. P. Callahan, J. Freire, E. Santos, C. E. Scheidegger, C. T. Silva, and H. T. V o. Managing the evolution of dataflows with vistrails.22nd International Conference on Data Engineering Workshops, pp. 71–71, 2006
2006
-
[10]
Dibia and agatay Demiralp
V . Dibia and agatay Demiralp. Data2vis: Automatic generation of data vi- sualizations using sequence to sequence recurrent neural networks. CoRR, abs/1804.03126, 2018
2018 arXiv
-
[11]
Gleicher, M
M. Gleicher, M. Correll, C. Nothelfer, and S. Franconeri. Perception of av- erage value in multiclass scatterplots. IEEE Transactions on Visualization and Computer Graphics, 19(12):2316–2325, 2013
2013
-
[12]
Gotz and Z
D. Gotz and Z. Wen. Behavior-driven visualization recommendation. In IUI, 2009
2009
-
[13]
Gotz and M
D. Gotz and M. X. Zhou. Characterizing users visual analytic activity for insight provenance. 2008 IEEE Symposium on Visual Analytics Science and Technology, pp. 123–130, 2008
2008
-
[14]
Harrison, F
L. Harrison, F. Yang, S. Franconeri, and R. Chang. Ranking visualizations of correlation using weber’s law.IEEE Transactions on Visualization and Computer Graphics, 20(12):1943–1952, 2014
1943
-
[15]
J. Heer, J. D. Mackinlay, C. Stolte, and M. Agrawala. Graphical histories for visualization: Supporting analysis, communication, and evaluation. IEEE Transactions on Visualization and Computer Graphics, 14, 2008
2008
-
[16]
Heer and G
J. Heer and G. G. Robertson. Animated transitions in statistical data graphics. IEEE Transactions on Visualization and Computer Graphics, 13:1240–1247, 2007
2007
-
[17]
Heer and B
J. Heer and B. Shneiderman. Interactive dynamics for visual analysis. Communications of the ACM, 55(4):45–54, 2012
2012
-
[18]
K. Hu, N. Gaikwad, M. Bakker, M. Hulsebos, and E. Zgraggen. Viznet: Towards a large-scale visualizationlearning and benchmarking repository. CoRR, 2018
2018
-
[19]
K. Z. Hu, M. A. Bakker, S. K. H. Li, T. Kraska, and C. A. Hidalgo. Vizml: A machine learning approach to visualization recommendation. arXiv preprint arXiv:1808.04819, 2018
2018 arXiv
-
[20]
Hullman, S
J. Hullman, S. M. Drucker, N. H. Riche, B. Lee, D. Fisher, and E. Adar. A deeper understanding of sequence in narrative visualization. IEEE Transactions on Visualization and Computer Graphics , 19:2406–2415, 2013
2013
-
[21]
Hullman, R
J. Hullman, R. Kosara, and H. Lam. Finding a clear path: Structuring strategies for visualization sequences. Comput. Graph. Forum, 36:365– 375, 2017
2017
-
[22]
T. J. Jankun-Kelly, K.-L. Ma, and M. Gertz. A model and framework for visualization exploration. IEEE Transactions on Visualization and Computer Graphics, 13, 2007
2007
-
[23]
Kay and J
M. Kay and J. Heer. Beyond weber’s law: A second look at ranking visualizations of correlation. IEEE Transactions on Visualization and Computer Graphics, 22(1):469–478, 2016
2016
-
[24]
Kim and J
Y . Kim and J. Heer. Assessing effects of task and data distribution on the effectiveness of visual encodings. Comput. Graph. Forum, 37:157–167, 2018
2018
-
[25]
Y . Kim, K. Wongsuphasawat, J. Hullman, and J. Heer. Graphscape: A model for automated reasoning about visualization similarity and se- quencing. In Proceedings of the CHI Conference on Human Factors in Computing Systems, 2017
2017
-
[26]
Y . Luo, X. Qin, N. Tang, and G. Li. Deepeye: Towards automatic data visu- alization. 2018 IEEE 34th International Conference on Data Engineering (ICDE), pp. 101–112, 2018
2018
-
[27]
K.-L. Ma. Image graphs-a novel approach to visual data exploration. Proceedings Visualization (Cat. No.99CB37067), pp. 81–88, 1999
1999
-
[28]
J. D. Mackinlay. Automating the design of graphical presentations of relational information. ACM Trans. Graph., 5:110–141, 1986
1986
-
[29]
J. D. Mackinlay, P. Hanrahan, and C. Stolte. Show me: Automatic pre- sentation for visual analysis. IEEE Transactions on Visualization and Computer Graphics, 13, 2007
2007
-
[30]
Moritz, C
D. Moritz, C. Wang, G. L. Nelson, H. Lin, A. M. Smith, B. Howe, and J. Heer. Formalizing visualization design knowledge as constraints: Ac- tionable and extensible models in draco. IEEE Transactions on Visualiza- tion and Computer Graphics, 25:438–448, 2018
2018
-
[31]
Qu and J
Z. Qu and J. Hullman. Keeping multiple views consistent: Constraints, validations, and exceptions in visualization authoring. IEEE Transactions on Visualization and Computer Graphics, 24:468–477, 2018
2018
-
[32]
Saket, A
B. Saket, A. Endert, and C. Demiralp. Task-based effectiveness of basic vi- sualizations. IEEE Transactions on Visualization and Computer Graphics, 2018
2018
-
[33]
Satyanarayan, D
A. Satyanarayan, D. Moritz, K. Wongsuphasawat, and J. Heer. Vega-lite: A grammar of interactive graphics. IEEE Transactions on Visualization and Computer Graphics, 23:341–350, 2017
2017
-
[34]
C. E. Scheidegger, H. T. V o, D. Koop, J. Freire, and C. T. Silva. Querying and creating visualizations by analogy.IEEE Transactions on Visualization and Computer Graphics, 13:1560–1567, 2007
2007
-
[35]
Segel and J
E. Segel and J. Heer. Narrative visualization: Telling stories with data. IEEE Transactions on Visualization and Computer Graphics, 16:1139– 1148, 2010
2010
-
[36]
R. S. Sutton, A. G. Barto, et al. Introduction to reinforcement learning, vol. 135. MIT press Cambridge, 1998
1998
-
[37]
D. A. Szafir, S. Haroz, M. Gleicher, and S. Franconeri. Four types of ensemble coding in data visualizations. Journal of vision, 16(5):11–11, 2016
2016
-
[38]
Wongsuphasawat, D
K. Wongsuphasawat, D. Moritz, A. Anand, J. D. Mackinlay, B. Howe, and J. Heer. V oyager: Exploratory analysis via faceted browsing of visualization recommendations. IEEE Transactions on Visualization and Computer Graphics, 22:649–658, 2016
2016
-
[39]
B. D. Ziebart, A. L. Maas, J. A. Bagnell, and A. K. Dey. Maximum entropy inverse reinforcement learning. In AAAI, vol. 8, pp. 1433–1438. Chicago, IL, USA, 2008
2008
Reviewed August 14, 2026 · model on record in the stance chip above.
Discussion (0). Continue with ORCID to comment.