REVIEW 4 major objections 6 minor 56 references
Migrant mobility flows characterized with digital data
T0 review · 4 major / 6 minor · reviewed 2026-08-14 · deepseek-v4-flash
Pith's one-line read During the Venezuelan crisis, migration totals estimated from geolocated Twitter data match official country-level statistics, with R² = 0.98.
desk verdict R²=0.98 in log-log space cannot validate the upscaling factor, so the paper's absolute totals are weaker than the abstract claims. read the letter →
The pith
A machine-rendered reading of the paper's core claim, the machinery that carries it, and where it could break.
The reading
What carries the argument
The load-bearing object is the upscaling factor $S_k(t)$, defined by the recurrence $$S_k(t) = \frac{P(t-1) - e_k(t-1)\,S_k(t-1)}{u_k(t)},$$ where $P(t-1)$ is the projected national population, $e_k(t-1)$ the number of resident Twitter users observed leaving in the previous year under criterion $k$, and $u_k(t)$ the number of active resident Twitter users in year $t$. It converts one observed departing Twitter user into $S_k(t)$ real migrants, using the inverse of the population fraction that tweets with geolocation. Around this factor the paper builds a pipeline: a 40 km grid of cells, four progressively less restrictive criteria for classifying Venezuelan resident Twitter users (TUVs), a radius-of-gyration filter to discard non-individual accounts, and a unit-vector representation of consecutive tweets to map route directions.
What would settle it
Compare month-by-month upscaled Twitter exits against an independent count such as border registrations or mobile-roaming arrivals in the main destination country; if the implied ratio of Twitter users to migrants drifts upward or downward over time as the crisis evolves, the fixed scale-factor assumption is false.
Extended reading notes
Core claim
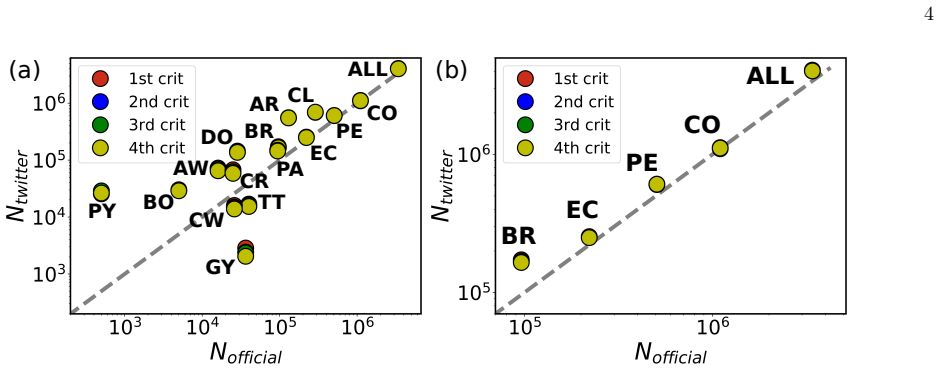
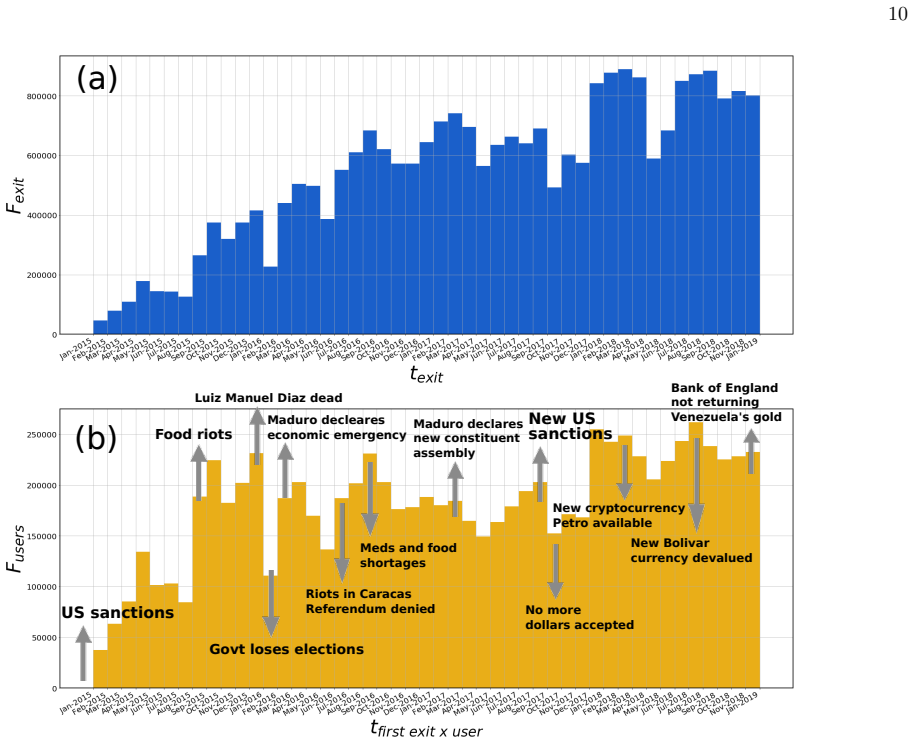
The central discovery is that the number of geolocated Twitter users classified as Venezuelan residents and first detected abroad, when multiplied by a time-varying upscaling factor, reproduces official country-level counts of Venezuelan migrants. For 2018 the comparison yields R² = 0.98 across all countries in the study area and R² = 0.99 for the four main destinations (Brazil, Colombia, Ecuador, Peru), with the estimates falling within the range spanned by different official sources. The same data also resolve preferred ground routes, such as the Pan-American highway, distinguish recurrent cross-border travelers from settled migrants, and produce monthly exit series whose peaks align with crisis events.
Load-bearing premise
One departing Twitter user is taken to represent a fixed number of real migrants, set by the year's ratio of national population to active geolocated Twitter users.
Editorial extensions
If this is right
- Country-level migration totals for a crisis region can be produced on monthly or yearly timescales from open Twitter data, complementing official statistics that lag by months or years.
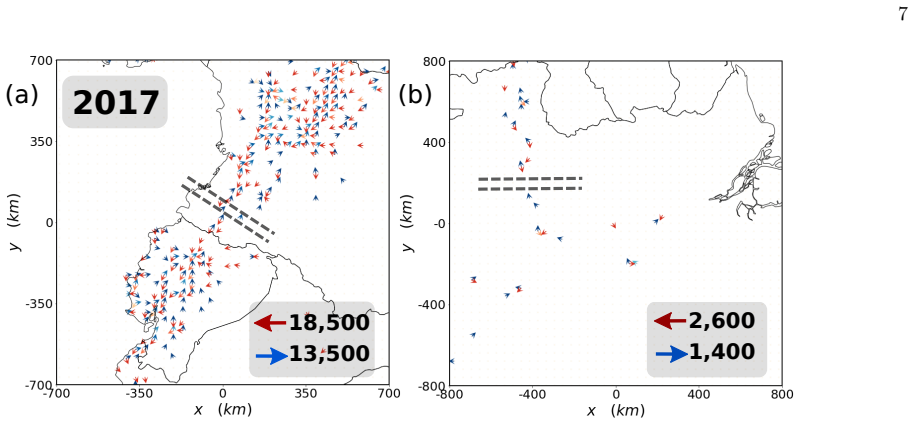
- The 40 km grid and route vectors expose preferred corridors such as the Pan-American highway and the Manaus–Belém artery, information that border records do not capture.
- A threshold on the fraction of time spent abroad after first exit, $R = t_{\text{out}}/t_{\text{tot}}$, separates recurrent movers (about 25% of observed migrants) from settled ones, enabling study of circular migration.
- Monthly upscaled first-exit series can be aligned with political and economic events, allowing quantitative assessment of how specific shocks trigger outflow peaks.
- The workflow transfers to other crises where geolocated Twitter coverage exists, since only the census-based population projection and local Twitter activity are needed to set the scale factor.
Reading between the lines
- The recurrence makes today's scale factor depend on yesterday's estimated outflow ($e_k(t-1)S_k(t-1)$), so the total is not fully independent of the phenomenon it measures; a validation that did not use its own previous estimate would isolate this effect.
- Because the observed flow of TUVs drops faster than the presumed out-migration (43,000 fewer TUVs versus 11,000 observed exits in 2016–2017), part of the decline must come from changing Twitter use; if the tweet-rate assumption drifts, spatial patterns would remain useful while absolute totals could be biased.
- The route-crossing counts require two consecutive tweets straddling the line, so they are acknowledged underestimates; linking them to the overall upscaled flow could yield absolute route volumes.
- The method could be tested in a non-crisis setting where both official monthly emigration data and geolocated social media data exist, to check whether the upscaling stability generalizes beyond Venezuela.
Signed reviews
Editorial analysis
A structured set of objections, weighed in public.
Referee Report
Summary. The paper presents a method for estimating international migration flows from geolocated Twitter data, applied to the Venezuelan migration crisis (2015-2019). It classifies Venezuelan-resident Twitter users (TUVs) under four criteria, counts first appearances abroad, and upscales these counts to population totals via a per-year multiplicative factor S_k(t) defined in Eq. (2). The authors validate country-level estimates against official numbers from IOM, UNHCR, and the Brazilian Federal Police, reporting R^2=0.98 in log-log space, and use the upscaled flows to map routes, estimate crossing rates, distinguish recurrent travelers, estimate new residents per country, measure urban spatial integration, and construct monthly outflow series.
Significance. If the central claim were fully established, the paper would be a valuable contribution: it shows how a globally available, low-cost data source can provide migration estimates at fine spatial and temporal resolution during a humanitarian crisis, complementing traditional surveys and border records. The manuscript has notable strengths: a transparent, reproducible pipeline based on the open Twitter API; explicit handling of multiple resident definitions; an ethics section describing de-identification; and validation against several independent official sources. The maps and temporal series offer practical information beyond aggregate statistics. However, the validation is weaker than it appears: the reported R^2 is in log-log space and is insensitive to a common multiplicative bias, and the paper's own Table I and discussion indicate that the upscaling factor is inflated by non-migration declines in active Twitter users. The current evidence supports the spatial pattern and relative distribution of flows, but not yet the magnitude consistency stated in the abstract.
major comments (4)
- [Results, Upscaling factors (Eq. 2, Table I)] The upscaling factor S_k(t) in Eq. (2) is computed as [P(t-1) - e_k(t-1) S_k(t-1)] / u_k(t), where u_k(t) is the number of active TUVs in year t. Table I shows that u_4(t) fell from 157.5K in 2015 to 71K in 2018, a 55% drop. The text explicitly attributes much of this decline to non-migration causes ("a general drop in the use of geolocated Twitter", "economic and social stress") and quantifies that the drop between 2016 and 2017 (43K for criterion 4) far exceeds the observed TUV outflow in 2016 (11K). Since u_k(t) is in the denominator, a decline unrelated to migration mechanically inflates S_k(t) in later years, and therefore inflates the upscaled outflow estimates. This predicts the overshoot seen in Table II: the Twitter total (3.92-3.97M) exceeds the IOM (2.6M) and UNHCR (3.4M) figures. The R^2=0.98 reported in Figure 1 is computed in log-log space, which is invariant under multiplication of all Twitter estimates by a constant, so it cannot detect or validate the absolute scale of the flows. The manuscript should correct u_k(t) for non-migration Twitter attrition (e.g., using the Colombia control series mentioned in the text) and/or report scale-sensitive agreement metrics (e.g., linear regression through the origin, ratios of totals, mean absolute percentage error).
- [Validation of external flows, Figure 1 and Table II] The comparison of Twitter estimates to official statistics appears internally inconsistent regarding the reference date. Figure 1's caption cites "UNHCR in January 2018", while Table II lists UNHCR Nov 2018 and Jan 2019 totals that differ substantially (3.0M vs 3.4M). The validation should specify exactly which official numbers are used for each country and date, and the R^2 values should be accompanied by the fitted multiplicative offset (intercept in log space). Without this, the reader cannot assess whether the 15-50% overshoot in Table II is part of the "consistency" claim or a deviation.
- [Definition of migrants, Results (Recurrence)] The paper defines a migrant as any individual leaving Venezuela during the observation window, deviating from the UN long-term (12-month) definition. This is a reasonable operational choice for a crisis, but it has direct consequences for the validation: Table II counts first exits, including the 25% of TUVs later classified as recurrent travelers who "stay most of the time in Venezuela". Official statistics on migrant stocks should not include such individuals, so part of the observed overshoot may stem from a definitional mismatch rather than scale bias. The authors should quantify the impact of excluding recurrent travelers from the flow estimates, or at least discuss how the comparison changes if a minimum stay requirement is imposed.
- [Upscaling factors, Eq. (2)] Eq. (2) feeds the method's own outflow estimate e_k(t-1) back into the population term, so any bias in e_k propagates into subsequent years' scale factors. Although this is not circular in the sense of fitting to official data, it makes the estimates sensitive to initial errors. A sensitivity analysis varying e_k(t-1) and u_k(t) within plausible ranges would help establish robustness.
minor comments (6)
- [Figure 1 caption] The caption says "January 2018" but the text and Table II reference UNHCR data from November 2018 and January 2019; please clarify the correct reference date.
- [Equation (1)] The radius of gyration formula in Eq. (1) appears garbled in the text (missing square root symbol, unclear summation); please typeset it correctly.
- [Validation section, text vs Figure 1] The text says "R2 over 0.9" while Figure 1 reports R2=0.98 and 0.99; please harmonize these values and state the exact computation (log-log, sample size).
- [Recurrence section] The numbers 12,518 recurrent and 22,459 non-recurrent TUVs are not explicitly tied to a specific resident criterion or reference year; please specify the criterion and period used.
- [Table II and IV labels] The rows "Data(1st)" through "Data(4th)" should explicitly state that these correspond to resident criteria 1-4, for readability.
- [References] Reference [38] is listed as "in press XX, XX"; this should be completed with the journal and volume before publication.
Circularity Check
No significant circularity: the Twitter-derived flows are validated against independent official statistics, and the recursive upscaling factor is not fitted to those statistics.
full rationale
The derivation chain is self-contained with respect to the official statistics used for validation. The upscaling factor in Eq. (2), S_k(t) = (P(t-1) - e_k(t-1) S_k(t-1)) / u_k(t), is constructed from census population projections, counts of active geolocated Venezuelan Twitter users, and the method's own previous-year TUV outflow count. It is a recursive estimator, not a fit to IOM/UNHCR/PFB flow totals; official numbers enter only after the flows are produced, in the validation tables and figures. Similarly, the four resident criteria and the recurrent/non-recurrent split are defined from Twitter histories alone. The claims of country-level consistency rest on comparing these independently produced estimates with UNHCR, IOM and Brazilian Federal Police data (R^2 = 0.98 in Fig. 1, R^2 = 0.97 in Fig. 5). Prior work by the same group is cited to support the general equivalence of Twitter, mobile phone and survey mobility matrices, but that support is external to the present fitting and is not invoked as a uniqueness theorem or as a substitute for the validation. The recursive dependence of S_k(t) on the previous year's estimated outflow is a potential bias-amplification issue, and the log-log R^2 is indeed insensitive to a constant multiplicative error in the upscaling factor; both are correctness and robustness concerns, not circularity in the sense of the prediction being equivalent to its inputs by construction. No self-definitional step, fitted-input-called-prediction, or load-bearing self-citation chain was found.
Assumptions & free parameters
free parameters (4)
- Per-year upscaling factor S_k(t) =
S_4(2015) ≈ 191 (30.1M/157.5K); 2016-2018 values depend on criterion
- Resident classification thresholds =
5 tweets minimum, 3-month activity window, Venezuela flag in 3 consecutive months (criterion 1), expansion criteria…
- Recurrent-traveler threshold R=0.5 =
0.5
- Spatial and filtering constants =
grid 40 km, rg cutoff 5000 km, bot filter 20 tweets/hour, route vector cutoff 500 km
assumptions (4)
- domain assumption The population of Venezuela and its projection are taken from official sources as ground truth.
- domain assumption Twitter users' emigration behavior is representative of the general population's, so one TUV leaving represents S_k(t) actual migrants.
- ad hoc to paper Any first tweet from another country marks a migration event, even though the UN defines long-term migrants as those staying at least 12 months.
- domain assumption The Twitter Streaming API sample is stable over time and across countries.
Cite this review
Pith. "Pith review of Migrant mobility flows characterized with digital data." pith.science (2026). https://pith.science/paper/STZMO4MH
@misc{pith2026190802540,
  author       = {Pith},
  title        = {Pith review of: Migrant mobility flows characterized with digital data},
  year         = {2026},
  howpublished = {\url{https://pith.science/paper/STZMO4MH}},
  note         = {Machine review of arXiv:1908.02540}
}
read the original abstract
Monitoring migration flows is crucial to respond to humanitarian crisis and to design efficient policies. This information usually comes from surveys and border controls, but timely accessibility and methodological concerns reduce its usefulness. Here, we propose a method to detect migration flows worldwide using geolocated Twitter data. We focus on the migration crisis in Venezuela and show that the calculated flows are consistent with official statistics at country level. Our method is versatile and far-reaching, as it can be used to study different features of migration as preferred routes, settlement areas, mobility through several countries, spatial integration in cities, etc. It provides finer geographical and temporal resolutions, allowing the exploration of issues not contemplated in official records. It is our hope that these new sources of information can complement official ones, helping authorities and humanitarian organizations to better assess when and where to intervene on the ground.
Figures
Figures from the paper (4 more)


Reference graph
Works this paper leans on
-
[1]
Conflict resolution: Wars without end
Jones, D. Conflict resolution: Wars without end. Nature 519, 148 (2015)
work page 2015
-
[2]
L´ opez-Carr, D. and Marter-Kenyon, J. Human adapta- tion: Manage climate-induced resettlement. Nature 517, 265 (2015)
work page 2015
-
[3]
Ravenstein, E. G. The laws of migration. Journal of the Statistical Society of London 48, 167–235 (1885)
-
[4]
Abel, G. J. and Sander, N. Quantifying global interna- tional migration flows. Science 343, 1520–1522 (2014)
work page 2014
-
[5]
Migration and settlement: a multiregional comparative study
Rogers, A., Willekens, F., and Ledent, J. Migration and settlement: a multiregional comparative study. Environ- ment and planning A 15, 1585–1612 (1983)
work page 1983
-
[6]
The architecture of complex weighted networks
Barrat, A., Barthelemy, M., Pastor-Satorras, R., and Vespignani, A. The architecture of complex weighted networks. Proceedings of the National Academy of Sci- ences of the U.S.A. 101, 3747–3752 (2004)
work page 2004
-
[7]
International migration under the microscope
Willekens, F., Massey, D., Raymer, J., and Beauchemin, C. International migration under the microscope. Science 352, 897–899 (2016)
work page 2016
-
[8]
Data on movements of refugees and migrants are flawed
Editorial article. Data on movements of refugees and migrants are flawed. Nature 543, 5–6 (2017)
work page 2017
Show all 56 references
-
[9]
What the numbers say about refugees
Butler, D. What the numbers say about refugees. Nature 543, 22–23 (2017)
2017
-
[10]
Migration tracking is a mess
Dijstelbloem, H. Migration tracking is a mess. Nature 543, 32 (2017)
2017
-
[11]
R., Lenormand, M., Louail, T., Menezes, R., Ramasco, J
Barbosa, H., Barthelemy, M., Ghoshal, G., James, C. R., Lenormand, M., Louail, T., Menezes, R., Ramasco, J. J., Simini, F., and Tomasini, M. Human mobility: Models and applications. Physics Reports 734, 1–74 (2018)
2018
-
[12]
Intra-urban hu- man mobility patterns: An urban morphology perspec- tive
Kang, C., Ma, X., Tong, D., and Liu, Y. Intra-urban hu- man mobility patterns: An urban morphology perspec- tive. Physica A: Statistical Mechanics and its Applica- tions 391(4), 1702–1717 (2012)
2012
-
[13]
Understanding individual mobility patterns from urban sensing data: A mobile phone trace example
Calabrese, F., Diao, M., Di Lorenzo, G., Ferreira Jr, J., and Ratti, C. Understanding individual mobility patterns from urban sensing data: A mobile phone trace example. Transportation Research Part C: Emerging Technologies 26, 301–313 (2013)
2013
-
[14]
Louail, T., Lenormand, M., Ros, O. G. C., Picornell, M., Herranz, R., Frias-Martinez, E., Ramasco, J. J., and Barthelemy, M. From mobile phone data to the spatial structure of cities. Scientific Reports 4, 5276 (2014)
2014
-
[15]
Urban dreams of migrants: A case study of migrant integration in shanghai
Yang, Y., Tan, C., Liu, Z., Wu, F., and Zhuang, Y. Urban dreams of migrants: A case study of migrant integration in shanghai. In Procs. of The Thirty-Second AAAI Con- ference on Artificial Intelligence (AAAI-2018) . AAAI, (2018)
2018
-
[16]
C., Hidalgo, C
Gonzalez, M. C., Hidalgo, C. A., and Barabasi, A.-L. Un- derstanding individual human mobility patterns. Nature 453, 779–782 (2008)
2008
-
[17]
Krings, G., Calabrese, F., Ratti, C., and Blondel, V. D. Urban gravity: a model for inter-city telecommunication flows. Journal of Statistical Mechanics: Theory and Ex- periment 2009, L07003 (2009)
2009
-
[18]
S., Greco, K., Sobolevsky, S., and Ratti, C
Kung, K. S., Greco, K., Sobolevsky, S., and Ratti, C. Exploring universal patterns in human home-work com- muting from mobile phone data. PLoS ONE 9, e96180 (2014)
2014
-
[19]
Unveiling patterns of international communities in a global city using mobile phone data
Bajardi, P., Delfino, M., Panisson, A., Petri, G., and Tiz- zoni, M. Unveiling patterns of international communities in a global city using mobile phone data. EPJ Data Sci- ence 4, 3 (2015)
2015
-
[20]
Alfeo, A., Cimino, M. G. C. A., Lepri, B., Pentland, A. S., and Vaglini, G. Assessing refugees’ integration via spatio-temporal similarities of mobility and calling behaviors. IEEE Transactions on Computational Social Systems ( Early Access ) , 1–13 (2019)
2019
-
[21]
A stochastic model of randomly accelerated walkers for human mobility
Gallotti, R., Bazzani, A., Rambaldi, S., and Barthelemy, M. A stochastic model of randomly accelerated walkers for human mobility. Nature Communications 7, 12600 (2016)
2016
-
[22]
Leveraging facebook’s advertising platform to monitor stocks of mi- grants
Zagheni, E., Weber, I., Gummadi, K., et al. Leveraging facebook’s advertising platform to monitor stocks of mi- grants. Population and Development Review 43, 721–734 (2017)
2017
-
[23]
Geo-located twitter as proxy for global mobility patterns
Hawelka, B., Sitko, I., Beinat, E., Sobolevsky, S., Kaza- kopoulos, P., and Ratti, C. Geo-located twitter as proxy for global mobility patterns. Cartography and Geographic Information Science 41, 260–271 (2014)
2014
-
[24]
Lenormand, M., Gon¸ calves, B., Tugores, A., and Ram- asco, J. J. Human diffusion and city influence. Journal of The Royal Society Interface 12, 20150473 (2015)
2015
-
[25]
Twitter as a source of global mobility pat- terns for social good
Dredze, M., Garc´ ıa-Herranz, M., Rutherford, A., and Mann, G. Twitter as a source of global mobility pat- terns for social good. arXiv preprint arXiv:1606.06343 (2016)
2016 arXiv
-
[26]
Zagheni, E., Garimella, V. R. K., Weber, I., et al. Infer- ring international and internal migration patterns from twitter data. In Proceedings of the 23rd International Conference on World Wide Web, 439–444. ACM, (2014)
2014
-
[27]
and Menezes, R
Aswad, F. and Menezes, R. Refugee and immigra- tion:twitter as a proxy for reality. InThe Thirty-First In- ternational Florida Artificial Intelligence Research Soci- ety Conference (FLAIRS-31), 17627. AAAI Publications, (2018)
2018
-
[28]
Hausman, R., Hinz, J., and Yildirim, M. A. Measur- ing venezuelan emigration with twitter. Technical re- port, Kiel Working Paper, No. 2106, Kiel Institute for the World Economy (IfW), Kiel, (2018)
2018
-
[29]
I., Huang, Z., Savelyev, A., and MacEachren, A
Blanford, J. I., Huang, Z., Savelyev, A., and MacEachren, A. M. Geo-located tweets. Enhancing mobility maps and capturing cross-border movement. PLoS ONE 10, e0129202 (2015)
2015
-
[30]
The spoken postcodes
Arribas-Bel, D. The spoken postcodes. Regional Studies, Regional Science 2, 458–461 (2015)
2015
-
[31]
H., Ro- manillos, G., Gon¸ calves, B., and Ramasco, J
Lamanna, F., Lenormand, M., Salas-Olmedo, M. H., Ro- manillos, G., Gon¸ calves, B., and Ramasco, J. J. Immi- grant community integration in world cities. PLoS ONE 13, e0191612 (2018)
2018
-
[32]
The role of information communication technologies in the arab spring
Stepanova, E. The role of information communication technologies in the arab spring. Ponars Eurasia 15, 1–6 (2011)
2011
-
[33]
G., Tu- gores, A., Louail, T., Herranz, R., Barthelemy, M., Frias- 12 Martinez, E., and Ramasco, J
Lenormand, M., Picornell, M., Cant´ u-Ros, O. G., Tu- gores, A., Louail, T., Herranz, R., Barthelemy, M., Frias- 12 Martinez, E., and Ramasco, J. J. Cross-checking different sources of mobility information. PLoS One 9, e105184 (2014)
2014
-
[34]
Mislove, A., Lehmann, S., Ahn, Y.-Y., Onnela, J.-P., and Rosenquist, J. N. Understanding the demographics of twitter users. In Fifth international AAAI conference on weblogs and social media , (2011)
2011
-
[35]
Race, religion and the city: twitter word frequency patterns reveal dominant demographic dimensions in the United States
Bok´ anyi, E., Kondor, D., Dobos, L., Seb˝ ok, T., St´ eger, J., Csabai, I., and Vattay, G. Race, religion and the city: twitter word frequency patterns reveal dominant demographic dimensions in the United States. Palgrave Communications 2, 16010 (2016)
2016
-
[36]
Who tweets in the United Kingdom? pro- filing the Twitter population using the british social attitudes survey 2015
Sloan, L. Who tweets in the United Kingdom? pro- filing the Twitter population using the british social attitudes survey 2015. Social Media & Society 3, 2056305117698981 (2017)
2017
-
[37]
Lenormand, M., Tugores, A., Colet, P., and Ramasco, J. J. Tweets on the road. PLoS ONE 9, e105407 (2014)
2014
-
[38]
Mazzoli, M., Molas, A., Bassolas, A., Lenormand, M., Colet, P., and Ramasco, J. J. Field theory for recurrent mobility. in press XX, XX (2019)
2019
-
[39]
E., Hugo, G., Oberai, A
Bilsborrow, R. E., Hugo, G., Oberai, A. S., et al. Inter- national migration statistics: Guidelines for improving data collection systems . International Labour Organiza- tion, Geneva, Switzerland, (1997)
1997
-
[40]
Principles and Recom- mendations for Population and Housing Censuses, Revi- sion 2
United Nations, Economic Commission for Europe, Com- mittee on Environmental Policy. Principles and Recom- mendations for Population and Housing Censuses, Revi- sion 2 . United Nations Publications, Geneva, Switzer- land, (2008)
2008
-
[41]
J., Sorichetta, A., Wi´ sniowski, A., Weber, I., and Tatem, A
Hughes, C., Zagheni, E., Abel, G. J., Sorichetta, A., Wi´ sniowski, A., Weber, I., and Tatem, A. J. Inferring mi- grations: Traditional methods and new approaches based on mobile phone, social media, and other big data: Feasi- bility study on inferring (labour) mobility and mi...
2016
-
[42]
Migration data sources
Migration Data Portal, . Migration data sources. https://migrationdataportal.org/themes/ migration-data-sources, (2019). Accessed: 2019- 07-17
2019
-
[43]
Number of refugees and mi- grants from venezuela reaches 3 million
UNHCR website, . Number of refugees and mi- grants from venezuela reaches 3 million. https: //www.unhcr.org/news/press/2018/11/5be4192b4/ number-refugees-migrants-venezuela-reaches-3-million. html?query=venezuela, (2018). Accessed: 2019-05-20
2018
-
[44]
R4v am´ erica latina y el caribe, refugiados y migrantes venezolanos en la regi´ on - en- ero 2019
UNHCR website, . R4v am´ erica latina y el caribe, refugiados y migrantes venezolanos en la regi´ on - en- ero 2019. https://data2.unhcr.org/es/documents/ details/68070, (2019). Accessed: 2019-05-20
2019
-
[45]
Migration trends in the americas
IOM website, . Migration trends in the americas. https://www.iom.int/ venezuela-migration-trends-americas-september-2018 , (2018). Accessed: 2019-05-20
2018
-
[46]
http://www.casacivil.gov.br/central-de-conteudos/ noticias/2018/dezembro/comite-federal-apresenta-balanco- de-acoes-de-acolhimento-de-venezuelanos, (2018)
Federal Police of Brazil 2018. http://www.casacivil.gov.br/central-de-conteudos/ noticias/2018/dezembro/comite-federal-apresenta-balanco- de-acoes-de-acolhimento-de-venezuelanos, (2018). Accessed: 2019-05-20
2018
-
[47]
Promises and pitfalls of using digital traces for demographic research
Cesare, N., Lee, H., McCormick, T., Spiro, E., and Za- gheni, E. Promises and pitfalls of using digital traces for demographic research. Demography 55, 1979–1999 (2018)
2018
-
[48]
and Morgan, J
Sloan, L. and Morgan, J. Who tweets with their lo- cation? understanding the relationship between demo- graphic characteristics and the use of geoservices and geotagging on twitter. PloS one 10, e0142209 (2015)
2015
-
[49]
G., Picor- nell, M., Herranz, R., Arias, J
Lenormand, M., Louail, T., Cant´ u-Ros, O. G., Picor- nell, M., Herranz, R., Arias, J. M., Barthelemy, M., San Miguel, M., and Ramasco, J. J. Influence of sociode- mographic characteristics on human mobility. Scientific Reports 5, 10075 (2015)
2015
-
[50]
https:// developer.twitter.com/en/docs
Documentation on the Twitter access API. https:// developer.twitter.com/en/docs. Accessed: 2019-04- 17
2019
-
[51]
https://www.unhcr.org/ph/15238-venezuelan-outflow- continues-unabated-stands-now-at-3-4-million.html
Joint unhcr-iom press release: Venezuelan outflow continues unabated, stands now at 3.4 million. https://www.unhcr.org/ph/15238-venezuelan-outflow- continues-unabated-stands-now-at-3-4-million.html. Accessed: 2019-05-20
2019
-
[52]
Internation Organization for Migration, U. N. Glossary on Migration . IOM, Geneva, Switzerland, (2019). Ac- cessed: 2019-07-17
2019
-
[53]
Censo de poblaci´ on y vivienda de venezuela 2011
Instituto Nacional de Estad´ ıstica de Venezuela, . Censo de poblaci´ on y vivienda de venezuela 2011. http: //www.redatam.ine.gob.ve/Censo2011/index.html, (2011). Accessed: 2019-05-20
2011
-
[54]
World population prospects 2017
United Nations Population Division DESA, . World population prospects 2017. https://population.un. org/wpp/Download/Standard/Population/, (2017). Ac- cessed: 2019-05-20
2017
-
[55]
Mackay, D. J. C. Information Theory, Inference and Learning Algorithms. Cambridge University Press, Cam- bridge, UK, (2003)
2003
-
[56]
https://data.unicef.org/resources/call-action-protecting -children-move-starts-better-data/
Unicef: A call to action: Protecting chil- dren on the move starts with better data. https://data.unicef.org/resources/call-action-protecting -children-move-starts-better-data/. Accessed: 2019-05-20
2019
Reviewed August 14, 2026 · model on record in the stance chip above.
Discussion (0). Continue with ORCID to comment.