REVIEW 3 major objections 4 minor 27 references
Economic Power, Population, and the Size of Astronomical Community
T0 review · 3 major / 4 minor · reviewed 2026-08-14 · deepseek-v4-flash
Pith's one-line read The paper argues that a country's economic power and population set the proper size of its astronomical community, and that South Korea should grow from about 310 to 550 PhD astronomers to match Spain, Canada, and Japan.
desk verdict A careful new dataset of PhD astronomer counts, but the 'proper size' target for Korea is not actually derived from the data it claims to use. read the letter →
The pith
A machine-rendered reading of the paper's core claim, the machinery that carries it, and where it could break.
The reading
What carries the argument
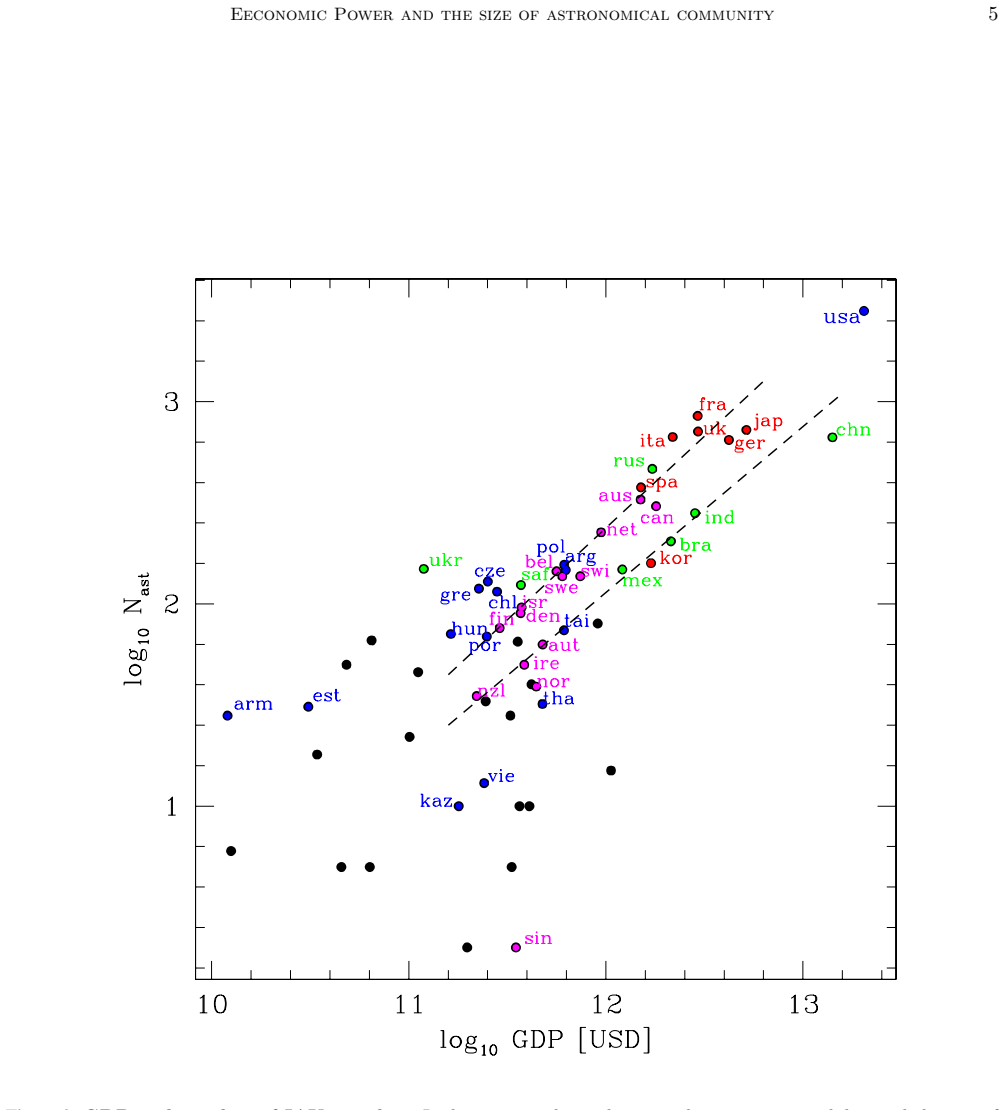
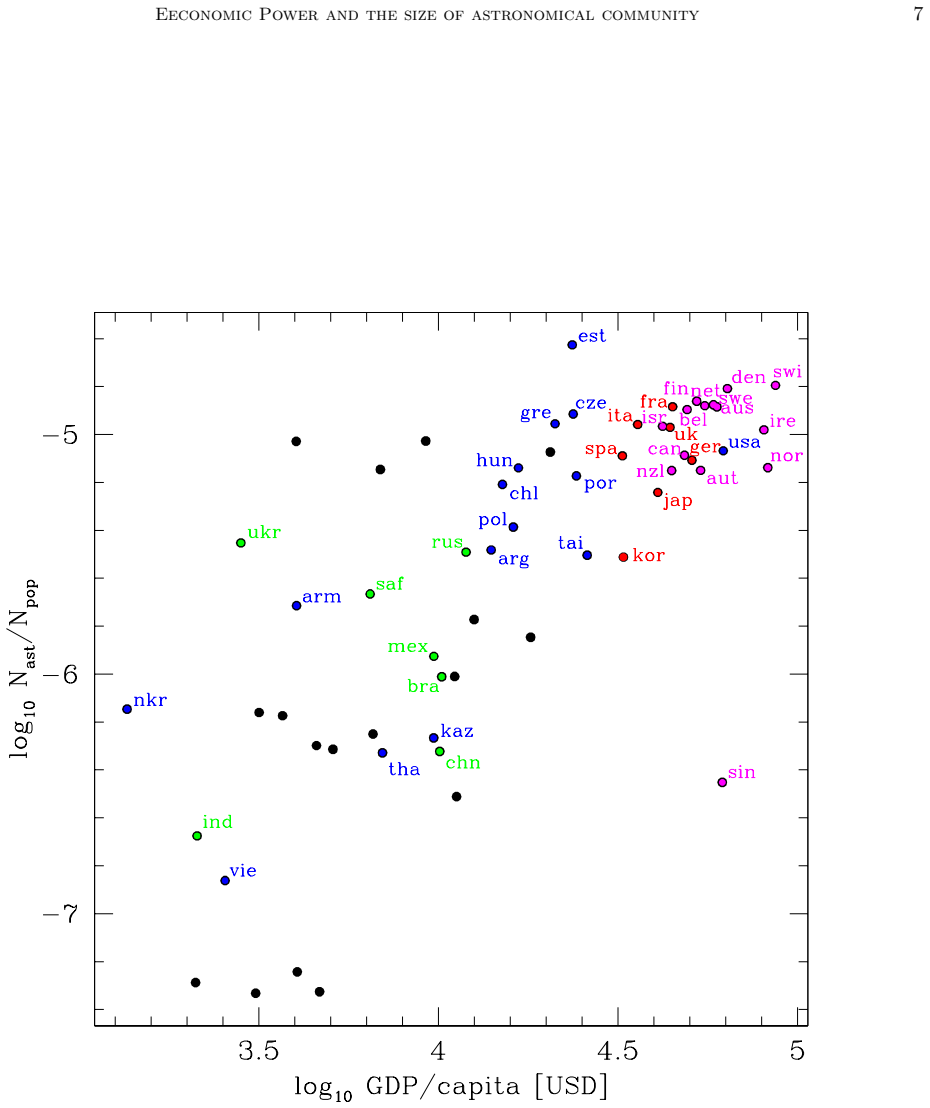
The load-bearing empirical tool is a double comparison: the log-linear regression of total PhD astronomers $N_{\mathrm{ast}}$ against GDP, and the per-capita intensity of astronomers per million citizens against GDP per capita. For the IAU data the paper finds two fitted branches, roughly $y = 0.91x - 8.59$ for the long-history European group and $y = 0.82x - 7.78$ for the rapid-growth group, with Korea on the lower branch; the total-enumeration data reproduce the same two-branch pattern. Time series of astronomers per citizen for individual countries are then used to argue that the correlation reflects causation: as GDP per capita rises, the astronomer-per-citizen ratio rises. The target of 550 is obtained by applying benchmark countries' PhD-per-million ratios to Korea's population, and the projection to 2030 follows the fitted growth curve $N(t) = 2.35(t-1990)^{1.46} + 35$.
What would settle it
An independent, complete census of PhD astronomers employed in Korea would settle the factual side: if the true number is already close to 550, or if the growth curve has flattened below $N(t) = 2.35(t-1990)^{1.46} + 35$, the paper's gap and its 2030 projection both fail. The benchmark assumption can also be tested by recomputing the target with alternative country groups; a target that swings between about 550 and 1,000 depending on the reference class would show that the 'proper size' is not uniquely determined by GDP and population.
Extended reading notes
Core claim
The central claim is that the number of PhD-level astronomers a country can and should support is a function of its economic power and population, not of its scientific tradition or IAU enrollment. The paper confirms this by replotting the GDP-versus-astronomer correlation with total enumerations gathered from national demographic surveys, and by showing that the same two-branch structure seen in IAU data persists: European countries with long astronomical histories have roughly 2.2 to 2.6 times more astronomers per unit GDP than countries that industrialized or developed economically more recently. Time-series data for several countries support a causal reading, since astronomers per citizen have risen most steeply in countries whose GDP per capita rose most steeply. From the per-capita ratios of the middle benchmark group, the paper concludes that Korea's community should number about 550 PhD astronomers to be comparable to Spain, Canada, and Japan, about 780 for the German, French, and Italian level, and about 1,000 for the US, UK, Netherlands, and Australia level; it currently counts approximately 310.
Load-bearing premise
The estimate that Korea should have 550 PhD astronomers assumes that Spain, Canada, and Japan are the right benchmark countries for a rapidly developed mid-sized economy, rather than the US, UK, Netherlands, and Australia group that would imply about 1,000.
Editorial extensions
If this is right
- If Korea continues its current growth rate, its PhD astronomer count reaches about 550 around 2030, the size the paper identifies as competitive with Spain, Canada, and Japan.
- Korea's community is currently roughly 2.6 times smaller per citizen than the advanced-country benchmark, meaning about 240 additional PhD positions are needed to close the gap.
- Countries that are developing rapidly should expect their astronomer counts to lag their GDP until their basic-science sectors catch up, and then to rise quickly along the lower branch.
- Maintaining a 550-astronomer community will require at least double or triple the current PhD production rate of about 10 per year, given retirements.
- R&D spending per astronomer in Korea is already close to UK levels, so the bottleneck is the number of positions and the declining share of basic science in national R&D, not the per-capita funding per scientist.
Reading between the lines
- A testable extension of the two-branch picture is that as emerging economies mature, their astronomer-per-GDP ratio should climb toward the European branch; comparing the same countries' positions in 2017 and 2037 would directly test that convergence.
- The target of 550 is sensitive to the choice of benchmark countries; applying the US, UK, Netherlands, and Australia ratios instead would push the target to about 1,000, so the estimate should be read as a lower bound on what 'competitive' means rather than a stable number.
- If high levels of per-astronomer productivity become the norm in countries with strong observatories and data centers, the headcount-based correlation with GDP may weaken, and a country could match scientific output with fewer PhDs than the paper's method would prescribe.
- The same total-enumeration census method could be applied to other middle-income emerging economies, such as Brazil, Mexico, or Turkey, to see whether their astronomer counts also sit on the lower branch and how large their catch-up targets would be.
Editorial analysis
A structured set of objections, weighed in public.
Referee Report
Summary. The paper revisits the known correlation between a country's gross domestic product and the size of its astronomical community, but replaces IAU membership counts with a total enumeration of PhD-level astronomers and astrophysicists for 13 countries. It confirms a two-branch structure (European countries with long histories of modern astronomy versus countries with recent rapid economic development), examines time series of astronomer counts, and uses per-citizen astronomer ratios to prescribe target sizes for the Korean astronomical community: 550 PhDs to be comparable to Spain, Canada, and Japan; 780 to be comparable to Germany, France, and Italy; and 1,000 to be comparable to the USA, UK, Netherlands, and Australia. The paper also fits a power-law growth curve to Korean demographic data and projects that the current ~310 PhD astronomers will reach ~550 by 2030, and it discusses Korean R&D expenditure structure as an explanation for the community's perceived vulnerability.
Significance. The paper's main contribution is a carefully documented cross-country dataset of total PhD-level astronomer counts, presented in Table 2 and detailed in the appendix, together with a confirmation, using independent data, of the GDP–astronomer correlation previously found with IAU memberships by Kurtz et al. (2005). The time-series compilation for several countries, including the 30-year Korean series in Table 3, is a useful resource. If the prescriptive target were properly derived, the paper would offer a concrete, falsifiable benchmark (550 by 2030) for science policy. However, the central prescriptive claim is not reproducible from the presented data: the derivation of the numbers 550, 780, and 1,000 is omitted, and the chosen reference class appears post hoc. The empirical correlation is therefore sound, but the headline 'should be 550' claim is not supported as written.
major comments (3)
- [§3.2, Table 2] The target numbers 550, 780, and 1,000 are asserted without showing any calculation. The stated basis—'the current number of astronomers per citizen of other advanced countries'—cannot produce 550 from the data in Table 2. Using the per-citizen PhD densities of Spain (555/49.0), Canada (400/35.6), and Japan (1500/126.5) gives an average density of about 11.5 per million, which times Korea's 51.2 million population yields approximately 590, not 550. The authors must present the exact formula, the reference-class rule, and the arithmetic, or revise the target.
- [§3.2, Figure 4] The paper's own branch regressions are inconsistent with the 550 target. The lower-branch regression, which includes Korea, predicts roughly 420 PhD astronomers at Korea's GDP, while the upper-branch regression predicts roughly 610. The paper neither explains why per-citizen ratios from a mixed reference set (Spain on the upper branch; Canada and Japan on the lower branch) are preferred over these regression predictions, nor reports the regression-based targets. Under any stated estimator, 550 is not uniquely determined by the data.
- [§3.2 reference-class selection] The choice of Spain, Canada, and Japan as benchmarks for Korea is post hoc and unjustified. If the UK, Netherlands, and Australia were used instead, the per-citizen calculation would yield roughly 1,000 (matching the paper's own third target); if Germany, France, and Italy were used, it would yield approximately 780. The three headline targets thus essentially restate the chosen reference classes, with no criterion for why one class is appropriate for Korea. A principled approach—for example, a regression with prediction intervals, or a development-stage matching rule—is needed to make the target robust.
minor comments (4)
- [§4] The conclusion that 'the number of astronomers per citizen is a more important measure than other indicators' is not entailed by the preceding correlation and time-series analyses; the use of per-citizen ratios is an assumption that should be explicitly flagged as such rather than presented as a finding.
- [§3.3, Eq. (N(t))] The power-law fit N(t)=2.35(t−1990)^1.46+35 is presented without uncertainty estimates or goodness-of-fit measures. Since the extrapolation to 550 by 2030 is a headline projection, a confidence interval or residual analysis is needed.
- [Appendix A] There is a citation inconsistency: the text repeatedly cites 'Pold & Ivie 1997', but the reference list entry is 'Pold, J. & Ivie, R. 2017'. Please correct the years and ensure all in-text citations match the reference list.
- [Throughout] Typos and name inconsistencies should be fixed: 'Spainish' in the abstract; 'Canana' in §3.2; 'Repulic' in §4; 'inreasing' in §3.3; 'comminitie' and 'communitie' in §4; 'Hohmannm Glatt' in the introduction; 'Denschrift' and 'Steimetz' in the references; and 'approxiamately-twenty-year-later' in §3.1.
Circularity Check
No circularity found: the correlation analysis and the Korean target are independent benchmark scalings, not derivations from their own conclusions.
full rationale
The paper's derivation chain is self-contained. The central empirical correlation between GDP and the number of PhD astronomers is established using independently collected national demographic/census data and is compared with, not derived from, the earlier external result of Kurtz et al. (2005). The 'proper size' of 550 for Korea is presented in Section 3.2 as a benchmark scaling: the per-capita PhD densities of Spain, Canada, and Japan are applied to Korea's population, so the target is read off from other countries' ratios rather than being defined in terms of Korea's own outcome. The 2030 projection of 550 uses a power-law fit to the Korean time series in Section 3.3, which is an independent extrapolation, not a re-labeling of the target as a prediction. The paper does not fit a parameter to the Korean target and then call it a prediction, and it does not rest on any load-bearing self-citation or imported uniqueness theorem. The exact arithmetic leading to 550 is not shown and the choice of benchmark countries is contestable, but these are robustness or correctness concerns, not circularity. Under the rule that a non-finding is appropriate unless a specific reduction can be exhibited, the appropriate score is 0.
Assumptions & free parameters
free parameters (3)
- Power-law growth coefficients for Korean PhD astronomer count =
amplitude=2.35, exponent=1.46, offset=35
- Upper branch regression: slope and intercept for log10(GDP) versus log10(N_ast) =
slope=0.91, intercept=-8.59
- Lower branch regression: slope and intercept for log10(GDP) versus log10(N_ast) =
slope=0.82, intercept=-7.78
assumptions (4)
- domain assumption Larger economic capacity implies more support for astronomy, so the number of astronomers rises with GDP.
- ad hoc to paper The number of astronomers per citizen is the most appropriate measure for estimating community size.
- ad hoc to paper The two-branch grouping of countries reflects development stage rather than cultural or institutional factors.
- domain assumption The country-level astronomer counts are comparable across nations despite differing definitions and estimation methods.
Cite this review
Pith. "Pith review of Economic Power, Population, and the Size of Astronomical Community." pith.science (2026). https://pith.science/paper/YB3DRKGL
@misc{pith2026190802584,
  author       = {Pith},
  title        = {Pith review of: Economic Power, Population, and the Size of Astronomical Community},
  year         = {2026},
  howpublished = {\url{https://pith.science/paper/YB3DRKGL}},
  note         = {Machine review of arXiv:1908.02584}
}
read the original abstract
The number of astronomers for a country registered to the IAU is known to have a correlation with the GDP. However, the robustness of this relationship can be doubted, because the fraction of astronomers joining the IAU differs from country to country. Here we revisit this correlation by using the recent data updated as of 2017, and then we find a similar correlation by using the total enumeration of astronomers and astrophysicists with PhD degrees and working in each country, instead of adopting the number of IAU members. We confirm the existence of two subgroup in the correlation. One group consists of European advanced countries having long history of modern astronomy, while the other group consists of countries having experienced recent rapid economic development. In order to find causation in the correlation, we obtain the long-term variations of the number of astronomers, population, and the GDP for a number of countries to find that the number of astronomers per citizen for recently developing countries has increased more rapidly as GDP per capita increased, than that for fully developed countries. We collect a demographic data of the Korean astronomical community. From these findings we estimate the proper size of the Korean astronomical community by considering the society's economic power and population. The current number of PhD astronomers working in Korea is approximately 310, but it should be 550 that is large enough to be comparable and competitive to the sizes of Spainish, Canadian, and Japanese astronomical communities. We discuss on the way how to overcome the vulnerability of the Korean astronomical community, based on the statistics of national R&D expenditure structure comparing with that of other major advanced countries.
Figures

Figures from the paper (4 more)


Reference graph
Works this paper leans on
-
[1]
2007, Astronomy in Spain, the Messenger 127, 4
Barcons, X. 2007, Astronomy in Spain, the Messenger 127, 4
work page 2007
-
[2]
Boland, W. & Habing H. 2013, Astronomy in the Netherlands, in Proc. Organizations, People and Strategies in Astronomy 2 (OPSA 2) ed. Heck, A., Venngeist, pp.145-174. http://www.venngeist.org/opsa2_toc.htm
work page 2013
-
[3]
Gorgas, J. 2016, Astronomy in Spain, Segundo Estudio de Recursos Humanos en Astronomia y Astrofisica en Espana, SEA Boletin 35, 38
work page 2016
-
[4]
Hearnshaw, J. N. 2001, Critical Factors for a Successful Astronomical Research Program in a Developing Country. In Astron. Soc. Pacific Conf. Series, A special session on Astronomy in developing countries, ed. Batten, A. H., San Francisco: Astronomical Society of the Pacific, pp.23-27
work page 2001
-
[5]
Hearnshaw, J. N. 2006, A Survey of Published Astronomical Outputs of Countries from 1976 to 2005 and the Dependence of Output on Population, Number of IAU Members and Gross Domestic Product, 2007 in Astronomy for the developing world. In Proc. Astronomy for the developing world, IAU Special Session no.5, eds. Hearnshaw, J. B. & Martinez, P., Cambridge: Ca...
work page 2006
-
[6]
Usage Bibliometrics as a Tool to Measure Research Activity
Henneken, E. & Kurtz, M. J. 2019, Usage Bibliometrics as a Tool to Measure Research Activity, in Springer Handbook of Science and Technology Indicators, eds. W. Glaenzel, H. F. Moed, U. Schmoch, & M. Thelwall, Springer, arXiv:1706.02153
work page Pith review arXiv 2019
-
[7]
Hohmann, E., Glatt, V., & Tetsworth, K. 2017, Worldwide Orthopaedic Research Activity 2010-2014: Publication rates in the top 15 orthopaedic journals related to population size and gross dometic product, World J. Orthopedics, 8, 514
work page 2017
-
[8]
Ip, W. -H. 2017, The Development of Astronomy and Emergence of Astrophysics in Taiwan. In Proc. The Emergence of Astrophysics in Asia: Opening a New Window on the Universe, eds. Nakamura, T & Orchison, W., Basel: Springer International Publishing AG, pp.257-265
work page 2017
Show all 27 references
-
[9]
King, D. A. 2004, The Scientific Impact of Nations, science, 430, 311
2004
-
[10]
Soc., 43, 31
Korean Astronomical Society, 2018, Annual Report of Member Institutes, Bulletin Korean Astron. Soc., 43, 31
2018
-
[11]
Kurtz, M. J. et al. 2005, Worldwide Use and Impact of the NASA Astrophysics Data System Digital Library, J. Amer. Soc. Inform. Sci. Tech., 65, 1
2005
-
[12]
Lee, H. M. et al. 2017, A New Leap of Korean Astronomy: 2017-2022 Development Plan, Daejeon Korea: Korean Astron. Soc., pp.41-42
2017
-
[13]
Lee, S. -Y. & Kim, Y. -R. 2018, Comparison of the National R&D Investment with Those of Major Countries, KISTEP statistics Brief, No.23
2018
-
[14]
Mamon, G. A. 2003, The Selection of Tenured Astronomers in France, in Proc. Organizations and Strategies in Astronomy IV, (ed. Heck, A.), Dordrecht: Kluwer Academic Publishers. http://arXiv:astro-ph/0303552
2003 arXiv
-
[15]
Mamon, G. A. 2018, a private communication
2018
-
[16]
Massey, R. et al. 2017, Our Scientific Community in 2016, Astron. Geophysics, 58, 6.14
2017
-
[17]
May, R. M. 1997, The Scientific Wealth of Nations, Science, 275, 793
1997
-
[18]
McWhinnie, S. 2017, The Demographics and Research Interests of the UK Astronomy and Geophysics Communities 2016, chapter 3: Results from the departmental and research establishment questionnaires, Oxford: Oxford Research and Policy, pp.12-17
2017
-
[19]
Moed, H. F. 2005, Citation Analysis in Research Evaluation, Springer: Dordrecht
2005
-
[20]
2012, The Demography of Astronomy in the United Kingdoms
Murdin, P. 2012, The Demography of Astronomy in the United Kingdoms. in Proc. Organizations, People and Strategies in Astronomy I (OPSA I), ed. Heck, A., Venngeist, pp.55-57
2012
-
[21]
2018, Science and Engineering Indicators 2018
National Science Board. 2018, Science and Engineering Indicators 2018. NSB-2018-1. Alexandria, VA: National Science Foundation. Available at https://www.nsf.gov/statistics/indicators/
2018
-
[22]
& Ivie, R
Pold, J. & Ivie, R. 2017, Summary Results, in Workforce Survey of 2016 US AAS Members, Statistical Research Center of the American Institute of Physics
2017
-
[23]
Ribeiro, V. A. R. M., Russo, P. & Cardenas-Avendano A. 2013, A Survey of Astronomical Research: an Astronomy for Development Baseline, AJ, 146, 138
2013
-
[24]
Sadler, E. M. 2017, The Future of Astronomy in Australia, nature astronomy, 1, 592
2017
-
[25]
2000, What will be the Future of Astronomical Research Environment? – The first demographic survey of astronomers in Japan, Astron
Sawa, T. 2000, What will be the Future of Astronomical Research Environment? – The first demographic survey of astronomers in Japan, Astron. Herald (Tenmongeppo), 93, 29. http://www.asj.or.jp/geppou/archive_open/2000/pdf/20000104c.pdf
2000
-
[26]
2013, Italian Astronomy at the Beginning of the 21st century, in Proc
Sciortino, S. 2013, Italian Astronomy at the Beginning of the 21st century, in Proc. Organizations, People and Strategies in Astronomy 2 (OPSA 2), ed. Heck, A., Venngeist, pp.119-132. http://www.venngeist.org/opsa2_toc.htm
2013
-
[27]
Steimetz, M., 2018, a private communication
2018
Reviewed August 14, 2026 · model on record in the stance chip above.
Discussion (0). Continue with ORCID to comment.