REVIEW 3 major objections 4 minor 48 references
The power of dynamic social networks to predict individuals' mental health
T0 review · 3 major / 4 minor · reviewed 2026-08-14 · deepseek-v4-flash
Pith's one-line read Weekly changes in a person's texting network predict depression and anxiety more accurately than static network features, non-network phone use, a recommender-system baseline, or random guessing, on the same college dataset.
desk verdict Dynamic network features likely improve mental health prediction, but the reported Wilcoxon p-values are impossible with five paired runs, so the central claim needs a statistical fix before it is credible. read the letter →
The pith
A machine-rendered reading of the paper's core claim, the machinery that carries it, and where it could break.
The reading
What carries the argument
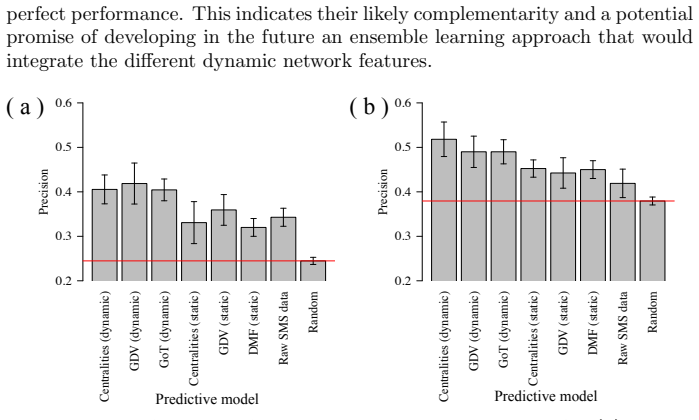
The load-bearing object is the dynamic social network, built as 31 weekly snapshots from SMS logs, with an edge between two people in a week if they exchanged at least one text. Three node-level feature families carry the argument: dynamic centrality, eight centrality measures converted to ranks in each snapshot and concatenated into a 248-dimensional vector; dynamic graphlet degree vectors, which count how often a node takes part in each small connected temporal subgraph type; and graphlet orbit transitions, which count how often a static graphlet type around a node changes into another type between consecutive weekly snapshots. The static comparison uses the same centrality measures collapsed over all weeks and static graphlet degree vectors, and the fairness argument is that each dynamic feature has a direct static counterpart, except graphlet orbit transitions, which have none. Logistic regression on PCA-reduced features is the shared classifier.
What would settle it
Shuffle the order of the 31 weekly snapshots separately for each individual and rerun the dynamic-centrality classifier; if prediction accuracy does not drop, temporal ordering is not what carries the signal, and the static network contains the same information.
Extended reading notes
Core claim
The paper's central claim is that dynamic social network data are more predictive of an individual's depression and anxiety status than static social network data, non-network phone-use data, or a recommender-system baseline, on the same data and under the same classifier. For each of three dynamic feature sets—evolving centrality ranks, dynamic graphlet degree vectors, and graphlet orbit transitions—a logistic regression model significantly outperforms its static counterparts (static centralities and static graphlet degree vectors), the DMF model, a raw SMS-volume model, and random guessing, with adjusted p<0.05 for both depression and anxiety and for all four evaluation measures (precision, recall, F1, accuracy). The dynamic models perform similarly to one another rather than any one dominating, which the paper interprets as likely complementarity. Two preliminary analyses show that depressed and anxious individuals occupy more peripheral network positions and have positions that fluctuate more over time.
Load-bearing premise
The load-bearing premise is that SMS logs reliably measure real-world social relationships, so that a person's texting centrality and its instability reflect genuine social connectedness and isolation; if texting volume is dominated by logistics or platform habits, the predictive signal would not transfer to the social-support mechanism the paper invokes.
Editorial extensions
If this is right
- Mental-health screening could run on passive smartphone metadata, with risk scores updated week by week as a person's network position shifts.
- Because the three dynamic feature families reach similar accuracy with different errors, an ensemble of all three is the natural route to further gains.
- Depression and anxiety are marked not only by having fewer contacts but by more volatile contact patterns; models that ignore time collapse this distinction.
- Static-network recommender-system models for mental health should be re-built on temporal network data to recover information lost by aggregation.
Reading between the lines
- Editorial extension: the dynamic-centrality feature has 248 dimensions while its static counterpart has 8, so a static feature expanded to comparable dimensionality before PCA would isolate whether the gain comes from temporality or from richer descriptive capacity.
- Editorial extension: since only SMS channels were used, testing the same models on call logs, co-location, or messaging-app metadata would show whether the dynamic-network signal is specific to texting or generalizes to other interaction channels.
- Editorial extension: the observational design cannot separate selection from influence—people who become depressed may withdraw from texting, or withdrawal may precede depression—so panel-style temporal modeling is needed to test which direction dominates.
Signed reviews
Editorial analysis
A structured set of objections, weighed in public.
Referee Report
Summary. The paper uses NetHealth smartphone SMS logs (31 weekly snapshots, August 2015-August 2016) for 576 iPhone users, of whom 274 have depression/anxiety survey labels, to ask whether dynamic social network features are more predictive of mental health than static network or non-network alternatives. The authors perform three tasks: comparing centrality magnitudes and fluctuations between depressed/anxious and non-depressed/non-anxious individuals; clustering individuals by their evolving centrality profiles and testing enrichment in mental health outcomes; and training logistic regression classifiers on three dynamic features (dynamic centralities, dynamic graphlet degree vectors, graphlet orbit transitions), two static features (static centralities, static GDV), raw SMS counts, a recommender-system baseline (DMF), and a random-guess model. The central claim, stated in Section 3.3 and the abstract, is that all three dynamic-network feature models are significantly more accurate (adjusted p-value < 0.05) than the static, DMF, non-network, and random models for both depression and anxiety across precision, recall, F1, and accuracy, based on 5-fold cross-validation repeated five times.
Significance. If the central claim were fully supported, the paper would make a useful contribution by showing, on the same data and with the same classifier, that temporal network features add predictive value over static and non-network features for mental health outcomes. The paper has real strengths: the comparison is carefully framed so that dynamic and static features are extracted from the same underlying SMS data; the exploratory Tasks 1 and 2 provide supporting evidence that network position is associated with depression and anxiety; and the dynamic graphlet and GoT features are nontrivial, complementary, and of current methodological interest. The supplementary material is promised and the study design is in principle reproducible. However, the headline significance claim rests on a statistical test that, as described in Section 2.2e, cannot produce the reported adjusted p-values. This is an internal mathematical inconsistency, not merely an external-validity concern, and it directly affects the paper's central conclusion.
major comments (3)
- [Section 2.2e / Section 3.3] The Wilcoxon signed-rank test as described cannot yield adjusted p-values below 0.05 for the claims made. With five paired runs of 5-fold cross-validation, the sample size for the signed-rank test is n = 5. The smallest exact two-sided p-value is 1/16 = 0.0625, already above 0.05 before any multiple-testing correction. Even using a one-sided test, the smallest exact p-value is 1/32 = 0.03125, and after Benjamini-Hochberg adjustment across the at least six pairwise comparisons each dynamic model is said to win (two static models, DMF, raw SMS, random, plus comparisons among dynamic models), the smallest achievable adjusted p-value is at least 0.03125 x 6 = 0.1875. Unless the authors used a different procedure (e.g., a normal approximation, a different test, or unadjusted p-values), the statement in Section 3.3 that all three dynamic models are significantly more accurate with adjusted p-value < 0.05 is unsupported. The paper should state exactly which test, which number of comparisons, and which p-value adjustment was used, and it should report the pairwise p-values and effect sizes. If the described five-run protocol is retained, the central claim cannot be made as stated; more cross-validation repeats or an alternative analysis are needed.
- [Section 2.2e / Section 3.3] The manuscript does not report the actual adjusted p-values for any pairwise model comparison. The statement 'significantly more accurate (adjusted p-value<0.05)' is asserted globally for all three dynamic models, both outcomes, and all four evaluation measures, but no table or figure shows the comparison counts, the raw p-values, or which comparisons were included in the multiple-testing correction. Without these details, the central comparison cannot be verified or reproduced. Please provide a complete table of pairwise p-values and adjusted p-values, or otherwise make the full comparison results available.
- [Section 2.1 / Section 4] The temporal relationship between the SMS-derived network features and the survey-derived mental health labels is not specified. The study period runs from August 2015 to August 2016, and the features are computed over the 31 weekly snapshots of that same period, but it is not stated when the depression and anxiety surveys were administered relative to the SMS data. If the labels were collected during or at the end of the same interval, the model performs concurrent classification rather than prospective prediction. This affects the interpretation of 'predict' in the title and abstract, and it should be clarified or the language should be tempered accordingly.
minor comments (4)
- [Section 2.2d / Section 3.3] The choice of the 'best' pre- versus post-PCA version of each feature appears to be made based on performance in the same five cross-validation runs used for evaluation. If the PCA dimensionality or the pre/post selection is chosen using test-fold performance, this can introduce selection bias. Please describe the PCA dimensionality selection procedure and clarify whether it was nested inside the cross-validation loop.
- [Section 3.3] The statement that the three dynamic models 'perform similarly, with none of them having perfect performance' is not a statistical comparison. The paper should either test differences among the dynamic models or explicitly refrain from interpreting their relative performance.
- [Abstract / Introduction, Table 1] The claim of being 'the first' to develop predictive mental-health models from dynamic social network data should be qualified in light of the concurrent work [26] acknowledged in Section 1. The current wording is stronger than the body of the paper supports.
- [Section 2.1 / Section 3.1] The paper equates SMS logs with 'social interactions' and interprets the Task 1 results as validating smartphone data as a proxy for real-world friendships. This is an external-validity assumption, not established by the data. A brief limitation statement and, if feasible, a sensitivity analysis using another communication channel (e.g., call logs) would strengthen the paper.
Circularity Check
No circularity: network features and mental health labels are independently sourced, and the dynamic-vs-static comparisons are standard supervised evaluations against computed baselines.
full rationale
The paper's derivation chain is not circular. The predictive target (depression/anxiety survey labels for 274 individuals, Section 2.1) is generated independently of the SMS-derived network features (centralities, dynamic GDV, GoT, static GDV, raw SMS counts, Sections 2.2a-c). The central claim in Section 3.3 that dynamic feature models outperform static, DMF, non-network, and random baselines is supported by computing all baselines from the same input data and comparing them under the same 5-fold cross-validation protocol, so the comparison does not reduce to a fitted parameter or an identity. The cited prior work [28] is used as a DMF baseline and as motivation; it is not invoked as proof of the new dynamic-vs-static result. Self-citations to the authors' dynamic graphlet and centrality methods [14,22,27,31,33] supply feature definitions and are not used to force the outcome. The only serious concern raised by the text is statistical: with five paired CV runs, the Wilcoxon signed-rank test cannot produce an adjusted p-value below 0.05 for the claimed comparisons (Section 2.2e), but this is an internal correctness/significance issue, not circularity: the reported result being unsupported does not mean it was assumed in the feature construction or model inputs. Therefore no step satisfies the requirement of exhibiting an input-output equivalence by construction.
Assumptions & free parameters
free parameters (2)
- k (number of clusters in Task 2) =
4
- PCA dimensionality =
not reported
assumptions (3)
- domain assumption SMS communication logs are a valid proxy for social interactions between individuals.
- domain assumption The 615 iPhone users and the 274 individuals with mental health trait data are representative of the NetHealth cohort and of the broader student population.
- standard math Standard statistical assumptions of the Wilcoxon signed-rank test and logistic regression hold, including independence of runs.
Cite this review
Pith. "Pith review of The power of dynamic social networks to predict individuals' mental health." pith.science (2026). https://pith.science/paper/VZIAD5N7
@misc{pith2026190802614,
  author       = {Pith},
  title        = {Pith review of: The power of dynamic social networks to predict individuals' mental health},
  year         = {2026},
  howpublished = {\url{https://pith.science/paper/VZIAD5N7}},
  note         = {Machine review of arXiv:1908.02614}
}
read the original abstract
Precision medicine has received attention both in and outside the clinic. We focus on the latter, by exploiting the relationship between individuals' social interactions and their mental health to develop a predictive model of one's likelihood to be depressed or anxious from rich dynamic social network data. To our knowledge, we are the first to do this. Existing studies differ from our work in at least one aspect: they do not model social interaction data as a network; they do so but analyze static network data; they examine "correlation" between social networks and health but without developing a predictive model; or they study other individual traits but not mental health. In a systematic and comprehensive evaluation, we show that our predictive model that uses dynamic social network data is superior to its static network as well as non-network equivalents when run on the same data.
Figures


Figures from the paper (1 more)
Reference graph
Works this paper leans on
-
[26]
S. Lin, L. Faust, P. Robles-Granda, T. Kajdanowicz, and N. V. Chawla. Social network structure is predictive of health and wellness. PLOS ONE, 14(6):e0217264, 2019
work page 2019
-
[1]
H. Abdi. Coefficient of variation. Encyclopedia of Research Design, 1:169– 171, 2010
work page 2010
-
[2]
M. M. Aldarwish and H. F. Ahmad. Predicting depression levels using social media posts. In IEEE 13th International Symposium on Autonomous Decentralized System, pages 277–280. IEEE, 2017
work page 2017
-
[3]
F. M. Alpass and S. Neville. Loneliness, health and depression in older males. Aging & Mental Health , 7(3):212–216, 2003
work page 2003
-
[4]
D. Apar´ ıcio, P. Ribeiro, T. Milenkovi´ c, and F. Silva. Temporal network alignment via got-wave. Bioinformatics, 2019
work page 2019
-
[5]
D. Apar´ ıcio, P. Ribeiro, and F. Silva. Graphlet-orbit transitions (got): A fingerprint for temporal network comparison.PLOS ONE, 13(10):e0205497, 2018
work page 2018
-
[6]
M. Berk, A. Brnabic, S. Dodd, K. Kelin, M. Tohen, G. S. Malhi, L. Berk, P. Conus, and P. D. McGorry. Does stage of illness impact treatment re- sponse in bipolar disorder? empirical treatment data and their implication for the staging model and early intervention. Bipolar Disorders, 13(1):87– 98, 2011
work page 2011
-
[7]
A. Bogomolov, B. Lepri, M. Ferron, F. Pianesi, and A. S. Pentland. Daily stress recognition from mobile phone data, weather conditions and individ- ual traits. In Proceedings of the 22nd ACM International Conference on Multimedia, pages 477–486. ACM, 2014
work page 2014
Show all 48 references
-
[8]
Bollen, B
J. Bollen, B. Gon¸ calves, G. Ruan, and H. Mao. Happiness is assortative in online social networks. Artificial Life, 17(3):237–251, 2011
2011
-
[9]
N. A. Christakis and J. H. Fowler. The spread of obesity in a large social network over 32 years. New England Journal of Medicine , 2007(357):370– 379, 2007
2007
-
[10]
N. A. Christakis and J. H. Fowler. The collective dynamics of smoking in a large social network. New England Journal of Medicine, 358(21):2249–2258, 2008
2008
-
[11]
N. K. Cobb, A. L. Graham, and D. B. Abrams. Social network structure of a large online community for smoking cessation. American Journal of Public Health, 100(7):1282–1289, 2010
2010
-
[12]
De Choudhury, M
M. De Choudhury, M. Gamon, S. Counts, and E. Horvitz. Predicting depression via social media. ICWSM, 13:1–10, 2013. 14
2013
-
[13]
L. R. Drumond, E. Diaz-Aviles, L. Schmidt-Thieme, and W. Nejdl. Op- timizing multi-relational factorization models for multiple target relations. In Proceedings of the 23rd ACM International Conference on Conference on Information and Knowledge Management , pages 191–200. ACM, 2014
2014
-
[14]
F. E. Faisal and T. Milenkovi´ c. Dynamic networks reveal key players in aging. Bioinformatics, 30(12):1721–1729, 2014
2014
-
[15]
Faust, R
L. Faust, R. Purta, D. Hachen, A. Striegel, C. Poellabauer, O. Lizardo, and N. V. Chawla. Exploring compliance: Observations from a large scale fitbit study. In Proceedings of the 2nd International Workshop on Social Sensing, pages 55–60. ACM, 2017
2017
-
[16]
L. K. George, D. G. Blazer, D. C. Hughes, and N. Fowler. Social sup- port and the outcome of major depression. British Journal of Psychiatry , 154(4):478–485, 1989
1989
-
[17]
Glenn and S
T. Glenn and S. Monteith. New measures of mental state and behavior based on data collected from sensors, smartphones, and the internet. Cur- rent Psychiatry Reports, 16(12):523, 2014
2014
-
[18]
Gligorijevi´ c, N
V. Gligorijevi´ c, N. Malod-Dognin, and N. Prˇ zulj. Integrative methods for analyzing big data in precision medicine. Proteomics, 16(5):741–758, 2016
2016
-
[19]
S. C. Guntuku, D. B. Yaden, M. L. Kern, L. H. Ungar, and J. C. Eichstaedt. Detecting depression and mental illness on social media: an integrative review. Current Opinion in Behavioral Sciences , 18:43–49, 2017
2017
-
[20]
S. A. Haas, D. R. Schaefer, and O. Kornienko. Health and the struc- ture of adolescent social networks. Journal of Health and Social Behavior , 51(4):424–439, 2010
2010
-
[21]
M. L. Hatzenbuehler, K. A. McLaughlin, and Z. Xuan. Social networks and risk for depressive symptoms in a national sample of sexual minority youth. Social Science & Medicine , 75(7):1184–1191, 2012
2012
-
[22]
Hulovatyy, H
Y. Hulovatyy, H. Chen, and T. Milenkovi´ c. Exploring the structure and function of temporal networks with dynamic graphlets. Bioinformatics, 31(12):i171–i180, 2015
2015
-
[23]
Y. Koren. Collaborative filtering with temporal dynamics. In Proceedings of the 15th ACM SIGKDD International Conference on Knowledge Discovery and Data Mining , pages 447–456. ACM, 2009
2009
-
[24]
Krause, R
J. Krause, R. James, and D. Croft. Personality in the context of social networks. Philosophical Transactions of the Royal Society B: Biological Sciences, 365(1560):4099–4106, 2010
2010
-
[25]
C. A. Latkin and A. R. Knowlton. Social network assessments and inter- ventions for health behavior change: a critical review. Behavioral Medicine, 41(3):90–97, 2015. 15
2015
-
[27]
S. Liu, D. Hachen, O. Lizardo, C. Poellabauer, A. Striegel, and T. Milenkovi´ c. Network analysis of the nethealth data: exploring co- evolution of individuals’ social network positions and physical activities. Applied Network Science, 3(1):45, 2018
2018
-
[28]
S. Liu, F. Vahedian, D. Hachen, O. Lizardo, C. Poellabauer, A. Striegel, and T. Milenkovic. Heterogeneous network approach to predict individuals’ mental health. arXiv preprint arXiv:1906.04346 , 2019
1906 arXiv
-
[29]
Malod-Dognin, J
N. Malod-Dognin, J. Petschnigg, and N. Prˇ zulj. Precision medicine—a promising, yet challenging road lies ahead. Current Opinion in Systems Biology, 7:1–7, 2018
2018
-
[30]
P. D. McGorry. Early intervention in psychosis: obvious, effective, overdue. Journal of Nervous and Mental Disease , 203(5):310, 2015
2015
-
[31]
L. Meng, Y. Hulovatyy, A. Striegel, and T. Milenkovi´ c. On the interplay between individuals’ evolving interaction patterns and traits in dynamic multiplex social networks. IEEE Transactions on Network Science and Engineering, 3(1):32–43, 2016
2016
-
[32]
Milenkovi´ c, V
T. Milenkovi´ c, V. Memiˇ sevi´ c, A. Bonato, and N. Prˇ zulj. Dominating bio- logical networks. PLOS ONE, 6(8):e23016, 2011
2011
-
[33]
Milenkovi´ c and N
T. Milenkovi´ c and N. Prˇ zulj. Uncovering biological network function via graphlet degree signatures. Cancer Informatics, 6:CIN–S680, 2008
2008
-
[34]
D. C. Mohr, M. Zhang, and S. M. Schueller. Personal sensing: understand- ing mental health using ubiquitous sensors and machine learning. Annual Review of Clinical Psychology , 13:23–47, 2017
2017
-
[35]
W. S. Noble. How does multiple testing correction work? Nature Biotech- nology, 27(12):1135, 2009
2009
-
[36]
Pastor-Satorras, C
R. Pastor-Satorras, C. Castellano, P. Van Mieghem, and A. Vespignani. Epidemic processes in complex networks. Reviews of Modern Physics , 87(3):925, 2015
2015
-
[37]
J. M. Perkins, S. Subramanian, and N. A. Christakis. Social networks and health: a systematic review of sociocentric network studies in low-and middle-income countries. Social Science & Medicine , 125:60–78, 2015
2015
-
[38]
Prˇ zulj, D
N. Prˇ zulj, D. G. Corneil, and I. Jurisica. Modeling interactome: scale-free or geometric? Bioinformatics, 20(18):3508–3515, 2004. 16
2004
-
[39]
Purta, S
R. Purta, S. Mattingly, L. Song, O. Lizardo, D. Hachen, C. Poellabauer, and A. Striegel. Experiences measuring sleep and physical activity pat- terns across a large college cohort with fitbits. In Proceedings of the 2016 ACM International Symposium on Wearable Computers , pages 28–
2016
-
[40]
J. N. Rosenquist, J. H. Fowler, and N. A. Christakis. Social network de- terminants of depression. Molecular Psychiatry, 16(3):273, 2011
2011
-
[41]
A. Sano, A. J. Phillips, Z. Y. Amy, A. W. McHill, S. Taylor, N. Jaques, C. A. Czeisler, E. B. Klerman, and R. W. Picard. Recognizing academic performance, sleep quality, stress level, and mental health using personality traits, wearable sensors and mobile phones. In IEEE 12th ...
-
[42]
D. R. Schaefer, O. Kornienko, and A. M. Fox. Misery does not love com- pany: Network selection mechanisms and depression homophily. American Sociological Review, 76(5):764–785, 2011
2011
-
[43]
M. H. Schafer. Health and network centrality in a continuing care retire- ment community. Journals of Gerontology Series B: Psychological Sciences and Social Sciences, 66(6):795–803, 2011
2011
-
[44]
Staiano, B
J. Staiano, B. Lepri, N. Aharony, F. Pianesi, N. Sebe, and A. Pentland. Friends don’t lie: inferring personality traits from social network structure. In Proceedings of the 2012 ACM Conference on Ubiquitous Computing , pages 321–330. ACM, 2012
2012
-
[45]
T. W. Valente and S. R. Pitts. An appraisal of social network theory and analysis as applied to public health: Challenges and opportunities. Annual Review of Public Health , 38:103–118, 2017
2017
-
[46]
X. Wang, C. Zhang, and L. Sun. An improved model for depression de- tection in micro-blog social network. In 2013 IEEE 13th International Conference on Data Mining Workshops (ICDMW) , pages 80–87. IEEE, 2013
2013
-
[47]
Wongkoblap, M
A. Wongkoblap, M. A. Vadillo, and V. Curcin. Researching mental health disorders in the era of social media: Systematic review. Journal of Medical Internet Research, 19(6), 2017
2017
-
[48]
Y. Youm, E. O. Laumann, K. F. Ferraro, L. J. Waite, H. C. Kim, Y.- R. Park, S. H. Chu, W.-t. Joo, and J. A. Lee. Social network properties and self-rated health in later life: comparisons from the korean social life, health, and aging project and the national social life, heal...
2014
Reviewed August 14, 2026 · model on record in the stance chip above.
Discussion (0). Continue with ORCID to comment.