REVIEW 4 major objections 5 minor 2 references
Climate simulations of early Mars with estimated precipitation, runoff, and erosion rates
T0 review · 4 major / 5 minor · reviewed 2026-08-14 · deepseek-v4-flash
Pith's one-line read Early Mars stayed warm and semi-arid near the freezing point, and a large northern ocean supplied the rain that carved the valley networks.
desk verdict A transparent scenario-building paper whose central 'necessity' claim is not supported by its own sensitivity tests — the precipitation parameterization is too fragile to carry that load, but the EBM framework is worth engaging. read the letter →
The pith
A machine-rendered reading of the paper's core claim, the machinery that carries it, and where it could break.
The reading
What carries the argument
The load-bearing object is the Mars Energy Balance Model (MEBM), a latitudinally resolved climate model with 36 five-degree latitude bands that couples diffusive atmosphere-ocean heat transport to radiative fluxes computed by a single-column radiative-convective model. Its precipitation parameterization integrates the column of water vapor above each latitude band and removes it on a terrestrial-calibrated timescale of 13.5 days, scaled by ocean area relative to Earth's 70% ocean coverage; runoff is then precipitation minus transmission and evaporation losses, and erosion is estimated with the Universal Soil Loss Equation. The warming mechanism is CO2-H2 collision-induced absorption, the infrared absorption that occurs when CO2 and H2 molecules collide, with the paper running both a lower-bound and an upper-bound case for its strength. These pieces translate greenhouse-gas amounts and ocean size into surface temperatures, precipitation, runoff, and erosion rates.
What would settle it
Lower the assumed globally uniform surface humidity from 77% to 69%, as the paper itself does in its sensitivity study, and the 1.85-bar CO2, 5% H2 large-ocean case produces virtually no runoff; a paleoclimate reconstruction showing that warm early Mars was that dry would therefore overturn the claim that rain carved the valleys.
Extended reading notes
Core claim
The paper's central claim is that forming the valley networks required mean annual surface temperatures near or slightly above the freezing point of water, and that such warmth was achievable with a CO2-H2 atmosphere under the faint young Sun. Using an energy balance model that includes a northern lowlands ocean, the authors find that a large ocean—comparable to the one inferred from global valley and delta distributions—is needed to supply enough precipitation; smaller oceans produce little or no runoff. Modeled mean runoff is roughly 0.1-2 mm/day, with peak values of about 2-9 mm/day in enhanced-precipitation cases, overlapping the lower range of geologically inferred runoff for Martian valley networks. The computed erosion rates imply that valley formation could have been completed in about $10^{4}$-$10^{7}$ years. The paper also finds that colder climates, even with seasonal melting, cannot generate the needed runoff, and that once surface ice coverage passes a threshold the atmosphere collapses into a permanently glaciated state. The authors conclude that early Mars was warm and semi-arid rather than warm and tropical, and that episodic warming mechanisms were not required.
Load-bearing premise
The claim that rain carved the valleys depends on early Mars having a fairly humid, Earth-like atmosphere with 77% surface humidity and rain that forms on a 13.5-day cycle; if the air was drier or more variable, the modeled runoff mostly disappears.
Editorial extensions
If this is right
- Valley network formation sets a lower bound on early Mars temperature: mean annual surface temperature near 270-280 K, because colder climates produce negligible runoff in the model.
- A northern lowlands ocean covering at least roughly 20-36% of the planet is required; with ocean areas near 9% of the surface, runoff is effectively zero.
- Rain, not snowmelt, was the dominant erosive agent, even in cases with mean temperatures slightly below freezing.
- A single warm, semi-arid interval of $10^{4}$-$10^{7}$ years could have produced the observed erosion, so cold-climate episodic warming mechanisms are not needed to explain the valleys.
- The warm solution is tied to CO2-H2 collision-induced absorption; if the real CIA strength lies at the lower end, the required CO2 pressures exceed current paleopressure estimates, while the upper end keeps them below about 2 bar.
Reading between the lines
- If the true CO2-H2 absorption lies between the two endmembers, the same model predicts that ocean coverage, not just greenhouse gas abundance, controls whether a reduced-mantle planet can sustain surface runoff.
- The strong dependence on surface humidity suggests a testable chain: any paleoclimate reconstruction of near-surface humidity on early Mars, from isotope or mineral records, would directly scale the predicted runoff up or down by large factors.
- The flat-topography assumption could be tested by re-running this type of model with a gradually growing Tharsis bulge; the paper's logic implies that rainfall in Arabia Terra should weaken as Tharsis rises, matching the observed concentration of inverted channels before major Tharsis uplift.
- If valley formation really took only $10^{4}$-$10^{7}$ years, the late Noachian-early Hesperian boundary may record a rapid climate transition rather than a long uniform warm epoch; crater counts on valley networks could look for that narrow time window.
Signed reviews
Editorial analysis
A structured set of objections, weighed in public.
Referee Report
Summary. The paper presents a latitudinally resolved energy balance model (MEBM) of early Mars, coupled to a 1-D radiative-convective model with CO2-H2 collision-induced absorption, ocean heat transport, sea ice, and water/CO2 cloud effects. The authors compute precipitation via an Earth-calibrated parameterization, then derive runoff and USLE-based erosion rates for a range of CO2/H2 abundances, CIA choices, ocean sizes, and sensitivity cases. They compare these rates to geomorphic estimates for Noachian valley networks and conclude that mean surface temperatures near or slightly above 273 K and a relatively large northern lowlands ocean were necessary to carve the valley networks, with warm intervals of ~10^4–10^7 yr.
Significance. If its central claim held, the paper would provide an important bridge between CO2-H2 greenhouse calculations and the geomorphic record, supporting a warm, semi-arid early Mars and weakening the case for transient cold-climate melting. The model is transparent, the code and data are deposited, and the authors perform a commendable set of sensitivity tests (cloud cover, heat transport, ocean size, CIA assumptions). However, the quantitative runoff/erosion results are strongly conditioned by a small number of tunable parameters, especially surface relative humidity and the precipitation timescale, so the 'necessary' conclusion is not established at the same level as the scenario demonstrations.
major comments (4)
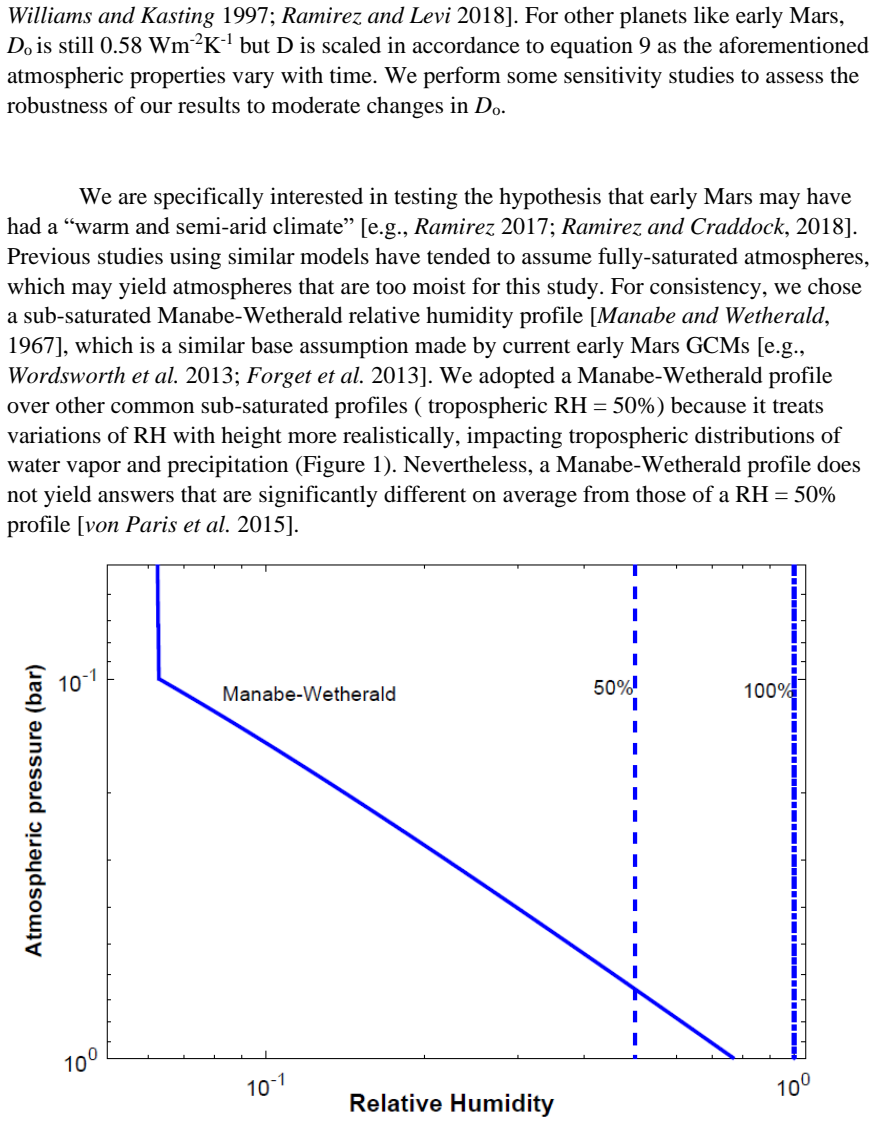
- [§4.8, Eq. (10)] The sensitivity analysis at RH = 0.69 is load-bearing for the central claim. As the authors state, a 10% decrease in surface relative humidity from 0.77 to 0.69 (with all else equal) reduces precipitation to (0.69/0.77)^3 ≈ 72% of baseline and leaves the 1.85 bar CO2, 5% H2 large-ocean case with 'virtually no runoff.' Because RH = 0.77 is taken from the terrestrial Manabe-Wetherald profile and is not independently constrained for a warm early Mars, and because the authors argue against RH = 0.69 partly on the grounds that it is 'inconsistent with the abundant fluvial evidence' – the very evidence the model is intended to explain – the agreement with the geologic runoff estimates in Table 1 is not an independent confirmation. The abstract and conclusions should either soften 'necessary' to a consistency claim or present a dedicated, physically motivated RH probability range rather than a single profile.
- [§3.4] The factor-of-2 precipitation scaling used to bring mean runoff into agreement with Table 1 is post hoc. In the baseline calculation, modeled mean runoff is ~0.1–0.2 mm/day for the large-ocean 1.85 bar CO2, 5% H2 case, whereas the inferred mean runoff values in Table 1 range from 0.69 to 9.69 mm/Mars day. After multiplying precipitation by 2, the model produces mean runoff of ~0.37–1.8 mm/day, which still only reaches the lower end of the geologic estimates. Reporting this scaled case as 'agree even better' with Table 1 obscures the fact that the tuning direction is set by the target; the comparison should be presented as a sensitivity envelope, with the baseline mismatch acknowledged as a limitation of the runoff parameterization.
- [§2.3, Eq. (10)] The ocean-size conclusion is partially built into the precipitation parameterization. Equation (10) contains an explicit multiplicative factor fac = ocean_area/0.7, so global precipitation scales linearly with ocean area. This direct proportionality, combined with the fact that small-ocean cases also have cooler surface temperatures and larger ice cover, means the model is not a clean test of whether a large ocean is 'required.' The text should explicitly state that the large-ocean necessity result reflects the imposed fac dependence and should be tested against a version of the model in which relative humidity and evaporation respond mechanistically to ocean area rather than being held fixed.
- [§4.4, Table 2] The quoted valley-formation duration of ~10^4–10^7 yr is not a robust model prediction because it inherits the full uncertainty of the USLE scaling: soil erodibility K is varied between 0.15 and 0.5, the topographic factor LS is set to 0.5, and the rainfall erosivity index R is the terrestrial relation of Lo (1985). The authors acknowledge order-of-magnitude uncertainty, but the abstract's 'may have been ~<10^7 years' is then treated as a supporting constraint against episodic warming mechanisms. This statement should be explicitly labeled as an order-of-magnitude scenario-dependent estimate, not a constraint that can discriminate among warming mechanisms.
minor comments (5)
- [Introduction, p. 3] In the sentence 'Following this idea, Ramirez el al. [2014a] had suggested...', 'el al.' should be 'et al.'
- [Eq. (10)] The equation as rendered in the preprint text is garbled ('hqP fac r 3 a q a a p hq P fac r rho tau'); please ensure the typeset version clearly displays P = hq qa ra^3 ρa fac / τp, with the relative humidity cubed.
- [Section 4.3] The 1 bar CO2, 10% H2 case is referred to as '272 K' here but as 271 K in Figure S3; please make the temperature values consistent.
- [References] A few references have typographical issues: 'Thekeakara' should be 'Thekaekara'; 'Fasset and Head 2008' should be 'Fassett and Head 2008'; and the Ramirez et al. [2014a] citation in the Introduction is spelled 'Ramirez el al.'
- [Figure 8 caption] The caption states 'Rain, snow, and runoff rates are represented by solid, dotted, and dashed curves, respectively,' but the legend in the panels is not reproduced in the text version; please verify that the printed figure includes a clear legend matching this description, since the line styles are essential for interpretation.
Circularity Check
The runoff validation is partly circular: the high surface RH is justified by the very fluvial evidence the model then 'confirms,' precipitation is scaled up by an ad hoc factor of 2 to match geologic runoff, and the large-ocean requirement is built into Eq. 10 through the ocean-area scaling factor fac.
-
self definitional
[Section 4.8 (constant relative humidity assumption), with Eq. 10 in Section 2.3]
"Using the same RH = 0.69 value as above but applied globally, our model predicts virtually no runoff in the 1.85 bar CO2 5% H2 large ocean case (Figure 8a) unless precipitation efficiency was somehow higher on early Mars (Figure 11) or global surface temperature was higher because cloud cover was low (Figures S1 – S4 ). However, such a dry early Mars is inconsistent with the abundant fluvial evidence and so it is likely that a warm early Mars did not have such a low average surface RH, at least in areas of valley network formation."
The paper uses the fluvial geologic record both as the target to be explained and as the reason for rejecting a relative humidity value that eliminates runoff. Since Eq. 10 makes precipitation proportional to ra^3, adopting ra = 0.77 rather than 0.69 is not an independently constrained choice; it is effectively selected to preserve the runoff signal. The subsequent runoff rates are therefore not an independent confirmation of the warm, large-ocean scenario; they are a consequence of an input justified by the same observations the model is claimed to reproduce.
-
fitted input called prediction
[Section 3.4, Figure 11 (enhanced precipitation sensitivity study)]
"For this calculation, we scale global precipitation (equation 10) up by a factor of 2 and assess the effect on rain, snowfall and runoff rates in this optimistic scenario (Figure 11). ... The mean runoff rates for these cases (~0.37 – 1.8 mm/day) agree even better with the values in Table 1."
The factor-of-2 precipitation enhancement is not derived from a Mars-specific physical constraint; it is applied after the baseline model underpredicts the geologic runoff estimates, and it moves the model into agreement with Table 1. The paper then cites this improved agreement as support for the warm, large-ocean scenario. This is a tuned input masquerading as a corroborating prediction: the match with the independent geologic estimates is partly manufactured by the scaling factor chosen to produce it.
1 more flagged steps
-
self definitional
[Section 2.3, Eq. 10 (ocean-size scaling factor fac); conclusions]
"In our model fac scales precipitation rates by the ocean area divided by 70% of the surface area of Mars."
Because Eq. 10 defines precipitation as proportional to fac = ocean_area / 0.7, the finding that smaller oceans produce less precipitation and runoff, and that a 'sufficiently large' ocean is required to sustain the hydrologic cycle, is an algebraic consequence of the precipitation parameterization rather than an independent model result. The conclusion that a relatively large northern lowlands ocean was necessary is therefore partially built into the input assumptions of the model.
full rationale
The temperature side of the paper is not circular: the MEBM's radiative-convective lookup tables are externally grounded, the CO2-H2 CIA cases are compared against independent laboratory and 1-D calculations, and the warm-climate possibility stands on radiative transfer physics rather than on the runoff results. The circularity appears in the runoff and erosion validation chain. Equation 10 sets precipitation proportional to ra^3 times fac; the paper chooses ra = 0.77, and when a 10% reduction to 0.69 is shown to leave 'virtually no runoff,' the paper rejects that value because it is 'inconsistent with the abundant fluvial evidence.' That is using the observation to set the input and then claiming the observation as confirmation. Similarly, the baseline runoff rates are lower than the geologic estimates, so global precipitation is arbitrarily multiplied by 2 in Section 3.4, after which the mean runoff rates 'agree even better with the values in Table 1.' The large-ocean conclusion is likewise hard-wired through fac in Eq. 10. These three steps mean the quantitative agreement with independent geologic runoff estimates is not an independent test of the central necessity claim. The paper is candid about its assumptions, but the derivation chain for 'mean surface temperatures near or slightly above freezing were necessary' is partially circular: plausible inputs are chosen with the valley-forming observations in view, and the resulting match is presented as corroboration.
Assumptions & free parameters
free parameters (9)
- Precipitation timescale tau_p =
13.5 days
- Surface relative humidity =
0.77 (Manabe-Wetherald profile)
- Water vapor thickness hq =
8.4-8.7 km (3 times water vapor scale height)
- Ocean area scaling fac =
Baseline 36/70; medium 20/70; small 9/70
- Precipitation enhancement factor =
2
- Transmission loss fraction F =
0.35
- Evaporation coefficients Cd and u =
Cd = 1.5e-3, u = 5 m/s
- Water cloud cover =
50%
- USLE soil erodibility K and topographic factor LS =
K = 0.5 or 0.15; LS = 0.5
assumptions (8)
- domain assumption A northern lowlands ocean existed on late Noachian-early Hesperian Mars and covered roughly 36% of the surface (Di Achille and Hynek 2010).
- domain assumption Early Mars had an active, reduced mantle that volcanically outgassed H2 at percent-level concentrations for millions of years.
- domain assumption The bulk of Tharsis was not yet in place, making a flat topography a reasonable first-order assumption.
- domain assumption CO2-H2 collision-induced absorption is bracketed by the N2-H2 proxy and the Wordsworth et al. 2017 cross-sections, with the true value unknown.
- ad hoc to paper An Earth-like Manabe-Wetherald relative humidity profile is representative of a warm early Mars.
- domain assumption Diffusion parameterization with an Earth-calibrated heat transport coefficient D0 = 0.58 W/m2/K approximates early Martian latitudinal heat transport.
- domain assumption USLE and the Osterkamp-Hedman discharge relationships, calibrated on terrestrial streams, apply to early Mars after gravity scaling.
- domain assumption The current valley network distribution is incomplete because polar mantling and later resurfacing removed high-latitude valleys.
Cite this review
Pith. "Pith review of Climate simulations of early Mars with estimated precipitation, runoff, and erosion rates." pith.science (2026). https://pith.science/paper/NYH6MKLN
@misc{pith2026190802647,
  author       = {Pith},
  title        = {Pith review of: Climate simulations of early Mars with estimated precipitation, runoff, and erosion rates},
  year         = {2026},
  howpublished = {\url{https://pith.science/paper/NYH6MKLN}},
  note         = {Machine review of arXiv:1908.02647}
}
read the original abstract
The debate over the early Martian climate is among the most intriguing in planetary science. Although the geologic evidence generally supports a warmer and wetter climate, climate models have had difficulty simulating such a scenario, leading some to suggest that the observed fluvial geology (e.g. valley networks, modified landscapes) on the Martian surface, could have formed in a cold climate instead. However, as we have originally predicted using a single-column radiative-convective climate model [Ramirez et al. 2014a], warming from CO2-H2 collision-induced absorption (CIA) on a volcanically active early Mars could have raised mean surface temperatures above the freezing point, with later calculations showing that this is achievable with hydrogen concentrations as low as ~1%. Nevertheless, these predictions should be tested against more complex models. Here, we use an advanced energy balance model that includes a northern lowlands ocean to show that mean surface temperatures near or slightly above the freezing point of water were necessary to carve the valley networks. Our scenario is consistent with a relatively large ocean as has been suggested. Valley network distributions would have been global prior to subsequent removal processes. At lower mean surface temperatures and smaller ocean sizes, precipitation and surface erosion efficiency diminish. The warm period may have been ~< 10 million years, perhaps suggesting that episodic warming mechanisms were not needed. Atmospheric collapse and permanently glaciated conditions occur once surface ice coverage exceeds a threshold depending on CIA assumptions. Our results support an early warm and semi-arid climate consistent with many geologic observations.
Figures
Reference graph
Works this paper leans on
-
[1]
Di Achille, G. and B.M. Hynek (2010), Ancient ocean on Mars supported by global distribution of deltas and valleys, Nature Geoscience 3,7,
work page 2010
-
[459]
Kasting, J.F., et al. (2014), Remote life-detection criteria, habitable zone boundaries, and the frequency of Earth-like planets around M and late K stars. Proceedings of the National Academy of Sciences, 111, 35, 12641-12646. Ramirez, R.M., et al. (2014b), Can increased atmospheric CO2 levels trigger a runaway greenhouse? Astrobiology 14, 8, 714 -
work page 2014
Reviewed August 14, 2026 · model on record in the stance chip above.
Discussion (0). Continue with ORCID to comment.