REVIEW 4 major objections 7 minor 42 references
Visualizing the PHATE of Neural Networks
T0 review · 4 major / 7 minor · reviewed 2026-08-14 · deepseek-v4-flash
Pith's one-line read M-PHATE makes neural-network training visible by embedding hidden-unit trajectories, revealing catastrophic forgetting and a link between unit heterogeneity and generalization.
desk verdict M-PHATE is a genuinely new multislice kernel construction for visualizing hidden-unit trajectories, but its quantitative headlines rest on single runs and embedding-derived metrics; worth reviewing, not yet established. read the letter →
The pith
A machine-rendered reading of the paper's core claim, the machinery that carries it, and where it could break.
The reading
What carries the argument
The load-bearing construction is the multislice kernel matrix $K$, whose rows and columns index every hidden unit at every epoch. Within an epoch, an adaptive-bandwidth Gaussian kernel (the alpha-decay kernel from PHATE) connects units whose z-scored activation patterns over a sample of inputs are similar; between epochs, a fixed-bandwidth Gaussian kernel connects each unit to itself across time. The kernel is symmetrized, normalized to a random walk, and embedded with PHATE, so the final picture is a diffusion-geometry layout in which time becomes trajectory motion. The paper also uses an Adjusted Rand Index on clusterings of pre- and post-switch slices to quantify structural collapse, and summed per-epoch variance of the embedding as a heterogeneity measure.
What would settle it
Train a fixed three-layer MLP on MNIST under each of the paper's regularization and label-scrambling conditions, then recompute the M-PHATE variance measure while varying the representative sample $Y$ in both size and membership, for instance 100, 500, or 2000 points chosen at random. If the Spearman correlation between summed variance and memorization error does not stay strongly negative across these choices of $Y$, the heterogeneity-generalization link is an artifact of the particular samples shown rather than a property of network training.
Extended reading notes
Core claim
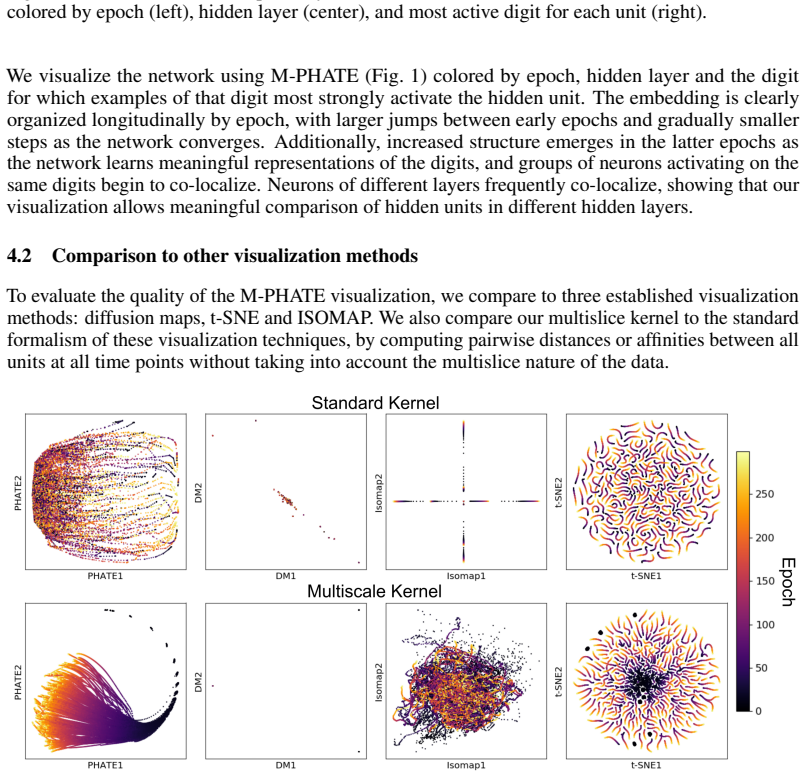
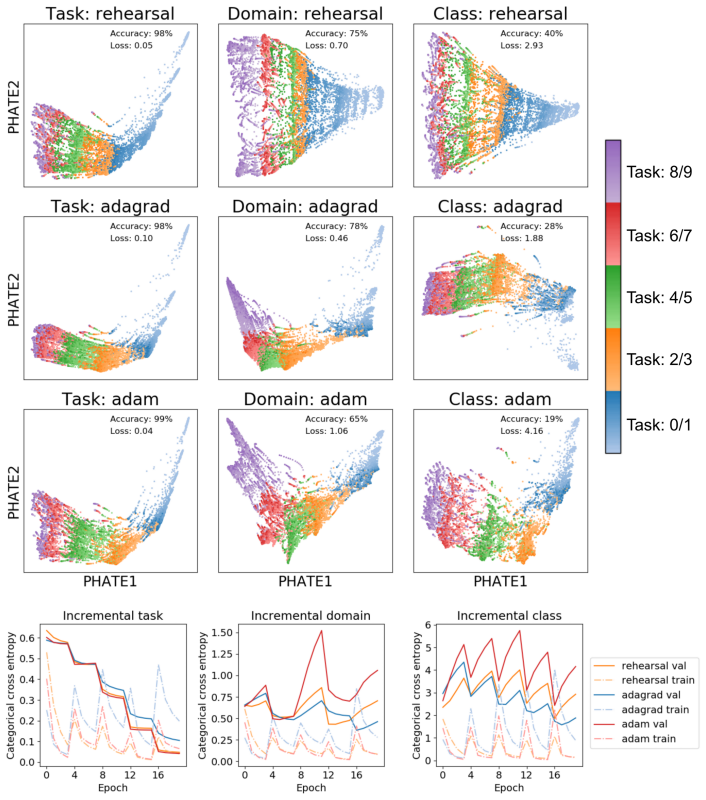
The central discovery is that a time-aware multislice kernel on per-epoch hidden-unit activations, embedded with PHATE, yields a two-dimensional portrait in which each hidden unit is a trajectory over training. The paper argues this portrait exposes mechanisms that scalar metrics hide: in continual learning, the worst-performing optimizers show structural collapse and trajectory crossings at task switches, and the Adjusted Rand Index of cluster assignments before and after a task switch correlates with final validation loss ($\rho = 0.94$); in generalization, the summed variance of the embedding across epochs correlates with memorization error (Spearman $\rho = -0.98$, and $\rho = -0.95$ when only training data are used), so more heterogeneous hidden units coincide with better generalization. Quantitatively, M-PHATE achieves the best intraslice neighborhood preservation among the compared methods and ties t-SNE on interslice preservation, and it has the highest correlation with change in validation loss.
Load-bearing premise
The load-bearing assumption is that the chosen sample of input points, together with per-epoch z-scoring of each unit's activations, preserves the signal that separates learning from memorization; if that sample or normalization discards the relevant information, the visual patterns and correlations will not generalize.
Editorial extensions
If this is right
- M-PHATE can be used during training to inspect learning dynamics from hidden-unit activations alone, so a practitioner does not need validation labels to see when a network is memorizing or losing previously learned structure.
- Catastrophic forgetting manifests as structural collapse and trajectory crossings in the embedding; measuring cluster rearrangement with the Adjusted Rand Index gives a proxy for final validation loss ($\rho = 0.94$).
- The summed variance of the M-PHATE embedding across epochs is a heterogeneity score that correlates with memorization error (Spearman $\rho = -0.98$ on validation-based visualizations, $\rho = -0.95$ when only training data are used), connecting hidden-unit diversity to generalization.
- On the compared feedforward MNIST example, the multislice kernel improves neighborhood preservation over the standard kernel for every dimensionality-reduction method tested, and M-PHATE has the highest correlation with change in validation loss.
Reading between the lines
- Because the method z-scores each unit's activations before building the kernel, it implicitly asserts that the shape, not the magnitude, of activation patterns carries the learning signal; a direct comparison to an unnormalized kernel would test whether scale also matters.
- The heterogeneity-generalization link holds across dropout, L1/L2 regularization, random labels, and random pixels, so it may extend to architecture and optimizer comparisons, where it could serve as a validation-free early-stopping or model-selection signal if the correlation proves stable.
- The multislice graph construction is not specific to neural networks and could be applied to any dynamical system with repeated measurements over time, such as training dynamics of generative models or drift in biological recordings.
Signed reviews
Editorial analysis
A structured set of objections, weighed in public.
Referee Report
Summary. The paper introduces Multislice PHATE (M-PHATE), a visualization method that combines a multislice kernel over hidden-unit activations at different training epochs with the PHATE dimensionality-reduction algorithm. The authors claim this is the first method designed explicitly to visualize how a network's hidden representations evolve during training, and they evaluate it against PHATE, diffusion maps, Isomap, and t-SNE in both standard and multislice variants. Two application vignettes are presented: continual learning, where the visualizations are claimed to reveal catastrophic forgetting, and generalization, where an embedding-derived heterogeneity measure is reported to correlate strongly (rho = -0.98) with memorization error. The paper includes an implementation on GitHub and a supplementary section that repeats the generalization experiment using training data instead of validation data.
Significance. If the quantitative claims hold, M-PHATE would be a useful interpretability tool that connects training dynamics to network performance, and the paper's open-source implementation and the supplementary training-data replication are commendable strengths. The algorithmic construction is clearly specified and reproducible in principle. However, the central quantitative evidence is currently fragile: the headline comparisons rest on a single training run without error bars, one of the key metrics is undefined, the reported correlation in the continual-learning experiment is not reproducible from the tabulated values, and the generalization correlation is computed from the PHATE embedding rather than from raw activations. These issues do not invalidate the method but leave the paper's strongest claims not yet separated from single-configuration luck or embedding artifacts.
major comments (4)
- [§4.2, Table 1] The neighborhood-preservation comparison is based on a single network trained for 300 epochs, with no seeds, error bars, or significance tests. The text also defines a 'Loss Correlation' as the Spearman correlation between the rate of change of each hidden unit and the rate of change of the validation loss, but 'rate of change' is never defined: it is unclear whether this is a per-epoch displacement in the embedding, a difference in activation vectors, or something else. Additionally, the interslice neighborhood-preservation metric is evaluated against the same temporal distances T(:,i) that are explicitly encoded in the M-PHATE interslice kernel, so high scores for M-PHATE partly reflect the kernel construction rather than an independent ground truth. Please report multiple seeds with error bars, define the rate-of-change and loss-correlation metric, and discuss or control for the circularity in the interslice metric.
- [§4.3, Table 2] The Adjusted Rand Index experiment is not reproducible as described. The clustering algorithm applied to the visualization is not specified; the text only mentions '6 different choices of clustering parameter (between 3–8 clusters)'. More importantly, the text claims that the average ARI is strongly negatively correlated with final validation loss (rho = 0.94), but this is internally inconsistent: a negative correlation would have rho < 0, and a Spearman rank correlation over the nine entries in Table 2 gives approximately -0.73, not 0.94. Within the task-learning columns, Adam has the lowest validation loss but the lowest ARI, contradicting the claimed monotone relationship. Please specify the clustering method, report the exact correlation computation, and reconcile the text with the tabulated values.
- [§4.4, Table 3] The headline finding that heterogeneity correlates with generalization (rho = -0.98) uses 'summed variance per epoch of the PHATE visualization' as the measure of heterogeneity. This quantity is computed after PHATE's MDS step with n_landmark = 3000 and an automatically selected diffusion time t, so it can reflect the embedding scale and landmark subsampling rather than any intrinsic property of the hidden units. The supplementary replication with training data is a step in the right direction, but it uses the same embedding pipeline. Please compute the variance directly in the z-scored activation space (or in the multislike kernel space) and show that the correlation is robust to the embedding parameters, or clearly state that the claim concerns the visualization-derived quantity rather than unit heterogeneity.
- [§3.1 and §S6] The construction depends on several free parameters whose influence on the results is not analyzed: the size p and selection procedure of the representative sample Y, the intraslice nearest-neighbor count k, the alpha-decay exponent alpha, and the interslice nearest-neighbor count kappa. Because the quantitative comparisons in Table 1 and the correlations in Tables 2 and 3 are central claims, the paper should include a sensitivity analysis or ablation showing that the conclusions are stable over reasonable ranges of these parameters, or at least report p explicitly.
minor comments (7)
- [§3, heading] The section heading says 'Multiscale PHATE' but the method is called 'Multislice PHATE' elsewhere, including the title and abstract; please use consistent terminology.
- [§3.2] The kernel matrix K is said to be 'an m x nm kernel matrix', but it must be nm x nm since there is one row and column per unit per epoch; please correct this.
- [§3.2] In the piecewise definition of K, the term 'K(i)intraslice(tau, upsilon)' should be 'K(i)interslice(tau, upsilon)', and the sentence before the equations refers to 'epsilon' as the 'fixed intraslice bandwidth' when it is later defined as the interslice bandwidth; please fix these typographical errors.
- [§4.4 and §S2] In the supplementary text, the sentence 'the visualizations are qualitatively very similar to those obtained using training data' appears to say 'training data' where 'validation data' is meant, based on the context; please correct this.
- [Table 3] The column labels in Table 3 appear misaligned in the manuscript text: the row entries number eight, but the header lists nine group labels, and 'Random Pixels' is not clearly represented. Please reformat the table so that each experiment has a distinct, correctly aligned column.
- [§2.1] The discussion of Mucha et al. says 'identical fixed weights for all intraslice connections' where 'interslice' is meant, and the conclusion that 'interslice dynamics are not incorporated' is imprecise because that prior work does use fixed interslice weights; please phrase this more carefully.
- [References] The PHATE reference cites the 2017 bioRxiv preprint; a published version (Moon et al., Nature Biotechnology, 2019) exists and should be cited if appropriate.
Circularity Check
One headline evaluation metric is self-referential (interslice preservation reuses the same temporal distances that define the interslice kernel), but the core M-PHATE construction and the generalization finding are not circular; the validation-data issue is explicitly addressed by an S2 training-data repeat.
-
self definitional
[Section 3.2 (K_interslice definition) and Section 4.2 (interslice neighborhood preservation metric; Table 1)]
"as well as affinities between a hidden unit i and itself at different epochs, or interslice affinities K(i)_interslice(τ,υ)=exp(−‖T(τ,i)−T(υ,i)‖2^2/ϵ2) ... and the interslice neighborhood preservation of V(t,i) as 1/|k| |N^k_V(:,i)(V(τ,i)) ∩ N^k_T(:,i)(T(τ,i))|"
The interslice ground-truth neighborhoods N^k_T(:,i) are defined by the L2 distances between the same unit's activations at different epochs, ||T(τ,i)−T(υ,i)||. Those are exactly the distances used to construct the interslice kernel K_interslice, which is the only cross-epoch information injected into the multislice graph before PHATE is applied. The embedding V is therefore built from a kernel that is a function of these distances, so reporting high interslice neighborhood preservation (Table 1: 0.95 for M-PHATE) largely confirms that the embedding retained the input distances. It is not an independent ground truth about network dynamics.
full rationale
The central M-PHATE construction is not circular: the multislice kernel is defined directly from time-trace activations, the PHATE embedding is applied as described, and no parameter is fitted to the later downstream quantities (validation loss, memorization error, or ARI). The use of validation data in the main generalization experiment is acknowledged in Section 4.4, and Section S2 repeats the experiment using only training data, obtaining a similar Spearman correlation (rho=-0.95), so the reported association between embedding variance and memorization is not forced by validation-data leakage. The PHATE citation [14] is self-citation by overlapping authors, but PHATE is a concrete published algorithm with available code, and the paper's contribution is the multislice kernel on top of it, so the self-citation is not load-bearing in a circular way. The single identified circularity issue is the interslice neighborhood-preservation metric in Section 4.2, where the 'ground truth' distances are the same distances that define the interslice kernel; this makes the quantitative comparison partially self-confirming. Robustness concerns about single training runs and embedding-derived variance are important correctness risks but are not circularity. Overall, the paper's core derivation is self-contained, with one self-referential evaluation metric, giving a score of 4.
Assumptions & free parameters
free parameters (4)
- k (intraslice nearest neighbors) =
2
- alpha (alpha-decay kernel exponent) =
5
- kappa (interslice nearest neighbors) =
25
- p (size of representative sample Y) =
unspecified
assumptions (4)
- domain assumption The activations of hidden units on a representative sample Y capture the network's learned representation geometry.
- domain assumption Per-epoch z-scoring of activations removes only irrelevant scale information, not meaningful signal.
- domain assumption Euclidean distance in z-scored activation space is the appropriate ground truth for hidden-unit similarity and dynamics.
- domain assumption PHATE's diffusion-geometry embedding preserves the structure needed for the visual conclusions.
Cite this review
Pith. "Pith review of Visualizing the PHATE of Neural Networks." pith.science (2026). https://pith.science/paper/M7KIF4XU
@misc{pith2026190802831,
  author       = {Pith},
  title        = {Pith review of: Visualizing the PHATE of Neural Networks},
  year         = {2026},
  howpublished = {\url{https://pith.science/paper/M7KIF4XU}},
  note         = {Machine review of arXiv:1908.02831}
}
read the original abstract
Understanding why and how certain neural networks outperform others is key to guiding future development of network architectures and optimization methods. To this end, we introduce a novel visualization algorithm that reveals the internal geometry of such networks: Multislice PHATE (M-PHATE), the first method designed explicitly to visualize how a neural network's hidden representations of data evolve throughout the course of training. We demonstrate that our visualization provides intuitive, detailed summaries of the learning dynamics beyond simple global measures (i.e., validation loss and accuracy), without the need to access validation data. Furthermore, M-PHATE better captures both the dynamics and community structure of the hidden units as compared to visualization based on standard dimensionality reduction methods (e.g., ISOMAP, t-SNE). We demonstrate M-PHATE with two vignettes: continual learning and generalization. In the former, the M-PHATE visualizations display the mechanism of "catastrophic forgetting" which is a major challenge for learning in task-switching contexts. In the latter, our visualizations reveal how increased heterogeneity among hidden units correlates with improved generalization performance. An implementation of M-PHATE, along with scripts to reproduce the figures in this paper, is available at https://github.com/scottgigante/M-PHATE.
Figures

Figures from the paper (1 more)

Reference graph
Works this paper leans on
-
[1]
Bobak Shahriari, Kevin Swersky, Ziyu Wang, Ryan P. Adams, and Nando de Freitas. Taking the human out of the loop: A review of bayesian optimization. Proceedings of the IEEE, 104 (1):148–175, 2016. doi: 10.1109/JPROC.2015.2494218. URL https://doi.org/10.1109/ JPROC.2015.2494218
arXiv 2016
-
[2]
Goodfellow, Wojciech Zaremba, Vicki Cheung, Alec Radford, and Xi Chen
Tim Salimans, Ian J. Goodfellow, Wojciech Zaremba, Vicki Cheung, Alec Radford, and Xi Chen. Improved techniques for training gans. In Advances in Neural Information Processing Systems 29: Annual Conference on Neural Information Processing Systems 2016, December 5-10, 2016, Barcelona, Spain, pages 2226–2234, 2016. URL http://papers.nips.cc/paper/ 6125-impr...
work page 2016
-
[3]
Are gans created equal? A large-scale study
Mario Lucic, Karol Kurach, Marcin Michalski, Sylvain Gelly, and Olivier Bousquet. Are gans created equal? A large-scale study. In Advances in Neural Information Processing Systems 31: Annual Conference on Neural Information Processing Systems 2018, NeurIPS 2018, 3-8 December 2018, Montréal, Canada., pages 698–707, 2018. URL http://papers.nips.cc/ paper/73...
work page 2018
-
[4]
Ian J. Goodfellow and Oriol Vinyals. Qualitatively characterizing neural network optimization problems. In 3rd International Conference on Learning Representations, ICLR 2015, San Diego, CA, USA, May 7-9, 2015, Conference Track Proceedings, 2015. URL http://arxiv.org/ abs/1412.6544
arXiv 2015
-
[5]
Visualizing the loss landscape of neural nets
Hao Li, Zheng Xu, Gavin Taylor, Christoph Studer, and Tom Goldstein. Visualizing the loss landscape of neural nets. In Advances in Neural Information Processing Systems 31: Annual 9 Conference on Neural Information Processing Systems 2018, NeurIPS 2018, 3-8 December 2018, Montréal, Canada., pages 6391–6401, 2018. URL http://papers.nips.cc/paper/ 7875-visu...
work page 2018
-
[6]
Yann LeCun, Yoshua Bengio, and Geoffrey E. Hinton. Deep learning. Nature, 521(7553):436– 444, 2015. doi: 10.1038/nature14539. URL https://doi.org/10.1038/nature14539
-
[7]
The curse of highly variable func- tions for local kernel machines
Yoshua Bengio, Olivier Delalleau, and Nicolas Le Roux. The curse of highly variable func- tions for local kernel machines. In Advances in Neural Information Processing Systems 18 [Neural Information Processing Systems, NIPS 2005, December 5-8, 2005, Vancouver, British Columbia, Canada], pages 107–114, 2005. URL http://papers.nips.cc/paper/ 2810-the-curse-...
work page 2005
-
[8]
Learning deep architectures for AI
Yoshua Bengio. Learning deep architectures for AI. Foundations and Trends in Machine Learning, 2(1):1–127, 2009. doi: 10.1561/2200000006. URL https://doi.org/10.1561/ 2200000006
Show all 42 references
-
[9]
Montúfar and Jason Morton
Guido F. Montúfar and Jason Morton. When does a mixture of products contain a product of mixtures? SIAM J. Discrete Math., 29(1):321–347, 2015. doi: 10.1137/140957081. URL https://doi.org/10.1137/140957081
2015 doi
-
[10]
Montúfar, Razvan Pascanu, KyungHyun Cho, and Yoshua Bengio
Guido F. Montúfar, Razvan Pascanu, KyungHyun Cho, and Yoshua Bengio. On the number of linear regions of deep neural networks. In Advances in Neural Information Processing Systems 27: Annual Conference on Neural Information Processing Systems 2014, December 8-13 2014, Montreal,...
2014
-
[11]
Multidimensional scaling
Trevor F Cox and Michael AA Cox. Multidimensional scaling. Chapman and hall/CRC, 2000
2000
-
[12]
Visualizing data using t-sne
Laurens van der Maaten and Geoffrey Hinton. Visualizing data using t-sne. Journal of machine learning research, 9(Nov):2579–2605, 2008
2008
-
[13]
A global geometric framework for nonlinear dimensionality reduction
Joshua B Tenenbaum, Vin De Silva, and John C Langford. A global geometric framework for nonlinear dimensionality reduction. science, 290(5500):2319–2323, 2000
2000
-
[14]
Visualizing transitions and structure for high dimensional data exploration
Kevin R Moon, David van Dijk, Zheng Wang, Scott Gigante, Daniel Burkhardt, William Chen, Antonia van den Elzen, Matthew J Hirn, Ronald R Coifman, Natalia B Ivanova, Guy Wolf, and Smita Krishnaswamy. Visualizing transitions and structure for high dimensional data exploration. b...
2017
-
[15]
Diffusion maps
Ronald R Coifman and Stéphane Lafon. Diffusion maps. Applied and computational harmonic analysis, 21(1):5–30, 2006
2006
-
[16]
J. He, L. Zhang, Q. Wang, and Z. Li. Using diffusion geometric coordinates for hyperspectral imagery representation. IEEE Geosci. Remote Sens. Letters, 6(4):767–771, Oct. 2009
2009
-
[17]
Diffusion maps for edge-aware image editing
Zeev Farbman, Raanan Fattal, and Dani Lischinski. Diffusion maps for edge-aware image editing. ACM Trans. Graph., 29(6):145:1–145:10, Dec. 2010
2010
-
[18]
Single-channel transient interference sup- pression with diffusion maps
Ronen Talmon, Israel Cohen, and Sharon Gannot. Single-channel transient interference sup- pression with diffusion maps. IEEE Trans. Audio, Speech Lang. Process., 21(1):130–142, Apr. 2012
2012
-
[19]
Multiscale anomaly detection using diffusion maps
Gal Mishne and Israel Cohen. Multiscale anomaly detection using diffusion maps. IEEE J. Sel. Topics Signal Process., 7:111 – 123, Feb. 2013
2013
-
[20]
Diffusion maps for changing data
Ronald R Coifman and Matthew J Hirn. Diffusion maps for changing data. Applied and computational harmonic analysis, 36(1):79–107, 2014
2014
-
[21]
Gal Mishne, Ronen Talmon, Ron Meir, Jackie Schiller, Maria Lavzin, Uri Dubin, and Ronald R. Coifman. Hierarchical coupled-geometry analysis for neuronal structure and activity pattern discovery. IEEE Journal of Selected Topics in Signal Processing, 10(7):1238–1253, Oct 2016. I...
2016
-
[22]
Understanding the geometry of transport: Diffusion maps for lagrangian trajectory data unravel coherent sets
Ralf Banisch and Péter Koltai. Understanding the geometry of transport: Diffusion maps for lagrangian trajectory data unravel coherent sets. Chaos: An Interdisciplinary Journal of Nonlinear Science, 27(3):035804, 2017. doi: 10.1063/1.4971788. URL https://doi.org/ 10.1063/1.4971788
2017 doi
-
[23]
Multiview diffusion maps
Ofir Lindenbaum, Arie Yeredor, Moshe Salhov, and Amir Averbuch. Multiview diffusion maps. arXiv preprint arXiv:1508.05550, 2015
2015 arXiv
-
[24]
Learning the geometry of common latent variables using alternating-diffusion
Roy R Lederman and Ronen Talmon. Learning the geometry of common latent variables using alternating-diffusion. Applied and Computational Harmonic Analysis, 44(3):509–536, 2018
2018
-
[25]
Time coupled diffusion maps
Nicholas F Marshall and Matthew J Hirn. Time coupled diffusion maps. Applied and Computa- tional Harmonic Analysis, 45(3):709–728, 2018
2018
-
[26]
Community structure in time-dependent, multiscale, and multiplex networks
Peter J Mucha, Thomas Richardson, Kevin Macon, Mason A Porter, and Jukka-Pekka Onnela. Community structure in time-dependent, multiscale, and multiplex networks. Science, 328 (5980):876–878, 2010
2010
-
[27]
Gradient-based learning applied to document recognition
Yann LeCun, Léon Bottou, Yoshua Bengio, Patrick Haffner, et al. Gradient-based learning applied to document recognition. Proceedings of the IEEE, 86(11):2278–2324, 1998
1998
-
[28]
Part, Christopher Kanan, and Stefan Wermter
German Ignacio Parisi, Ronald Kemker, Jose L. Part, Christopher Kanan, and Stefan Wermter. Continual lifelong learning with neural networks: A review. Neural Networks, 113:54–71, 2019. doi: 10.1016/j.neunet.2019.01.012. URL https://doi.org/10.1016/j.neunet.2019.01. 012
2019 doi
-
[29]
Re-evaluating continual learning scenarios: A categorization and case for strong baselines
Yen-Chang Hsu, Yen-Cheng Liu, and Zsolt Kira. Re-evaluating continual learning scenarios: A categorization and case for strong baselines. CoRR, abs/1810.12488, 2018. URL http: //arxiv.org/abs/1810.12488
2018 arXiv
-
[30]
Duchi, Elad Hazan, and Yoram Singer
John C. Duchi, Elad Hazan, and Yoram Singer. Adaptive subgradient methods for online learning and stochastic optimization. Journal of Machine Learning Research, 12:2121–2159,
-
[31]
Kingma and Jimmy Ba
Diederik P. Kingma and Jimmy Ba. Adam: A method for stochastic optimization. In 3rd International Conference on Learning Representations, ICLR 2015, San Diego, CA, USA, May 7-9, 2015, Conference Track Proceedings, 2015. URL http://arxiv.org/abs/1412.6980
2015 arXiv
-
[32]
Understanding deep learning requires rethinking generalization
Chiyuan Zhang, Samy Bengio, Moritz Hardt, Benjamin Recht, and Oriol Vinyals. Understanding deep learning requires rethinking generalization. In 5th International Conference on Learning Representations, ICLR 2017, Toulon, France, April 24-26, 2017, Conference Track Proceedings,
2017
-
[33]
Learning and generalization in overpa- rameterized neural networks, going beyond two layers
Zeyuan Allen-Zhu, Yuanzhi Li, and Yingyu Liang. Learning and generalization in overpa- rameterized neural networks, going beyond two layers. CoRR, abs/1811.04918, 2018. URL http://arxiv.org/abs/1811.04918
2018 arXiv
-
[34]
Jastrzebski, Nicolas Ballas, David Krueger, Emmanuel Bengio, Maxinder S
Devansh Arpit, Stanislaw K. Jastrzebski, Nicolas Ballas, David Krueger, Emmanuel Bengio, Maxinder S. Kanwal, Tegan Maharaj, Asja Fischer, Aaron C. Courville, Yoshua Bengio, and Simon Lacoste-Julien. A closer look at memorization in deep networks. In Proceedings of the 34th Int...
2017
-
[35]
Hinton, Alex Krizhevsky, Ilya Sutskever, and Ruslan Salakhutdi- nov
Nitish Srivastava, Geoffrey E. Hinton, Alex Krizhevsky, Ilya Sutskever, and Ruslan Salakhutdi- nov. Dropout: a simple way to prevent neural networks from overfitting. Journal of Machine Learning Research, 15(1):1929–1958, 2014. URL http://dl.acm.org/citation.cfm? id=2670313
1929
-
[36]
Dropout as a bayesian approximation: Representing model uncertainty in deep learning
Yarin Gal and Zoubin Ghahramani. Dropout as a bayesian approximation: Representing model uncertainty in deep learning. Ininternational conference on machine learning, pages 1050–1059, 2016. 11
2016
-
[37]
Understanding dropout
Pierre Baldi and Peter J Sadowski. Understanding dropout. In Advances in neural information processing systems, pages 2814–2822, 2013
2013
-
[38]
Pedregosa, G
F. Pedregosa, G. Varoquaux, A. Gramfort, V . Michel, B. Thirion, O. Grisel, M. Blondel, P. Prettenhofer, R. Weiss, V . Dubourg, J. Vanderplas, A. Passos, D. Cournapeau, M. Brucher, M. Perrot, and E. Duchesnay. Scikit-learn: Machine learning in Python. Journal of Machine Learni...
2011
-
[39]
François Chollet et al. Keras. https://keras.io, 2015
2015
-
[40]
structural collapse
Martín Abadi, Paul Barham, Jianmin Chen, Zhifeng Chen, Andy Davis, Jeffrey Dean, Matthieu Devin, Sanjay Ghemawat, Geoffrey Irving, Michael Isard, Manjunath Kudlur, Josh Leven- berg, Rajat Monga, Sherry Moore, Derek Gordon Murray, Benoit Steiner, Paul A. Tucker, Vijay Vasudevan...
2016
-
[2011]
URL http://dl.acm.org/citation.cfm?id=2021068
-
[2017]
URL https://openreview.net/forum?id=Sy8gdB9xx
Reviewed August 14, 2026 · model on record in the stance chip above.
Discussion (0). Continue with ORCID to comment.