REVIEW 3 major objections 4 minor 59 references
Analysis of the linear relationship between asymmetry and magnetic moment at the M-edge of 3d transition metals
T0 review · 3 major / 4 minor · reviewed 2026-08-14 · deepseek-v4-flash
Pith's one-line read The paper challenges the standard assumption that measured magnetic asymmetry tracks magnetization linearly, showing that Fe's asymmetry ratio varies with photon energy and pump-probe delay while Ni's stays nearly flat, and that…
desk verdict Useful, honest paper that gives the field a new diagnostic and a caution, but the experimental piece needs to rule out transient reflectivity changes before the Fe result is taken as proof. read the letter →
The pith
A machine-rendered reading of the paper's core claim, the machinery that carries it, and where it could break.
The reading
What carries the argument
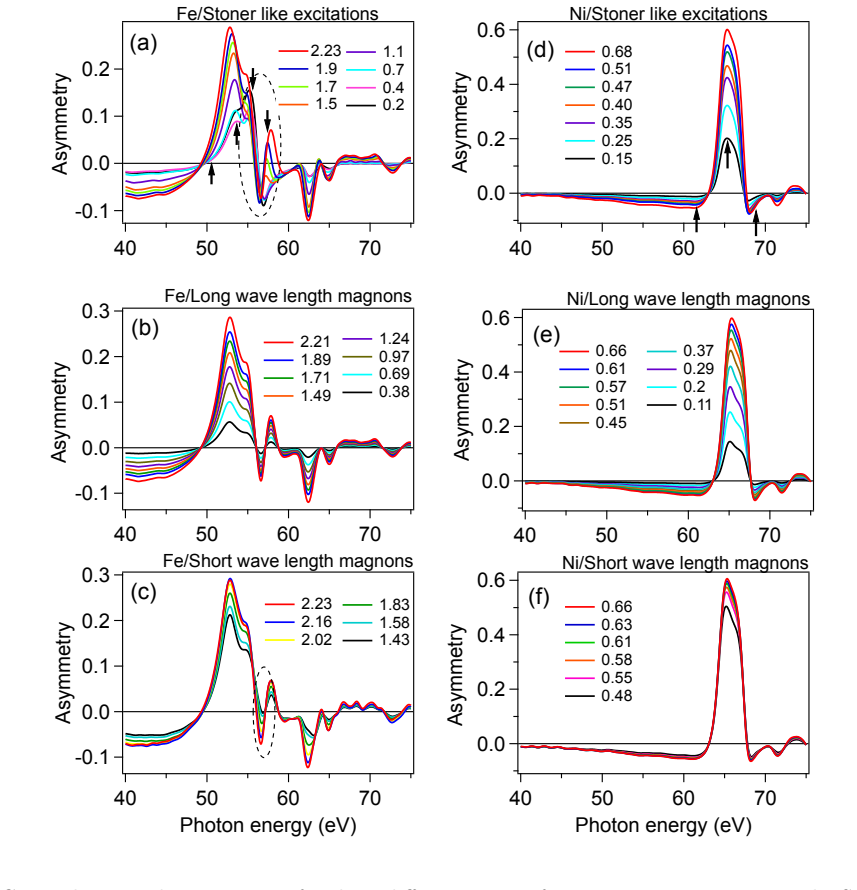
The key diagnostic is the magnetisation-asymmetry test ratio (MAT ratio): the ratio of T-MOKE asymmetries at two photon energies plotted against pump-probe delay, which should be time-independent if asymmetry is proportional to magnetization. The supporting machinery is a quasi-static constrained-moment DFT scheme in which the sample's magnetization is fixed at a reduced value in three distinct ways: collinearly shrunk moments for Stoner-like excitations, uniformly tilted moments averaged over azimuth for long-wavelength magnons, and randomly tilted moments in 16-atom supercells for short-wavelength magnons. The dielectric tensor from each constrained state is put through Fresnel equations with a constant background term to produce theoretical asymmetry spectra, and those spectra are compared with the measured MAT-ratio behaviour to identify which excitation family is active.
What would settle it
In the same pump-probe geometry, record the total reflected intensity at 51, 54, 60 and 63 eV as a function of delay without magnetic analysis, and compare the transient change in the denominator of Eq. 4 with the constant-background assumption. A measurable time-dependent diagonal reflectivity during the first picosecond would mean the Fe MAT-ratio drift could stem from the denominator, not from a nonlinear asymmetry–magnetization relation; a flat diagonal response would strengthen the authors' reading. A second check would be to compare the Fe MAT ratio with an independent magnetization probe, such as time-resolved X-ray magnetic circular dichroism or spin-resolved photoemission, at the same delays.
Extended reading notes
Core claim
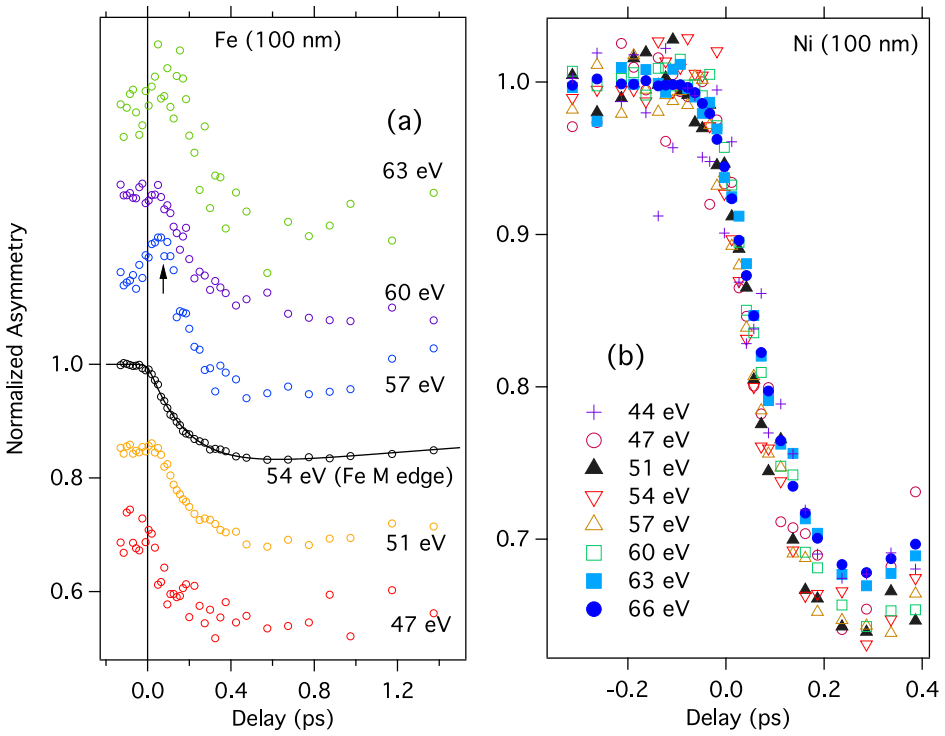
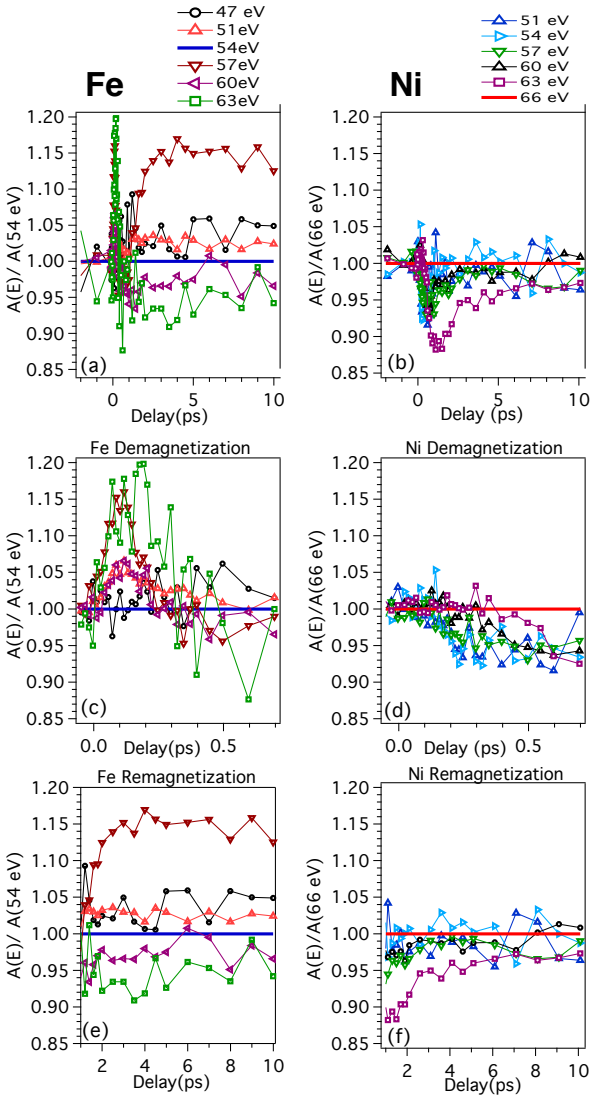
The central claim is that A(E)=K(E)M, the working equation behind most T-MOKE demagnetization studies, fails for Fe but holds approximately for Ni at the M-edge. The evidence is the magnetisation-asymmetry test ratio: if the linear relation held, the ratio A(E)/A(E') would be constant in time. In Fe the measured ratio drifts markedly with delay during the first sub-picosecond, especially near 51, 57, 60 and 63 eV relative to 54 eV, while in Ni the ratios stay nearly flat. Constrained-moment DFT reproduces this difference: Fe's calculated asymmetry depends strongly on whether magnetization is reduced by Stoner-like moment collapse, long-wavelength magnons, or short-wavelength magnons, whereas Ni's asymmetry is similar across all three. The modelling also separates two sources of nonlinearity in Ni, a nearly linear off-diagonal dielectric tensor versus magnetization but a nonlinear asymmetry versus that tensor near the main peak, and shows that Fe's remagnetization is consistent with magnon-dominated response.
Load-bearing premise
The interpretation assumes that non-magnetic transient changes in the refractive index caused by the hot-electron distribution are negligible in the experimental geometry; if those changes are not negligible, the Fe MAT-ratio drift could come from a time-dependent denominator in Eq. 4 instead of from an intrinsically nonlinear asymmetry–magnetization relation.
Editorial extensions
If this is right
- For Fe, single-energy asymmetry curves cannot be read directly as magnetization traces during demagnetization; the time- and energy-dependent MAT ratio shows the out-of-equilibrium state has a more complex magneto-optical response.
- For Fe at delays beyond about 2 ps, the near-constant MAT ratios indicate magnons dominate remagnetization, with only small Stoner-like contributions.
- For Ni, the asymmetry–magnetization relation at the M-edge is close to linear for all modelled excitations, so single-energy Ni traces are more trustworthy; the residual nonlinearity between asymmetry and the off-diagonal dielectric tensor near 65 eV is a Fresnel-level effect, not a band-structure change.
- Any T-MOKE demagnetization study should record at least two probe energies to verify the proportionality before converting asymmetry to magnetization.
Reading between the lines
- If the Fe result holds generally for M-edge probing, previously published single-harmonic demagnetization curves for Fe may have folded energy-dependent optical artefacts into the magnetization dynamics; a multi-energy re-analysis could shift reported demagnetization time constants.
- The clean separation between nonlinearity in the off-diagonal dielectric tensor versus magnetization and nonlinearity in asymmetry versus that tensor suggests an experimental route: measuring a broadband asymmetry spectrum at each delay would allow one to invert the Fresnel expression and extract both diagonal and off-diagonal dielectric response, separating electronic-structure dynamics from geom
- Extending the constrained-moment comparison to Co and to alloys across a range of pump fluences could turn the three excitation families into a phase diagram for which microscopic mechanism controls the asymmetry–magnetization relationship.
Signed reviews
Editorial analysis
A structured set of objections, weighed in public.
Referee Report
Summary. The paper investigates the relationship between the T-MOKE magnetic asymmetry and the magnetization in Fe and Ni across the M-edges between 40 and 72 eV, using pump-probe high-harmonic experiments and DFT-based modeling. The authors introduce the magnetisation-asymmetry test (MAT) ratio, A(E,t)/A(E_ref,t), which should be time-independent if A(E) is proportional to M(t). For Fe they observe strong energy- and time-dependent MAT ratios during demagnetization, whereas for Ni the ratios are nearly constant. DFT calculations with constrained magnetic configurations representing Stoner excitations, long-wavelength magnons, and short-wavelength magnons qualitatively reproduce this difference: Fe shows marked nonlinearity for Stoner and short-wavelength excitations, while Ni shows a more linear response. The paper concludes that a direct linear relationship between asymmetry and magnetization cannot be assumed in general, and that the MAT ratio can help identify the dominant excitation mechanism.
Significance. If the conclusions stand, the MAT ratio provides a parameter-free diagnostic of whether a measured T-MOKE asymmetry is proportional to the instantaneous magnetization, which is directly useful for interpreting ultrafast pump-probe experiments. The DFT modeling systematically compares three classes of magnetic excitations and identifies material-specific differences between Fe and Ni, including a nonlinearity between asymmetry and the off-diagonal dielectric tensor that is not of electronic-structure origin. The paper also gives credit for using constrained-moment DFT with fixed parameters (Γ, energy shift, Gaussian broadening) rather than tuning them per magnetization state. However, the experimental demonstration of the central claim currently rests on a stated but unsupported assumption about the negligibility of transient non-magnetic reflectivity changes.
major comments (3)
- [Introduction, Eq. (3) and Fig. 3] The MAT-ratio test is the key experimental evidence that Fe's asymmetry is nonlinear in the magnetization. This test is valid only if the denominator I+(E)+I−(E) in Eq. (1) (or Eq. (4) with the constant Γ) is time-independent or, at least, changes in an energy-independent way. The paper states in the Introduction that non-magnetic contributions from the transient variation of the refractive index are negligible for the chosen geometry, citing Ref. [30], but no measurement or calculation for Fe and Ni in the 40–72 eV range is presented to support this. Because δ(E) and β(E) vary steeply across the M-edge, a delay-dependent refractive index would produce energy-dependent changes in the denominator; since each harmonic is independently normalized to its t=0 value, such changes would generate exactly the time- and energy-dependent MAT ratios reported for Fe. The authors should either provide an experimental or theoretical demonstration that the diagonal reflectivity is time-independent at these energies, or explicitly soften the conclusion that the measured Fe response is nonlinear during demagnetization.
- [Experimental results, Fig. 3] The MAT-ratio data in Fig. 3 are presented without error bars or any estimate of the noise level. The Fe curves deviate from unity by a few percent, and some energy channels appear to deviate more than others. Without a quantitative uncertainty estimate, the reader cannot assess whether the observed time dependence is statistically significant or whether, for instance, the apparent early onset of the 54 eV curve in Fig. 2(a) is a real effect or a result of harmonic intensity normalization. Since the entire experimental case for nonlinearity rests on these deviations, the manuscript should include error bars or a noise analysis for the MAT ratios.
- [Theory, quasi-static approximation] The theoretical modeling maps the time-dependent demagnetization onto static DFT configurations through the quasi-static approximation of Ref. [31]. While this is a reasonable framework, its validity for the dielectric response at femtosecond timescales is not tested in the present work. In particular, the Stoner-like configuration is modeled as a collinear reduction of all magnetic moments, which is a highly constrained representation of the transient electronic state; the paper does not demonstrate that this captures the relevant transient modification of the band structure. This does not invalidate the model-based counterexample to a general linear relation, but it limits the strength of the conclusions drawn about the experimental data, especially the assignment of the remagnetization phase of Fe to magnons. A discussion of the expected size of corrections to the quasi-static approximation, or a comparison with a time-dependent calculation for at least one case, would strengthen the claim.
minor comments (4)
- [Fig. 1 caption] The caption labels the Ni asymmetry panel as '(b)', which duplicates the Fe panel label; the Ni asymmetry panel should be labeled '(d)'.
- [Experimental results] The sentence 'If the asymmetry were proportional to the magnetization, we would expect the asymmetry to be independent of the photon energy of the probe pulse during the demagnetization and remagnetization process' is imprecise: the asymmetry itself is energy-dependent in general; what is expected to be time-independent is the ratio of asymmetries at two fixed photon energies. The subsequent MAT-ratio discussion correctly implements the intended test, but the wording should be revised.
- [Theory, computational details] The paper states that the dielectric tensor is convoluted with a Gaussian of 1.2 eV, but it does not specify whether the convolution is applied separately to the real and imaginary parts of each tensor component or to the resulting asymmetry; this should be clarified, as it affects the comparison with experiment.
- [Experimental results, Fig. 2] The procedure for normalizing each harmonic curve to its t=0 value is described in words but not shown quantitatively; providing the normalization factor for each harmonic would allow the reader to assess possible systematic offsets in the MAT ratios.
Circularity Check
No circular reduction: Γ and energy shifts are ground-state calibrations held fixed for demagnetized states; MAT-ratio and DFT excitation spectra are forward predictions.
full rationale
The derivation chain is not circular. The theoretical spectra are anchored to the measured ground-state data by two global calibration constants only: the denominator background Γ (0.0052 for Fe, 0.004 for Ni) chosen to match the peak asymmetry, and rigid energy shifts (2.0 eV for Fe, 2.2 eV for Ni) to align the spectra; the paper explicitly states the same Γ values were then used for the partially demagnetized configurations, so the demagnetization curves are forward predictions, not refits. The MAT-ratio test follows directly from Eq. 3 and is applied to actual time-resolved data; Fe's time- and energy-dependent ratios are measured, not imposed. The DFT excitation-type calculations are forward calculations of A(M) from constrained or tilted spin configurations, and the only self-citation (Ref. 31) contributes the quasi-static method and the long-wavelength magnon tensor transformation; this method has stated assumptions and does not contain the Fe/Ni asymmetry results, so it is independent evidence under the rubric, though it is not re-benchmarked here. The experiment does rely on an explicit assumption—that transient non-magnetic refractive-index changes are negligible for the chosen geometry [30]—which is a robustness caveat, not a circularity, since the assumption is external and could be tested by diagonal reflectivity measurements. No prediction reduces to a fitted parameter or to a self-citation by construction, so score 2 reflects the presence of self-citation while the central claim remains independently supported.
Assumptions & free parameters
free parameters (3)
- Background constant Gamma =
0.0052 (Fe), 0.004 (Ni)
- Rigid energy shift of theoretical spectra =
2.0 eV (Fe), 2.2 eV (Ni)
- Gaussian broadening =
1.2 eV
assumptions (4)
- domain assumption PBE exchange-correlation functional adequately describes the ground-state electronic structure and dielectric tensor of Fe and Ni.
- domain assumption Quasi-static approximation: the dielectric tensor of a laser-excited state can be computed from equilibrium DFT with constrained magnetic moments, ignoring transient electronic excitations.
- domain assumption Non-magnetic transient changes of the refractive index are negligible in the chosen experimental geometry.
- standard math The off-diagonal dielectric tensor component is small compared with the Fresnel coefficients, justifying the linearized asymmetry expression Eq. 2.
Cite this review
Pith. "Pith review of Analysis of the linear relationship between asymmetry and magnetic moment at the M-edge of 3d transition metals." pith.science (2026). https://pith.science/paper/N4ZWSVYP
@misc{pith2026190802872,
  author       = {Pith},
  title        = {Pith review of: Analysis of the linear relationship between asymmetry and magnetic moment at the M-edge of 3d transition metals},
  year         = {2026},
  howpublished = {\url{https://pith.science/paper/N4ZWSVYP}},
  note         = {Machine review of arXiv:1908.02872}
}
read the original abstract
The magneto-optical response of Fe and Ni during ultrafast demagnetization is studied experimentally and theoretically. We have performed pump-probe experiments in the transverse magneto-optical Kerr effect (T-MOKE) geometry using photon energies that cover the M-absorption edges of Fe and Ni between 40 to 72 eV. The asymmetry was detected by measuring the reflection of light for two different orientations of the sample magnetization. Density functional theory (DFT) wasused to calculate the magneto-optical response of different magnetic configurations, representing different types of excitations: long-wavelength magnons, short wavelength magnons, and Stoner excitations. In the case of Fe, we find that the calculated asymmetry is strongly dependent on the specific type of magnetic excitation. Our modelling also reveals that during remagnetization Fe is, to a reasonable approximation, described by magnons, even though small non-linear contributions could indicate some degree of Stoner excitations as well. In contrast, we find that the calculated asymmetry in Ni is rather insensitive to the type of magnetic excitations. However, there is a weak non-linearity in the relation between asymmetry and the off-diagonal component of the dielectric tensor, which does not originate from the modifications of the electronic structure. Our experimental and theoretical results thus emphasize the need of considering a coupling between asymmetry and magnetization that may be more complex that a simple linear relationship. This insight is crucial for the microscopic interpretation of ultrafast magnetization experiments.
Figures

Figures from the paper (5 more)



Reference graph
Works this paper leans on
-
[30]
C. La-O-Vorakiat, E. Turgut, C. A. Teale, H. C. Kapteyn, M. M. Murnane, S. Mathias, M. Aeschlimann, C. M. Schneider, J. M. Shaw, H. T. Nembach, and T. J. Silva, Phys. Rev. X 2, 011005 (2012)
work page 2012
-
[31]
I. L. M. Locht, I. Di Marco, S. Garnerone, A. Delin, and M. Battiato, Phys. Rev. B 92, 064403 (2015)
work page 2015
-
[1]
E. Beaurepaire, J.-C. Merle, A. Daunois, and J.-Y. Bigot, Phys. Rev. Lett. 76, 4250 (1996). 20
work page 1996
-
[2]
Koopmans, J
B. Koopmans, J. J. M. Ruigrok, F. Dalla Longa, and W. J. M. de Jonge, Phys. Rev. Lett. 95, 267207 (2005)
2005
- [3]
- [4]
- [5]
-
[6]
B. Koopmans, G. Malinowski, F. Dalla Longa, D. Steiauf, M. Faehnle, T. Roth, M. Cinchetti, and M. Aeschlimann, Nature Mater. 9, 259 (2010)
work page 2010
Show all 59 references
-
[7]
Carva, M
K. Carva, M. Battiato, and P. M. Oppeneer, Phys. Rev. Lett. 107, 207201 (2011)
2011
-
[8]
Rudolf, C
D. Rudolf, C. La-O-Vorakiat, M. Battiato, R. Adam, J. M. Shaw, E. Turgut, P. Maldonado, S. Mathias, P. Grychtol, H. T. Nembach, T. J. Silva, M. Aeschlimann, H. C. Kapteyn, M. M. Murnane, C. M. Schneider, and P. M. Oppeneer, Nature Commun. 3, 1037 (2012)
2012
-
[9]
C. E. Graves, A. H. Reid, T. Wang, B. Wu, S. de Jong, K. Vahaplar, I. Radu, D. P. Bernstein, M. Messerschmidt, L. M¨ uller, R. Coffee, M. Bionta, S. W. Epp, R. Hartmann, N. Kimmel, G. Hauser, A. Hartmann, P. Holl, H. Gorke, J. H. Mentink, A. Tsukamoto, A. Fognini, J. J. Turner,...
2013
-
[10]
Carva, M
K. Carva, M. Battiato, D. Legut, and P. M. Oppeneer, Phys. Rev. B 87, 184425 (2013)
2013
-
[11]
Battiato, P
M. Battiato, P. Maldonado, and P. M. Oppeneer, J. Appl. Phys. 115, 172611 (2014)
2014
-
[12]
A. J. Schellekens, K. C. Kuiper, R. R. J. C. de Wit, and B. Koopmans, Nat Commun 5, 4333 (2014)
2014
-
[13]
Tows and G
W. Tows and G. M. Pastor, Phys. Rev. Lett. 115, 217204 (2015)
2015
-
[14]
Elyasi and H
M. Elyasi and H. Yang, Phys. Rev. B 94, 024417 (2016)
2016
-
[15]
D. M. Nenno, S. Kaltenborn, and H. C. Schneider, Phys. Rev. B 94, 115102 (2016)
2016
-
[16]
C. D. Stanciu, F. Hansteen, A. V. Kimel, A. Kirilyuk, A. Tsukamoto, A. Itoh, and T. Rasing, Phys. Rev. Lett. 99, 047601 (2007)
2007
-
[17]
Kirilyuk, A
A. Kirilyuk, A. V. Kimel, and T. Rasing, Rev. Mod. Phys. 82, 2731 (2010)
2010
-
[18]
Malinowski, F
G. Malinowski, F. Dalla Longa, J. H. H. Rietjens, P. V. Paluskar, R. Huijink, H. J. M. Swagten, and B. Koopmans, Nature Phys. 4, 855 (2008)
2008
-
[19]
Battiato, K
M. Battiato, K. Carva, and P. M. Oppeneer, Phys. Rev. Lett. 105, 027203 (2010). 21
2010
-
[20]
Melnikov, I
A. Melnikov, I. Razdolski, T. O. Wehling, E. T. Papaioannou, V. Roddatis, P. Fumagalli, O. Aktsipetrov, A. I. Lichtenstein, and U. Bovensiepen, Phys. Rev. Lett. 107, 076601 (2011)
2011
-
[21]
Eschenlohr*, M
A. Eschenlohr*, M. Battiato*, P. Maldonado, N. Pontius, T. Kachel, K. Holldack, R. Mitzner, A. F¨ ohlisch, P. M. Oppeneer, and C. Stamm, Nature Mater. 12, 332 (2013)
2013
-
[22]
Battiato and K
M. Battiato and K. Held, Phys. Rev. Lett. 116, 196601 (2016)
2016
-
[23]
J. L. Erskine and E. A. Stern, Phys. Rev. B 12, 5016 (1975)
1975
-
[24]
Koopmans, M
B. Koopmans, M. van Kampen, J. T. Kohlhepp, and W. J. M. de Jonge, Phys. Rev. Lett. 85, 844 (2000)
2000
-
[25]
Guidoni, E
L. Guidoni, E. Beaurepaire, and J.-Y. Bigot, Phys. Rev. Lett. 89, 017401 (2002)
2002
-
[26]
Bigot, L
J.-Y. Bigot, L. Guidoni, E. Beaurepaire, and P. N. Saeta, Phys. Rev. Lett. 93, 077401 (2004)
2004
-
[27]
Carpene, E
E. Carpene, E. Mancini, C. Dallera, M. Brenna, E. Puppin, and S. De Silvestri, Phys. Rev. B 78, 174422 (2008)
2008
-
[28]
G. P. Zhang, W. H¨ ubner, G. Lefkidis, Y. Bai, and T. F. George, Nature Phys. 5, 499 (2009)
2009
-
[29]
Carpene, H
E. Carpene, H. Hedayat, F. Boschini, and C. Dallera, Phys. Rev. B 91, 174414 (2015)
2015
-
[32]
Mathias, C
S. Mathias, C. La-O-Vorakiat, P. Grychtol, P. Granitzka, E. Turgut, J. M. Shaw, R. Adam, H. T. Nembach, M. E. Siemens, S. Eich, C. M. Schneider, T. J. Silva, M. Aeschlimann, M. M. Murnane, and H. C. Kapteyn, Proceedings of the National Academy of Sciences 109, 4792 (2012), htt...
2012
-
[33]
Mathias, C
S. Mathias, C. La-O-Vorakiat, J. M. Shaw, E. Turgut, P. Grychtol, R. Adam, D. Rudolf, H. T. Nembach, T. J. Silva, M. Aeschlimann, C. M. Schneider, H. C. Kapteyn, and M. M. Murnane, Journal of Electron Spectroscopy and Related Phenomena 189, 164 (2013)
2013
-
[34]
K. H. J. Buschow, Handbook of magnetic materials. Vol. 13 (Elsevier, Amsterdam, 2001)
2001
-
[35]
Turgut, D
E. Turgut, D. Zusin, D. Legut, K. Carva, R. Knut, J. M. Shaw, C. Chen, Z. Tao, H. T. Nembach, T. J. Silva, et al. , Physical Review B 94, 220408 (2016)
2016
-
[36]
Zusin, P
D. Zusin, P. M. Tengdin, M. Gopalakrishnan, C. Gentry, A. Blonsky, M. Gerrity, D. Legut, J. M. Shaw, H. T. Nembach, T. J. Silva, P. M. Oppeneer, H. C. Kapteyn, and M. M. Murnane, 22 Physical Review B 97, 24433 (2018)
2018
-
[37]
S. Eich, M. Pl¨ otzing, M. Rollinger, S. Emmerich, R. Adam, C. Chen, H. C. Kapteyn, M. M. Murnane, L. Plucinski, D. Steil, B. Stadtm¨ uller, M. Cinchetti, M. Aeschlimann, C. M. Schnei- der, and S. Mathias, Science Advances 3 (2017), 10.1126/sciadv.1602094
2017 doi
-
[38]
Chimata, E
R. Chimata, E. K. Delczeg-Czirjak, A. Szilva, R. Cardias, Y. O. Kvashnin, M. Pereiro, S. Mankovsky, H. Ebert, D. Thonig, B. Sanyal, A. B. Klautau, and O. Eriksson, Phys. Rev. B 95, 214417 (2017)
2017
-
[39]
Eriksson, A
O. Eriksson, A. Bergman, L. Bergqvist, and J. Hellsvik, Atomistic Spin Dynamics: Founda- tions and Applications , 1st ed. (Oxford university press, 2017)
2017
-
[40]
Chimata, A
R. Chimata, A. Bergman, L. Bergqvist, B. Sanyal, and O. Eriksson, Phys. Rev. Lett. 109, 157201 (2012)
2012
-
[41]
Runge and E
E. Runge and E. K. U. Gross, Phys. Rev. Lett. 52, 997 (1984)
1984
-
[42]
Krieger, J
K. Krieger, J. K. Dewhurst, P. Elliott, S. Sharma, and E. K. U. Gross, J. Chem. Theory Comput. 11, 4870 (2015)
2015
-
[43]
Shokeen, M
V. Shokeen, M. Sanchez Piaia, J.-Y. Bigot, T. M¨ uller, P. Elliott, J. K. Dewhurst, S. Sharma, and E. K. U. Gross, Phys. Rev. Lett. 119, 107203 (2017)
2017
-
[44]
Krieger, P
K. Krieger, P. Elliott, T. Mller, N. Singh, J. K. Dewhurst, E. K. U. Gross, and S. Sharma, Journal of Physics: Condensed Matter 29, 224001 (2017)
2017
-
[45]
Plogmaker, J
S. Plogmaker, J. A. Terschl¨ usen, N. Krebs, M. Svanqvist, J. Forsberg, U. B. Cappel, J.-E. Rubensson, H. Siegbahn, and J. S¨ oderstr¨ om, Review of Scientific Instruments 86, 123107 (2015)
2015
-
[46]
Stefanuik, R
R. Stefanuik, R. Knut, S. Jana, J. Terschl¨ usen, A. Sandell, and J. S¨ oderstr¨ om, Journal of Electron Spectroscopy and Related Phenomena 224, 33 (2018)
2018
-
[47]
S. Jana, J. A. Terschl¨ usen, R. Stefanuik, S. Plogmaker, S. Troisi, R. S. Malik, M. Svanqvist, R. Knut, J. S¨ oderstr¨ om, and O. Karis, Review of Scientific Instruments88, 033113 (2017), http://dx.doi.org/10.1063/1.4978907
2017 doi
-
[48]
X. He, J. M. Dahlstr¨ om, R. Rakowski, C. M. Heyl, A. Persson, J. Mauritsson, and A. L’Huillier, Phys. Rev. A 82, 033410 (2010)
2010
-
[49]
Holloway and J
P. Holloway and J. Hudson, Surface Science 43, 123 (1974)
1974
-
[50]
Tyuliev and K
G. Tyuliev and K. Kostov, Physical Review B 60, 2900 (1999). 23
1999
-
[51]
Valencia, A
S. Valencia, A. Kleibert, A. Gaupp, J. Rusz, D. Legut, J. Bansmann, W. Gudat, and P. M. Oppeneer, Phys. Rev. Lett. 104, 187401 (2010)
2010
-
[52]
Yeh, Surface Science 96, 41 (1980)
P. Yeh, Surface Science 96, 41 (1980)
1980
-
[53]
http://elk.sourceforge.net/
-
[54]
J. P. Perdew, K. Burke, and M. Ernzerhof, Phys. Rev. Lett. 77, 3865 (1996)
1996
-
[55]
Willems, S
F. Willems, S. Sharma, C. v. Korff Schmising, J. K. Dewhurst, L. Salemi, D. Schick, P. Hessing, C. Str¨ uber, W. D. Engel, and S. Eisebitt, Phys. Rev. Lett. 122, 217202 (2019)
2019
-
[56]
H.-S. Rhie, H. A. D¨ urr, and W. Eberhardt, Phys. Rev. Lett. 90, 247201 (2003)
2003
-
[57]
B. Y. Mueller, A. Baral, S. Vollmar, M. Cinchetti, M. Aeschlimann, H. C. Schneider, and B. Rethfeld, Phys. Rev. Lett. 111, 167204 (2013)
2013
-
[58]
J. L. Erskine and E. A. Stern, Physical Review B 12, 5016 (1975)
1975
-
[59]
F. Pan, J. Chico, A. Delin, A. Bergman, and L. Bergqvist, Phys. Rev. B 95, 184432 (2017). 24
2017
Reviewed August 14, 2026 · model on record in the stance chip above.
Discussion (0). Continue with ORCID to comment.