REVIEW 4 major objections 8 minor 26 references
Stochastic and Simulation-based Models for Setting Flow Rates in Collaborative Trajectory Options Program (CTOP)
T0 review · 4 major / 8 minor · reviewed 2026-08-14 · deepseek-v4-flash
Pith's one-line read The paper shows that FCA-PCA stochastic models, which approximate all traffic as a single flow through precomputed split ratios, cannot yield theoretically optimal CTOP acceptance rates; correct planning requires one FCA per route path…
desk verdict The structural critique of FCA-PCA flow-split models is solid and worth publishing, but the simulation-based improvement numbers are not yet credible because the lightweight CTOP algorithm is unvalidated, and the manuscript carries an accidental confidential insert. read the letter →
The pith
A machine-rendered reading of the paper's core claim, the machinery that carries it, and where it could break.
The reading
What carries the argument
The load-bearing object is the FCA-PCA network together with the flow split ratios $f^{r,r'}_t$, the fraction of flights leaving resource $r$ toward resource $r'$ at time $t$. ESOM uses these pre-calculated ratios to turn a multi-commodity flow into a single-commodity approximation; the paper shows this is the root of non-optimality. The constructive alternative is the path, the sequence of PCA nodes a flight traverses, used as a commodity in PCA models, with one FCA placed per path. For the simulation phase, the machinery is the lightweight CTOP algorithm (evenly spaced slot creation, TOS allocation in initial-arrival-time order, then a linear program for air delay under PCA capacity scenarios) plus pattern search as derivative-free local search over integer bounded FCA rates.
What would settle it
Run the two-phase pattern-search procedure on the same Washington Center/Newark network with a high-fidelity operational CTOP simulator or post-implementation data: if the improved rates near 324 do not beat the starting heuristic in actual slot-allocation cost, the simulation-based claim fails. A sharper test for the theoretical claim: construct a two-path network with fixed split ratios as in Table 2, and check whether any single-FCA rate vector obtained from ESOM or by summing per-path optimal rates ever matches the per-path optimum in expected cost across all scenarios; if it does, Section 4.3 is wrong.
Extended reading notes
Core claim
The central discovery is both negative and constructive. Negative: in any FCA-PCA model like ESOM that connects PCA capacity constraints to FCA rates through precomputed flow split ratios $f^{r,r'}_t$, the resulting planned acceptance rates are in general not theoretically optimal; delaying flights shifts them across split-ratio classes, so actual routes and destinations can change, integrality is lost, and boundary conditions cannot be enforced strictly. Constructive: the deficiency disappears in PCA models that explicitly track path commodities; each path needs its own FCA, and a single FCA placed across multiple paths is in general not optimal even if its rate is taken as the sum of per-path optimal rates. On the rerouting side, stochastic programming alone cannot be optimal because demand shifts and conservative zero-demand rates block good slot usage, so the paper proposes a two-phase approach: saturation heuristics for starting rates, then pattern search over FCA rates with the CTOP slot-allocation algorithm simulated. On the realistic use case the second phase lowers expected system cost from 346.06 to 324.36 and from 331.19 to 324.39 in about 3.7 minutes.
Load-bearing premise
The practical numerical results depend on the lightweight CTOP algorithm in Appendix 9.1 reproducing the real slot-allocation behavior; if the simulator diverges from operations, the pattern-search rates are optimal only for the simulator.
Editorial extensions
If this is right
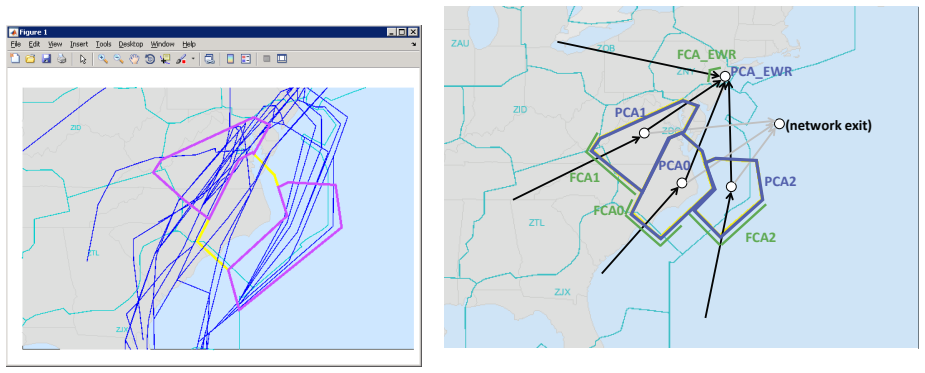
- Any CTOP implementation that uses a single FCA at a location serving multiple route paths should expect its rates to be suboptimal; correct implementation requires one FCA per path, such as FCA11 and FCA12 in place of a single FCA1.
- FCA-PCA stochastic models can still serve as fast approximations, but their objectives and acceptance rates should not be used as optimal benchmarks; PCA models with per-path rates are the proper benchmark for the rate-planning step.
- A two-phase procedure—saturation heuristic for starting rates, then pattern search over a subset of FCAs with CTOP slot allocation simulated—can report improved CDM-compatible rates within about five minutes.
- The gap between the simulation-optimized cost near 324 and the centralized rerouting benchmark of 167.07 quantifies the price of the CDM slot-allocation fairness rules.
- Demand shift and conservative FCA rates are coupled: fixing one leaves the other, so stochastic programming alone cannot handle the rerouting step without heuristics or simulation.
Reading between the lines
- Beyond the paper: the per-path FCA principle likely extends to other traffic management initiatives that control multiple constrained resources; aggregate control points defined by physical location are probably suboptimal whenever flows split by destination.
- Beyond the paper: the saturation technique is a general way to derive approximate upper bounds on acceptance rates from capacity information alone, and could be tested on airport arrival or departure rate problems with multiple runway configurations.
- Beyond the paper: pattern search's 3.7-minute convergence on five FCAs suggests that derivative-free global methods with a similar budget, such as Bayesian optimization, are worth testing on the same simulator for larger FCA counts.
Signed reviews
Editorial analysis
A structured set of objections, weighed in public.
Referee Report
Summary. This paper addresses the problem of setting traffic flow rates for the Collaborative Trajectory Options Program (CTOP) under capacity uncertainty. It reviews and classifies existing stochastic programming models for CTOP (Table 1), argues that the class of FCA-PCA models (e.g., the Enhanced Stochastic Optimization Model, ESOM) is inherently flawed because it approximates a multi-commodity flow by a single-commodity flow with pre-calculated split ratios (Section 4.1), and recommends defining one FCA per commodity/path (Section 4.3). The paper then proposes a two-phase framework that combines stochastic-programming-based heuristics (saturation techniques) with simulation-based pattern search, and tests it on a realistic southern ZDC/EWR use case, reporting that pattern search reduces expected cost from 331.19 to 324.39 and from 346.06 to 324.36 (Section 6.3).
Significance. The analytical critique of FCA-PCA models is the strongest part of the paper: the counterexample in Section 4.1 (Table 2) clearly shows how delayed flights can be implicitly rerouted to a different destination by the split-ratio approximation, and the resulting recommendation to define FCAs per path is concrete and actionable. The review and classification in Table 1 is a useful organizing device for the CTOP literature. The simulation-based optimization framework is a plausible approach to the demand-shift problem, but its quantitative claims rest on an unvalidated simulator; if simulator fidelity is established, the framework would be a practical contribution. The paper does not provide machine-checked proofs or code, but the model formulations and the use case are described in sufficient detail to be reproduced in principle.
major comments (4)
- [Appendix 9.1; Section 6.3] The quantitative results reported in Section 6.3 (pattern search reducing expected cost to 324.36/324.39, and the final rates in Table 8) are computed with the paper's own 'lightweight CTOP algorithm' described in Appendix 9.1, but this algorithm is never validated against the operational CTOP/TFMS slot allocation procedure. Equation (22) creates evenly spaced slots by rounding, Algorithm 1 assigns slots by IAT order and lowest adjusted cost trajectory without compression, cancellations, or pop-up flights, and Section 9.1.5 appends a scenario-aware linear program for air delay. If the proxy's slot boundaries or assignment order differ from the actual system (cf. reference [16]), the claimed 2.1% and 6.3% improvements are properties of the proxy, not of CTOP. The manuscript should provide a fidelity check against actual CTOP outputs or a certified TFMS simulator, or substantially weaken the claims in Sections 6.3 and 7.
- [Section 6.2, Tables 4–7] The comparison set in Tables 4–7 consists exclusively of the authors' own previously published models (references [5], [21], [23]). No independent benchmark—such as rates produced by current traffic management practice or by an external implementation—is included. The reported improvements over 'existing models' are therefore improvements over the authors' own formulations, and the paper's claim that the framework is 'very encouraging' (abstract) is not yet supported against an independent state of the art. Please add at least one independent baseline or revise the conclusions to refer only to the specific models compared.
- [Section 4.3] The central design claim—that placing only one FCA at a location is 'in general NOT optimal' even if its rates are obtained by adding the rates of per-path FCAs—is asserted without a formal proof. The discussion in Section 4.1 demonstrates that the ESOM approximation can misroute flows, but it does not establish that no single-FCA rate vector can be optimal for the underlying multi-commodity problem. A rigorous counterexample or proof is needed to support the recommendation that FCAs should be defined per commodity.
- [Section 6] All numerical evidence in the paper comes from a single hand-constructed use case (southern ZDC/EWR with three scenarios and one capacity profile). The conclusions in Section 7 that the proposed framework is 'efficient and effective' are therefore supported by only one instance. Adding a second use case with a different network topology or capacity profile, or explicitly limiting the conclusions to the demonstrated case, would make the claims more proportionate.
minor comments (8)
- [Section 7] The final sentence of the conclusion is incomplete ('...but also can be .'); it should be completed or removed.
- [Abstract] The phrase 'show that how this deficiency' should read 'show how this deficiency'.
- [Section 6.3] There are two typos in the text: 'slightly worst' should be 'slightly worse', and 'the capacity in scenario 1 is strictly better than scenario 2, which is in turn better than scenario 1' should presumably end with 'scenario 3'.
- [Section 6.3] The sentence 'The solution is shown in Figure 8' should refer to Table 8, which contains the final FCA rates; Figure 8 shows demand and capacity at PCA2.
- [Figure 10] Figure 10's caption ('Linear Interpolation of Capacity Scenarios') and the text block near it ('ctop_grnd_cost', 'ctop_reroute_cost', 'sim_air_cost') do not match; the figure appears to be a screen capture with garbled labels. The figure should be redrawn and its caption clarified.
- [Nomenclature] The symbol P is used for both the set of PCAs and the set of paths, causing ambiguity in equations such as those in Section 9.1.5 where ρ ∈ P; please use a distinct symbol for one of the sets.
- [References / Algorithm 1] Algorithm 1 is cited as from reference [6] (Kim and Clarke), but the algorithm appears to be based on the TFMS TMI functional description [16]; please verify the sourcing.
- [ESOM equations] In the ESOM objective (1), the probability multiplier appears in the air-delay term as 'capq'; this symbol is not defined in the nomenclature (the scenario probability is p_q). Please clarify.
Circularity Check
No circularity: the analytical critique is derived from the paper's own equations and the simulation-based results are transparent optimization outcomes, not fitted predictions.
full rationale
The derivation chain is self-contained. The FCA-PCA critique follows directly from the ESOM formulation quoted in Eqs. (1)-(10): pre-calculated split ratios f_{r,r'}^t are fixed parameters, so the model cannot track individual route schedules, enforce integrality, or meet strict boundary conditions, as shown by the Table 2 example. Section 4.3's claim that a single FCA at one location is in general not optimal follows from the path-specific definition of FCA rates (e.g., FCA11's rate equals P^{PCA1}_{t-2,rho=1}) and the fact that one aggregate acceptance-rate scalar cannot encode path-specific slot allocation; it is not reduced to a fitted value. The simulation-based optimization is equally transparent: pattern search minimizes the cost computed by the lightweight CTOP algorithm (Eq. (22), Algorithm 1, Section 9.1.5), and the reported 324.36/324.39 improvements are the optimizer's objective values for that stated simulator, not independent predictions of real-world cost. The cited works [5], [21], [22], and [23] are self-authored, but they are used as previously published formulations, re-solved benchmarks, and a separate mathematical counterexample; the paper's main arguments do not reduce to those citations. The unvalidated fidelity of the lightweight CTOP simulator relative to actual CTOP/TFMS allocation is a genuine correctness and external-validity risk, but it is not a circularity under the given criteria.
Assumptions & free parameters
free parameters (6)
- Scenario probabilities p_q =
0.4, 0.3, 0.3 (Figure 2)
- Capacity scenario profiles M_t,q =
Table 3 values
- Planning horizon extension =
8 extra time periods
- Saturation default demand value =
1 (flights)
- Pattern search step size and variable range adjustments =
not specified
- Ground and air delay cost coefficients (cg, ca) =
unstated (appears normalized to 1)
assumptions (6)
- domain assumption Scenario-based stochastic programming with finitely many scenarios accurately captures weather uncertainty
- domain assumption The CTOP slot allocation algorithm in Algorithm 1 matches the real CTOP software
- domain assumption Flights are grouped by path (commodity) and aggregate counts can replace individual flights
- domain assumption The FCA-PCA network topology in Figure 4 is representative of real traffic management designs
- ad hoc to paper Saturation with artificially high demand yields useful upper bounds on FCA rates
- ad hoc to paper One FCA per commodity is required for optimal rates
Cite this review
Pith. "Pith review of Stochastic and Simulation-based Models for Setting Flow Rates in Collaborative Trajectory Options Program (CTOP)." pith.science (2026). https://pith.science/paper/CIKXSWPS
@misc{pith2026190802917,
  author       = {Pith},
  title        = {Pith review of: Stochastic and Simulation-based Models for Setting Flow Rates in Collaborative Trajectory Options Program (CTOP)},
  year         = {2026},
  howpublished = {\url{https://pith.science/paper/CIKXSWPS}},
  note         = {Machine review of arXiv:1908.02917}
}
read the original abstract
As a new tool in the NextGen portfolio, the Collaborative Trajectory Options Programs (CTOP) combines multiple features from its forerunners including Ground Delay Program (GDP), Airspace Flow Program (AFP) and reroutes, and can manage multiple Flow Constrained Areas (FCAs) with a single program. A key research question in CTOP is how to set traffic flow rates under traffic demand and airspace capacity uncertainties. In this paper, we first investigate existing CTOP related stochastic optimization models and point out their roles in CTOP flow rate planning, and their advantages and disadvantages in terms of model flexibility, performance, practicality and Collaborative Decision Making (CDM) software compatibility, etc. CTOP FCA rate planning problem has been split into two steps: traffic flow rate optimization given demand estimation, and flow rate adaptation when flight rerouting is considered. Second, we discuss in detail a class of models called FCA-PCA (Potentially Constrained Area) models, which are extended from GDP models to solve the first step of the problem, and were considered promising as they are designed to be consistent with current CTOP software implementation. We will reveal one inherent shortcoming suffered by FCA-PCA models and show that how this deficiency can be addressed by the PCA model family. We will talk about the problems that prevent stochastic programming being optimal in the second step of the problem. Third, we discuss the applicability of simulation-based optimization, combine it with stochastic programming based heuristics and test the resulting new model on a realistic use case. The results are very encouraging. The models and discussions in this work are not only useful in more effectively implementing and analyzing CTOP programs, but are also valuable for the design of future air traffic flow program.
Figures


Figures from the paper (2 more)


Reference graph
Works this paper leans on
-
[16]
TFMS Functional Description, Appendix C: Traffic Management Initiative (TMI) Algorithms
CSC, 2014. TFMS Functional Description, Appendix C: Traffic Management Initiative (TMI) Algorithms. Technical Report
work page 2014
-
[5]
Hoffman, R., Hackney, B., Zhu, G., Wei, P., 2018. Enhanced Stochastic Optimization Model (ESOM) for setting flow rates in a Collaborative Trajectory Options Program (CTOP), AIAA Aviation, Atlanta, GA
work page 2018
-
[21]
Zhu, G., Wei, P., Hoffman, R., Hackney, B., 2018a. Centralized disaggregate stochas- tic allocation models for Collaborative Trajectory Options Program (CTOP) 37th AIAA/IEEE Digital Avionics Systems Conference (DASC), London
-
[23]
Zhu, G., Wei, P., Hoffman, R., Hackney, B., 2018c. Aggregate multi-commodity stochastic models for Collaborative Trajectory Options Program (CTOP), Interna- tional Conference on Research in Air Transportation (ICRAT), Barcelona, Spain
-
[1]
Ball, M.O., Hoffman, R., Odoni, A.R., Rifkin, R., 2003. A stochastic integer pro- gram with dual network structure and its application to the ground-holding problem. Operations Research 51, 167–171
work page 2003
-
[2]
Practical optimization: a gentle introduction
Chinneck, J.W., 2006. Practical optimization: a gentle introduction. Carleton Uni- versity, Ottawa. http://www.sce.carleton.ca/faculty/chinneck/po.html
work page 2006
-
[3]
Determining stochastic airspace capacity for air traffic flow management
Clarke, J.P.B., Solak, S., Ren, L., Vela, A.E., 2012. Determining stochastic airspace capacity for air traffic flow management. Transportation Science 47, 542–559
work page 2012
-
[4]
Cook, L.S., Wood, B., 2010. A model for determining ground delay program param- eters using a probabilistic forecast of stratus clearing. Air Traffic Control Quarterly 18, 85–108
work page 2010
Show all 26 references
-
[6]
Optimal airline actions during Collaborative Trajectory Options Programs, AGIFORS 54th Annual Symposium, Dubai, UAE
Kim, B., Clarke, J.P., 2014. Optimal airline actions during Collaborative Trajectory Options Programs, AGIFORS 54th Annual Symposium, Dubai, UAE
2014
-
[7]
Equitable models for the stochastic ground-holding problem under collaborative decision making
Kotnyek, B., Richetta, O., 2006. Equitable models for the stochastic ground-holding problem under collaborative decision making. Transportation Science 40, 133–146
2006
-
[8]
Simulation-Driven Modeling and Optimiza- tion
Koziel, S., Leifsson, L., Yang, X.S., 2016. Simulation-Driven Modeling and Optimiza- tion. Springer
2016
-
[9]
Scenario-based air traffic flow manage- ment: From theory to practice
Liu, P.c.B., Hansen, M., Mukherjee, A., 2008. Scenario-based air traffic flow manage- ment: From theory to practice. Transportation Research Part B: Methodological 42, 685–702
2008
-
[10]
Airspace Flow Rate Forecast Algorithms, Validation, and Implementation
Matthews, M., DeLaura, R., Veillette, M., Venuti, J., Kuchar, J., 2015. Airspace Flow Rate Forecast Algorithms, Validation, and Implementation. Project Report ATC-428. MIT Lincoln Laboratory. Lexington, MA. xxvi
2015
-
[11]
A dynamic stochastic model for the single airport ground holding problem
Mukherjee, A., Hansen, M., 2007. A dynamic stochastic model for the single airport ground holding problem. Transportation Science 41, 444–456
2007
-
[12]
Solving optimally the static ground-holding policy problem in air traffic control
Richetta, O., Odoni, A.R., 1993. Solving optimally the static ground-holding policy problem in air traffic control. Transportation Science 27, 228–238
1993
-
[13]
Dynamic solution to the ground-holding problem in air traffic control
Richetta, O., Odoni, A.R., 1994. Dynamic solution to the ground-holding problem in air traffic control. Transportation Research Part A: Policy and Practice 28, 167–185
1994
-
[14]
Steiner, M., Bateman, R., Megenhardt, D., Liu, Y., Xu, M., Pocernich, M., Krozel, J.,
-
[15]
Designing traffic flow management strategies using multiobjective genetic algorithms
Taylor, C., Masek, T., Wanke, C., 2015. Designing traffic flow management strategies using multiobjective genetic algorithms. Journal of Guidance, Control, and Dynamics 38, 1922–1934
2015
-
[17]
Introduction to Collaborative Trajectory Options Program (CTOP)
Federal Aviation Administration, 2018. Introduction to Collaborative Trajectory Options Program (CTOP). https://cdm.fly.faa.gov/?page_id=983. Accessed: 2018-11-19
2018
-
[18]
CTOP Rate Selection Techniques Extended, Interim Results
Metron Aviation, 2018. CTOP Rate Selection Techniques Extended, Interim Results. Technical Report
2018
-
[19]
Air traffic flow management
Vossen, T.W., Hoffman, R., Mukherjee, A., 2012. Air traffic flow management. Springer. pp. 385–453
2012
-
[20]
Total unimodularity and decomposition method for large-scale air traffic cell transmission model
Wei, P., Cao, Y., Sun, D., 2013. Total unimodularity and decomposition method for large-scale air traffic cell transmission model. Transportation Research Part B: Methodological 53, 1–16. xxvii
2013
-
[22]
Saturation technique for opti- mizing planned acceptance rates in Traffic Management Initiatives, The 21st IEEE International Conference on Intelligent Transportation Systems, Hawaii
Zhu, G., Wei, P., Hoffman, R., Hackney, B., 2018b. Saturation technique for opti- mizing planned acceptance rates in Traffic Management Initiatives, The 21st IEEE International Conference on Intelligent Transportation Systems, Hawaii
-
[25]
Lightweight CTOP Algorithm 9.1.1
Appendix 9.1. Lightweight CTOP Algorithm 9.1.1. Assumptions • There is only one activate TMI, which is the CTOP being implemented. TMI inter- action is not considered • Pop-up flights or cancelled flights are not considered 9.1.2. Algorithm Input • For each FCA r, its activation...
-
[26]
Appendix for Acronyms and Abbreviations TMI Traffic Management Initiative GDP Ground Delay Program AFP Airspace Flow Program FCA Flow Constrained Area PCA Potential Constrained Area CDM Collaborative Decision Making CTOP Collaborative Trajectory Options Program TOS Trajectory Op...
-
[2010]
Air Traffic Control Quarterly 18, 229–254
Translation of ensemble weather forecasts into probabilistic air traffic capacity impact. Air Traffic Control Quarterly 18, 229–254
Reviewed August 14, 2026 · model on record in the stance chip above.
Discussion (0). Continue with ORCID to comment.