REVIEW 2 major objections 5 minor 13 references
Study of the ferromagnetic quantum phase transition in Ce$_{3-x}$Mg$_x$Co$_{9}$
T0 review · 2 major / 5 minor · reviewed 2026-08-14 · deepseek-v4-flash
Pith's one-line read Single-crystal magnetization places the paramagnet-to-ferromagnet quantum phase transition in Ce3−xMgxCo9 near x ≈ 0.35, roughly half the magnesium content earlier polycrystalline work suggested.
desk verdict Useful single-crystal correction to the Ce3-xMgxCo9 phase diagram, but the 'quantum phase transition' label outruns data that stop at 2 K. read the letter →
The pith
A machine-rendered reading of the paper's core claim, the machinery that carries it, and where it could break.
The reading
What carries the argument
The load-bearing object is the Arrott plot, a standard mean-field construction in which magnetization $M$ versus internal field $H_{\rm int}$ is redrawn as $M^2$ versus $H_{\rm int}/M$; a ferromagnetic transition is identified where the curves become straight lines passing through the origin. The authors apply this test to easy-axis data ($H$ parallel to the $c$ axis), correcting the applied field by the demagnetization factor $N$ so that $H_{\rm int}=H_{\rm applied}-NM$. This criterion, rather than the upturn in $M(T)$, is what separates the non-ferromagnetic $x=0.35$ crystal from the ferromagnetic $x=0.43$ and $x=0.50$ crystals, and it is the procedure that converts the measurements into the $T_C$-$x$ phase diagram. Single-crystal flux growth provides the phase-pure samples on which the comparison rests.
What would settle it
Cool the $x=0.35$ crystal below 2 K, for example to 0.1 K, and measure ac susceptibility, magnetization, and specific heat in zero field. If long-range ferromagnetic order appears at any finite temperature, then $x=0.35$ is not the quantum critical concentration and the critical window must lie at higher $x$; if the sample stays paramagnetic to the lowest temperature, the paper's placement of the boundary is supported.
Extended reading notes
Core claim
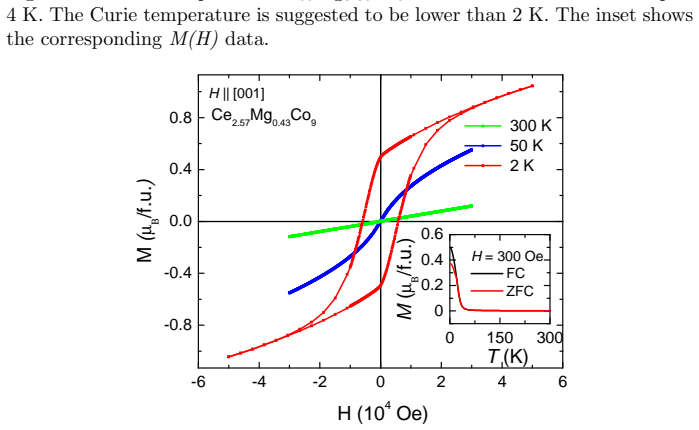
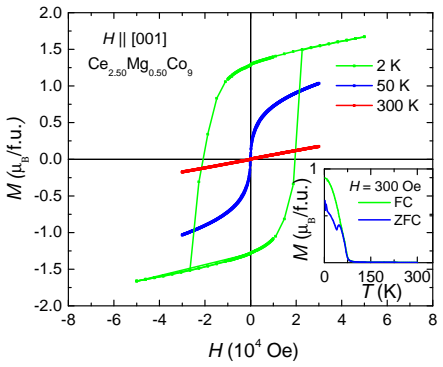
The central claim, stated in the conclusions, is that the paramagnet-to-ferromagnet quantum phase transition in $\mathrm{Ce}_{3-x}\mathrm{Mg}_x\mathrm{Co}_9$ occurs in the narrow doping window $0.35\le x\le0.40$. Crystals with $x=0.01$, $0.16$, and $0.24$ have temperature-independent magnetization down to 2 K, the signature of Pauli paramagnetism; the $x=0.35$ crystal still lacks straight mean-field magnetization lines through the origin that would mark a ferromagnetic transition above 2 K; and $x=0.43$ and $x=0.50$ order ferromagnetically with Curie temperatures near 25 K and 70 K, showing hysteresis, bifurcation of zero-field-cooled and field-cooled magnetization, and a roughly linear growth of $T_C$ with $x$. Because neither resistance nor specific heat shows a clear anomaly at the ordering temperatures, the paper characterizes the ferromagnet as fragile and itinerant with a small spontaneous moment, consistent with the small $M_S$ measured at 2 K.
Load-bearing premise
The conclusion that the quantum critical concentration is near $x=0.35$ assumes the $x=0.35$ crystal remains paramagnetic all the way down to absolute zero, but the magnetization, transport, and Arrott-plot data only reach 2 K, so an ordering transition between 0 K and 2 K would shift the critical window upward.
Editorial extensions
If this is right
- The ferromagnetic ground state of $\mathrm{Ce}_{3-x}\mathrm{Mg}_x\mathrm{Co}_9$ begins near $x\approx0.35$, not at the $x\approx0.80$ reported for single-phase polycrystals, so magnesium is about twice as effective at inducing ferromagnetism in clean single crystals.
- For compositions just above the boundary, $T_C$ grows approximately linearly with magnesium content, reaching about 25 K at $x=0.43$ and about 70 K at $x=0.50$.
- The $x=0.35$ composition is the best current candidate for a quantum critical point in this family: it stays non-ferromagnetic down to 2 K, so any magnetic order would have to set in below that temperature.
- No additional magnetic phase appears between the paramagnet and the ferromagnet in the composition range studied, leaving a single phase boundary in the $T_C$-$x$ diagram.
- The absence of a resolvable specific-heat anomaly at $T_C\approx70$ K for $x=0.50$ implies that little entropy is lost at the transition, in line with a weak itinerant moment and spin fluctuations above $T_C$.
Reading between the lines
- If the transition is a genuine continuous quantum phase transition, the $x=0.35$ crystal should show anomalous low-temperature scaling near $x_c$, such as a power-law resistivity with a non-Fermi-liquid exponent or a diverging $C/T$; these signatures were not measured here and would test the quantum-critical interpretation.
- The same Arrott-plot analysis applied to higher-magnesium single crystals could show whether $T_C$ keeps rising linearly toward the reported 450-K ferromagnet or bends over, which would change the shape and character of the quantum critical region.
- A direct test that the low-$x$ Pauli-paramagnetic signal is intrinsic would be to measure a truly undoped $\mathrm{CeCo}_3$ single crystal grown by the same flux method, since the $x=0.01$ data could still be affected by trace impurities such as the $\mathrm{CeCo}_2$ inclusions visible in the lowest-doped growths.
Signed reviews
Editorial analysis
A structured set of objections, weighed in public.
Referee Report
Summary. The manuscript reports the growth of flux-grown single crystals of Ce3-xMgxCo9 with EDS-inferred compositions x = 0.01, 0.16, 0.24, 0.35, 0.43, and 0.50, and presents magnetization M(T), M(H), Arrott-plot, electrical resistivity, and specific-heat data. From the absence of origin-crossing Arrott isotherms for x = 0.35 down to 2 K and the presence of hysteresis and finite Curie temperatures for x = 0.43 (TC ≈ 25 K) and x = 0.50 (TC ≈ 70 K), the authors infer a TC-x phase diagram with a quantum phase transition from a Pauli paramagnetic to a ferromagnetic ground state at a critical concentration given as 0.35 ≤ x ≤ 0.40. They argue that this critical concentration is roughly half the magnesium content previously reported for ferromagnetism in polycrystalline samples, and they attribute the difference to the clean single-crystal environment.
Significance. If the inference is correct, the paper provides a direct, single-crystal bracket of the composition-controlled onset of ferromagnetism in a fragile itinerant-moment system, with a transparent Arrott-plot analysis that includes demagnetization corrections and a clear distinction between the non-ferromagnetic x = 0.35 and the ferromagnetic x = 0.43 and x = 0.50 samples. The work is valuable for its comparison with the earlier polycrystalline study and for its explicit demonstration that the ferromagnetic phase appears at significantly lower Mg content in single crystals. The main strengths are the direct magnetization evidence, the recognition of the finite-temperature limitation in the Fig. 5 caption, and the careful reuse of previous polycrystalline data as a context rather than as a forcing function. The principal weakness is that the 'quantum phase transition' label and the 'Pauli paramagnetic ground state' conclusion are not fully supported by measurements that terminate at 2 K.
major comments (2)
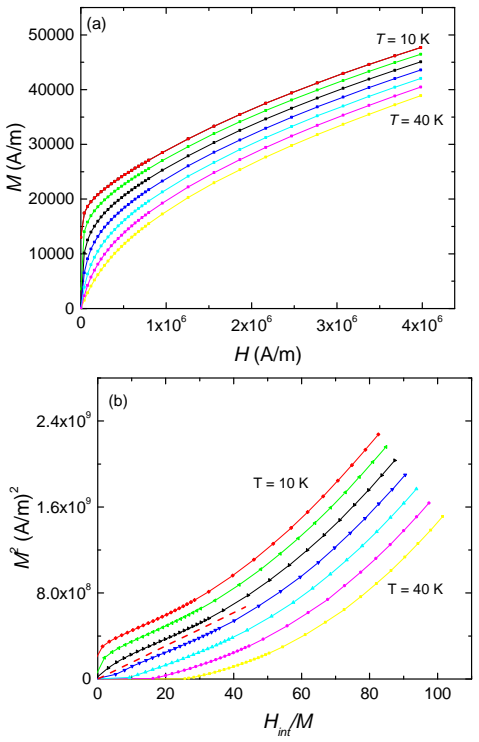
- [§4 (Conclusions) and Fig. 5] The central claim that x ≈ 0.35 is a quantum critical concentration rests on the premise that the x = 0.35 composition has a paramagnetic zero-temperature ground state. The evidence, however, is limited to T ≥ 2 K: the Arrott plot in Fig. 5 at 2 K has a positive intercept, which excludes ferromagnetic order only above 2 K. An ordering transition below 2 K would produce exactly the observed behavior—no origin-crossing Arrott lines at 2 K, a mild upturn in M(T) in Fig. 2, and the low-field curvature in Fig. 4. The caption's statement that 'the Curie temperature is suggested to be lower than 2 K' concedes this gap. To claim a quantum phase transition, the authors should either extend the measurements below 2 K (e.g., with a dilution refrigerator) or revise the conclusions to state that x = 0.35 shows no magnetic ordering down to 2 K and that a quantum critical point is plausible but not established.
- [§2 (Experimental details), Table 1] The identification of the low-x samples (x = 0.01, 0.16, 0.24) as Pauli paramagnets is used to anchor the left side of the phase diagram. The text reports that for the nominal x = 0.05, 0.10, and 0.15 growths—whose EDS compositions are x = 0.01, 0.16, and 0.24—'traces of CeCo2 impurities were visible in the cross sectional view of SEM images.' The manuscript does not quantify the impurity fraction nor demonstrate that the impurity contribution cannot dominate the measured magnetization. Since the flat M(T) data are the key evidence for Pauli paramagnetism, the authors should provide a quantitative estimate of the impurity phase concentration (for example, from Rietveld refinement or SEM/EDS mapping) and show that it is too small to affect the conclusions, or discuss how the impurity signal was separated from the matrix signal.
minor comments (5)
- [Abstract and §4] The abstract states 'a quantum phase transition near x = 0.35' while the conclusions state '0.35 ≤ x ≤ 0.40'; the text elsewhere writes '0.35 < x < 0.40' (for example, in §1 and near Figs. 10 and 11). Please standardize the critical-concentration range across the abstract, text, and conclusions.
- [Keywords] The keyword 'Pauli maramagnet' appears to be a typo for 'Pauli paramagnet'.
- [Fig. 5] The caption says the Arrott plot data are for '2 K ≤ T ≤ 18 K at a step of 4 K', which gives isotherms at 2, 6, 10, 14, and 18 K, but the figure legend appears to label only '2 K' and '18 K'. Please verify the temperature labels are consistent with the step size.
- [§2 and Fig. 5] The determination of the demagnetization factor N is referenced to earlier papers [9–11] but not described here; adding one sentence outlining the method (for example, from the sample shape and orientation) would make the Arrott-plot analysis more reproducible.
- [§3 (Results and discussion)] The statement that 'no additional magnetic phases were found in the vicinity of the quantum phase transition composition' is based on only six compositions; consider softening the claim or specifying the composition range and measurement window over which this assertion holds.
Circularity Check
No significant circularity: the phase boundary is inferred directly from measured magnetization and Arrott-plot data, and self-citations are contextual rather than load-bearing.
full rationale
The central claim — a ferromagnetic quantum phase transition near x = 0.35 — is an inference from measured M(T), M(H), and Arrott-plot data on flux-grown single crystals, not a derived prediction from a fitted model. The critical concentration is bracketed by the observations that Ce2.65Mg0.35Co9 shows no Arrott-plot origin crossing for T ≥ 2 K, while x = 0.43 and x = 0.50 yield TC ≈ 25 K and ≈ 70 K respectively. No equation in the paper has an output that is equivalent to its input by construction; the Curie temperatures are read from standard Arrott constructions, and the phase boundary is drawn through measured composition brackets rather than through a parameter fitted to the boundary itself. Self-citations to the authors' earlier polycrystalline study are used for context and comparison — easy-axis orientation, the polycrystalline TC values shown as hollow stars, and the prior observation of ferromagnetism near x = 0.80 — and are not used to force the single-crystal result. In fact, the present finding refines the prior polycrystalline threshold rather than relying on it. The finite-temperature limitation (measurements only down to 2 K) is a legitimate correctness risk about extrapolating to T = 0, but it is not a circularity: the paper explicitly reports what is measured and labels the phase diagram as inferred. No fitted input is renamed as a prediction, and no uniqueness theorem or ansatz is imported from the authors' prior work.
Assumptions & free parameters
assumptions (4)
- domain assumption Arrott plot analysis assumes a mean-field equation of state for the magnetic system.
- domain assumption Demagnetization field correction (Hint = Happlied - N*M) is valid for the sample geometry with N from cited references.
- domain assumption The CeCo2 impurity phase seen in SEM for low-x samples does not dominate the measured magnetic response.
- domain assumption The 2 K ground state is representative of the T=0 ground state for x=0.35 and below.
Cite this review
Pith. "Pith review of Study of the ferromagnetic quantum phase transition in Ce$_{3-x}$Mg$_x$Co$_{9}$." pith.science (2026). https://pith.science/paper/2TNTDCPH
@misc{pith2026190803126,
  author       = {Pith},
  title        = {Pith review of: Study of the ferromagnetic quantum phase transition in Ce$_3-x$Mg$_x$Co$_9$},
  year         = {2026},
  howpublished = {\url{https://pith.science/paper/2TNTDCPH}},
  note         = {Machine review of arXiv:1908.03126}
}
abstract
The Ce$_{3-x}$Mg$_x$Co$_{9}$ system evolves from a Pauli paramagnetic ground state for $x = 0$ to a ferromagnetic ground state for $x\approx0.80$ in single phase, polycrystalline samples [Phys. Rev. Applied 9, 024023 (2018)]. In order to better understand this behavior, single crystalline samples of Ce$_{3-x}$Mg$_x$Co$_{9}$ for \textit{x} = 0.01, 0.16, 0.24, 0.35, 0.43 and 0.50 were grown using the flux growth technique, and electrical transport and magnetic properties were studied. The \textit{T}$_C$-\textit{x} phase diagram we infer shows that the system has a quantum phase transition near \textit{x} = 0.35, transforming to a ferromagnetic ground state.
Figures


Figures from the paper (10 more)




Reference graph
Works this paper leans on
-
[1]
Preserved entropy and fragile mag- netism
Paul C Canfield and Sergey L Bud’ko. Preserved entropy and fragile mag- netism. Reports on Progress in Physics , 79(8):084506, jul 2016
work page 2016
-
[2]
Lamichhane, Valentin Taufour, Andriy Palasyuk, Qisheng Lin, Sergey L
Tej N. Lamichhane, Valentin Taufour, Andriy Palasyuk, Qisheng Lin, Sergey L. Bud’ko, and Paul C. Canfield. Ce3−xMgxCo9: Transformation of a Pauli Paramagnet into a Strong Permanent Magnet. Phys. Rev. Applied , 9:024023, Feb 2018
work page 2018
-
[3]
Tribhuwan Pandey and David S. Parker. Borderline Magnetism: How Adding Mg to Paramagnetic CeCo3 Makes a 450-K Ferromagnet with Large Magnetic Anisotropy. Phys. Rev. Applied , 10:034038, Sep 2018
work page 2018
-
[4]
G. Z. Xing, Y. H. Lu, Y. F. Tian, J. B. Yi, C. C. Lim, Y. F. Li, G. P. Li, D. D. Wang, B. Yao, J. Ding, Y. P. Feng, and T. Wu. Defect-induced magnetism in undoped wide band gap oxides: Zinc vacancies in ZnO as an example. AIP Advances, 1(2):022152, 2011
work page 2011
-
[5]
Yusei Shimizu, Bernard Salce, Tristan Combier, Dai Aoki, and Jacques Flouquet. Uniaxial-stress-induced ferromagnetism in the itinerant meta- magnetic compound UCoAl probed by magnetostriction measurements. Journal of the Physical Society of Japan , 84(2):023704, 2015. 12
work page 2015
-
[6]
Yu-Jun Zhao, S. Picozzi, A. Continenza, W. T. Geng, and A. J. Freeman. Possible impurity-induced ferromagnetism in II−Ge−V2 chalcopyrite semi- conductors. Phys. Rev. B , 65:094415, Feb 2002
work page 2002
-
[7]
Paul C. Canfield and Ian R. Fisher. High-temperature solution growth of in- termetallic single crystals and quasicrystals. J. Cryst. Growth , 225(24):155 – 161, 2001
work page 2001
-
[8]
Anthony Arrott and John E. Noakes. Approximate equation of state for nickel near its critical temperature. Phys. Rev. Lett., 19:786–789, Oct 1967
work page 1967
Show all 13 references
-
[9]
Demagnetizing factors for rectangular ferromagnetic prisms
Amikam Aharoni. Demagnetizing factors for rectangular ferromagnetic prisms. J. Appl. Phys. , 83(6):3432–3434, 1998
1998
-
[10]
Lamichhane, Valentin Taufour, Srinivasa Thimmaiah, David S
Tej N. Lamichhane, Valentin Taufour, Srinivasa Thimmaiah, David S. Parker, Sergey L. Bud’ko, and Paul C. Canfield. A study of the physical properties of single crystalline Fe 5B2P. J. Magn. Magn. Mater. , 401:525 – 531, 2016
2016
-
[11]
Lamichhane, Valentin Taufour, Morgan W
Tej N. Lamichhane, Valentin Taufour, Morgan W. Masters, David S. Parker, Udhara S. Kaluarachchi, Srinivasa Thimmaiah, Sergey L. Bud’ko, and Paul C. Canfield. Discovery of ferromagnetism with large magnetic anisotropy in ZrMnP and HfMnP. Appl. Phys. Lett. , 109(9):092402, 2016
2016
-
[12]
K.H.J. Buschow. Magnetic properties of CeCo 3, Ce 2Co7 and CeNi 3 and their ternary hydrides. Journal of the Less Common Metals , 72(2):257 – 263, 1980
1980
-
[13]
Mohn and G
P. Mohn and G. Hilscher. Influence of spin fluctuations on the specific heat and entropy of weakly itinerant ferromagnets. Phys. Rev. B , 40:9126–9134, Nov 1989. 13
1989
Reviewed August 14, 2026 · model on record in the stance chip above.
Discussion (0). Continue with ORCID to comment.