REVIEW 2 major objections 4 minor 38 references
Kernel-phase Detection Limits : Hypothesis Testing and the Example of JWST NIRISS Full Pupil Images
T0 review · 2 major / 4 minor · reviewed 2026-08-14 · deepseek-v4-flash
Pith's one-line read This paper shows that binary detection with kernel phases can be cast as a hypothesis-testing problem, and that a practical generalized likelihood-ratio test comes within a factor of about 2.5 in contrast of the Neyman-Pearson upper bound…
desk verdict A genuinely useful statistical framework for kernel-phase detection limits, with a clear-eyed caveat about calibration residuals that the authors themselves acknowledge. read the letter →
The pith
A machine-rendered reading of the paper's core claim, the machinery that carries it, and where it could break.
The reading
What carries the argument
The kernel matrix $K$ is the left nullspace of the aperture phase transfer matrix $A$, so $KA = 0$; applied to the Fourier phase $\varphi$ it produces kernel phases $k = K\varphi$ that are first-order insensitive to aberration phase. Whitening by $\Sigma^{-1/2}$ decorrelates them into statistically independent observables. The operational detection test is the binary generalized likelihood ratio $T_B = 2y^{\mathsf{T}}\hat{x} - \hat{x}^{\mathsf{T}}\hat{x}$, which equals the reduction in squared residuals between the null model and the fitted binary model, $T_{\chi^2}(0,y) - T_{\chi^2}(\hat{x},y)$. The covariance $\Sigma$ is estimated from $10^5$ Monte Carlo noise realizations, with a diagonal inflation term set by ten OPD maps scaled to 16 nm RMS to represent calibration drift. This machinery carries the argument because it converts an image into a vector with known statistics, allowing detection thresholds and contrast limits to be computed rather than guessed.
What would settle it
Take a real F480M full-pupil NIRISS observation of a binary with a $W2 \approx 14.1$ primary and a confirmed companion at about 200 mas with contrast near $10^3$, using an 80-minute on-target sequence as simulated; if the operational test $T_B$ does not achieve $P_{\mathrm{DET}} \approx 68\%$ at $P_{\mathrm{FA}} = 1\%$ for this companion, the predicted detection limit is not realized. A simpler numerical check is to simulate a correlated calibration term beyond the diagonal inflation and see whether $T_B$'s contrast limit falls more than a factor of 2.5 below the Neyman-Pearson bound.
Extended reading notes
Core claim
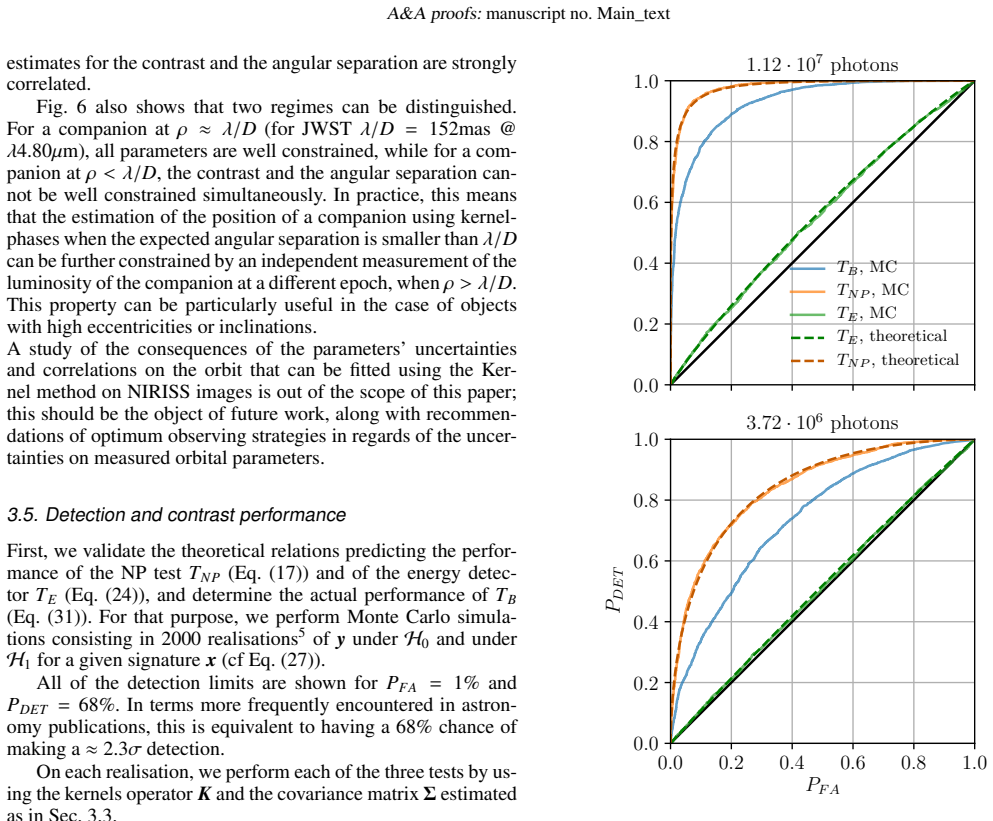
The central claim is that detection of a binary by kernel phases can be fully characterized by three tests operating on whitened kernel-phase observables. The paper constructs a whitened vector $y = \Sigma^{-1/2} k$ from kernel phases $k$, with covariance $\Sigma$ modelled from photon, readout, and dark noise plus a diagonal calibration-inflation term. In this space the problem is $y = \epsilon$ under the null hypothesis and $y = x + \epsilon$ under the alternative, with $\epsilon$ standard Gaussian. The likelihood-ratio (Neyman-Pearson) test $T_{\mathrm{NP}} = y^{\mathsf{T}} x$ is the most powerful possible; the energy detector $T_E = \|y\|^2$ uses no target information and is the least powerful; and the binary test $T_B = 2y^{\mathsf{T}} \hat{x} - \hat{x}^{\mathsf{T}} \hat{x}$ substitutes the maximum-likelihood estimate of the binary signature (separation, position angle, contrast). Monte Carlo simulations on NIRISS F480M images show that $T_B$'s ROC curve hugs the $T_{\mathrm{NP}}$ curve, and that the resulting contrast limits are within a factor of 2.5 of the theoretical bound at $P_{\mathrm{FA}} = 1\%$ and $P_{\mathrm{DET}} = 68\%$. For a $W2 = 14.1$ Y dwarf, companions at contrasts up to about $10^3$ at 200 mas are detectable; the brightest unsaturated targets could reach contrasts of $10^4$ to $10^5$ beyond about 500 mas, barring wavefront drift, whose uncalibrated residual accounts for 85% of the kernel noise variance in that bright regime.
Load-bearing premise
The quoted limits assume that after whitening, kernel-phase noise is Gaussian with a known covariance and that uncalibrated wavefront drift acts only as a diagonal variance inflation estimated from ten 16 nm RMS OPD maps; if real JWST calibration errors are correlated, time-varying, or larger than assumed, the contrast limits, especially the bright-target factor-of-ten degradation, will be worse.
Editorial extensions
If this is right
- At $P_{\mathrm{FA}} = 1\%$ and $P_{\mathrm{DET}} = 68\%$, companions of contrast around $10^3$ at 200 mas are detectable around $W2 = 14.1$ Y dwarfs in F480M, which translates to a 1 Jupiter-mass companion at 1.5 AU around a 30 Jupiter-mass brown dwarf at 8 pc.
- For the brightest NIRISS full-pupil targets, contrasts up to about $10^4$ (and ideally $10^5$ beyond 500 mas) are reachable if wavefront drift stays near the 16 nm RMS prediction; a drift of that size cuts bright-target performance by about a factor of 10.
- Because the false-alarm probability stays constant for phase aberrations below about one radian, thresholds can be set a priori and surveys do not need to re-calibrate the false-alarm rate at every epoch.
- The same three-test framework applies to any adequately sampled imaging system, including aperture-masking (NRM) data, not only NIRISS full-pupil images.
- At separations below $\lambda/D$, contrast and separation estimates are strongly correlated, so orbital fits for such binaries will need independent companion-luminosity or astrometric priors.
Reading between the lines
- The small gap between $T_B$ and the Neyman-Pearson bound implies that further algorithmic or calibration improvements can buy at most roughly a factor of 2.5 in contrast; more radical gains would need new observables such as visibility amplitudes, which the paper notes are left unused.
- The constant false-alarm property suggests an operational survey design: fix thresholds from simulations once, then monitor only the empirical false-alarm rate on calibrator fields, which would also reveal whether correlated calibration errors are secretly inflating detections.
- A direct test of the predictions is possible with early JWST NIRISS data on known wide binaries: measure the $T_B$ ROC empirically and compare the 68% detection contour with the paper's simulated curves, including the position-angle dependence produced by the non-centrosymmetric JWST PSF.
- The position-angle dependence of the limits implies that observatories should publish per-orientation detection-limit maps rather than a single contrast curve; surveys combining multiple roll angles could then marginalize over the PSF asymmetry.
Signed reviews
Editorial analysis
A structured set of objections, weighed in public.
Referee Report
Summary. The paper develops a statistical hypothesis-testing framework for kernel-phase observables and applies it to simulated JWST NIRISS full-pupil F480M images. Three detection tests are constructed on whitened kernel phases: the Neyman-Pearson (NP) test for a known companion signature, an energy detector for a completely unknown signature, and a generalized likelihood ratio test (T_B) for a binary companion with unknown position and contrast. Analytic false-alarm and detection probabilities are derived for the NP and energy tests, while the distribution of T_B is calibrated by Monte Carlo simulation. The authors validate the theoretical ROC curves against Monte Carlo runs, show that T_B performs close to the NP upper bound, and derive contrast detection limits for representative Y-dwarf targets. The headline quantitative result is that, at PFA = 1% and PDET = 68%, companions at contrasts up to about 10^3 at 200 mas around a W2 = 14.1 target are detectable, with brighter targets allowing contrasts up to 10^5 in the idealized case.
Significance. If the results hold, the paper provides a principled and general method for computing and guaranteeing kernel-phase detection limits with controlled false-alarm rates, applicable to any well-sampled high-Strehl imaging instrument. The Monte Carlo validation of the theoretical distributions is a clear strength, and the use of open-source simulation tools (XARA, ami_sim) makes the numerical experiments reproducible. The paper also supplies concrete, falsifiable predictions for JWST NIRISS full-pupil observations, and it correctly identifies the NP test as an upper performance bound. The central methodological derivation—the whitened Gaussian model and the three tests—is standard and sound, and the Monte Carlo checks support the claimed distributions for T_NP and T_E.
major comments (2)
- [3.4 and 3.5] The Monte Carlo evaluation of T_B initializes the least-squares optimizer at the true injected companion parameters ('The initialisation of the algorithm corresponds to the parameters of the injected companion'), and the paper does not state how the test is initialized under H0, where no true companion exists. Because the likelihood is multimodal (Fig. 2), the reported ROC curves and detection limits for T_B (Figs. 7-9 and 11) are conditional on an oracle start point. The assertion that a systematic grid search gives 'very similar results' is not documented with any quantitative comparison. A blind operational search can converge to local maxima, which would change both the detection power and the Monte-Carlo-calibrated threshold. Please quantify the grid-search comparison, specify the initialization under H0, and, if performance degrades, qualify the claim that T_B is an operational test close to the NP bound.
- [3.3 and 3.7] The calibration error is modeled only as a diagonal term added to the covariance, and the paper explicitly chooses not to pursue non-diagonal terms (Sec. 3.3). In the bright-target scenario this term accounts for 85% of the total noise variance (Sec. 3.7), so the whitening in Eq. (8) and the distributions of T_NP, T_E, and T_B rely on the assumption that calibration residuals are uncorrelated across kernel phases. If they are correlated, the nominal 1% false-alarm rate is not guaranteed and the bright-target limits in Fig. 11, including the 10^5 contrast value, are not robust. Please either estimate the full calibration covariance from a larger set of OPD realizations and re-run the tests, or present the bright-target limits with an explicit caveat that they hold only under the diagonal-calibration assumption.
minor comments (4)
- [3.5 / Fig. 8 caption] The caption lists 'The dashed lines represent theoretical detection limits for TE and TNP (Eq. (17) and Eq. (24))', but the equation numbers are swapped: Eq. (17) gives the TNP ROC and Eq. (24) gives the TE ROC.
- [3.2] In the sentence 'will result in unaccounted residual residual errors', the word 'residual' is duplicated.
- [2.2] In the first paragraph, 'ker phases' should read 'kernel phases'.
- [3.4] The closing sentence 'The gradient descent procedure is indeed only applicable in the context of only applicable in the context of the determination of detection limits' contains a repeated phrase and should be rewritten.
Circularity Check
No significant circularity: detection limits are model-based predictions computed from simulated noise and analytical test statistics, with no parameter fitted to the claimed result.
full rationale
The derivation chain is self-contained. The paper builds whitened kernel-phase observables y = Sigma^{-1/2} k from the linear kernel-phase model and derives the Neyman-Pearson and energy-detector tests analytically (Eqs. 14-17 and 22-25). The operational binary test T_B is characterized by Monte Carlo simulation, and its detection limits in Figs. 8 and 11 are computed from those simulated distributions together with a covariance estimated from 10^5 synthetic frames and an a priori calibration-error model based on Perrin et al. OPD maps. No parameter is fitted to the claimed contrast limits, and the paper explicitly treats the Monte Carlo calibration of the T_B threshold as a calibration step rather than as an independent prediction. Self-citations to XARA and ami_sim are citations to software tools used in the simulations, not load-bearing evidence for the statistical claims. The paper itself flags the diagonal approximation for calibration residuals and the idealized wavefront-drift model as the most critical limitations; these are modeling assumptions and correctness risks, not circular reductions of the prediction to its inputs.
Assumptions & free parameters
assumptions (5)
- domain assumption Kernel-phase linear model: phi = phi0 + A*phi with aberrations below about 1 radian, and K*A=0 (Martinache 2010).
- domain assumption Whitened kernel-phase noise is i.i.d. standard Gaussian: y = Sigma^{-1/2} k, with known covariance Sigma (Eq. 10).
- domain assumption The binary target is a pair of unresolved point sources with intensity model Eq. (26) and visibility Eq. (27).
- domain assumption Calibration residuals from wavefront drift are captured by adding a diagonal variance term estimated from 10 OPD maps scaled to 16 nm RMS (Sec. 3.2).
- ad hoc to paper The MLE optimization in the Monte Carlo runs is initialized near the global minimum (Sec. 3.4).
Cite this review
Pith. "Pith review of Kernel-phase Detection Limits : Hypothesis Testing and the Example of JWST NIRISS Full Pupil Images." pith.science (2026). https://pith.science/paper/GQGMNSBM
@misc{pith2026190803130,
  author       = {Pith},
  title        = {Pith review of: Kernel-phase Detection Limits : Hypothesis Testing and the Example of JWST NIRISS Full Pupil Images},
  year         = {2026},
  howpublished = {\url{https://pith.science/paper/GQGMNSBM}},
  note         = {Machine review of arXiv:1908.03130}
}
read the original abstract
The James Webb Space Telescope will offer high-angular resolution observing capability in the near-infrared with masking interferometry on NIRISS, and coronagraphic imaging on NIRCam & MIRI. Full aperture kernel-phase based interferometry complements these observing modes, probing for companions at small separations while preserving the telescope throughput. Our goal is to derive both theoretical and operational contrast detection limits for the kernel-phase analysis of JWST NIRISS full-pupil observations by using tools from hypothesis testing theory, applied to observations of faint brown dwarfs with this instrument, but the tools and methods introduced here are applicable in a wide variety of contexts. We construct a statistically independent set of observables from aberration-robust kernel phases. Three detection tests based on these observable quantities are designed and analysed, all guaranteeing a constant false alarm rate for small phase aberrations. One of these tests, the Likelihood Ratio or Neyman-Pearson test, provides a theoretical performance bound for any detection test. The operational detection method considered here is shown to exhibit only marginal power loss with respect to the theoretical bound. In principle, for the test set to a false alarm probability of 1%, companion at contrasts reaching 10^3 at separations of 200 mas around objects of magnitude 14.1 are detectable. With JWST NIRISS, contrasts of up to 10^4 at separations of 200 mas could be ultimately achieved, barring significant wavefront drift. The proposed detection method is close to the ultimate bound and offers guarantees over the probability of making a false detection for binaries, as well as over the error bars for the estimated parameters of the binaries detectable by JWST NIRISS. This method is not only applicable to JWST NIRISS but to any imaging system with adequate sampling.
Figures


Figures from the paper (7 more)




Reference graph
Works this paper leans on
-
[1]
Andrieu, C., de Freitas, N., Doucet, A., & Jordan, M. I. 2003, Machine Learning, 50, 5 Artigau, ˘A., Sivaramakrishnan, A., Greenbaum, A. Z., et al. 2014, Society of Photo-Optical Instrumentation Engineers (SPIE) Conference Series, 9143, 914340
work page 2003
-
[2]
Baldwin, J. E., Haniff, C. A., Mackay, C. D., & Warner, P. J. 1986, Nature, 320, 595 Baraffe, I., Chabrier, G., Barman, T. S., Allard, F., & Hauschildt, P. H. 2003, Astronomy & Astrophysics, 402, 701
work page 1986
-
[3]
Bernat, D., Bouchez, A. H., Ireland, M., et al. 2010, The Astrophysical Journal, 715, 724
work page 2010
-
[4]
Branch, M. A., Coleman, T. F., & Li, Y . 1999, SIAM J. Sci. Comput., 21, 442
work page 1999
-
[5]
Cushing, M. C., Kirkpatrick, J. D., Gelino, C. R., et al. 2011, The Astrophysical Journal, 743, 50
work page 2011
-
[6]
Dupuy, T. J. & Kraus, A. L. 2013, Science, 341, 1492
2013
-
[7]
2018, Monthly Notices of the Royal Astronomical Society, 479, 2702
Fontanive, C., Biller, B., Bonavita, M., & Allers, K. 2018, Monthly Notices of the Royal Astronomical Society, 479, 2702
work page 2018
-
[8]
E., McKernan, B., Sivaramakrishnan, A., et al
Ford, K. E., McKernan, B., Sivaramakrishnan, A., et al. 2014, Astrophysical Journal, 783
work page 2014
Show all 38 references
-
[9]
P., Mather, J
Gardner, J. P., Mather, J. C., Clampin, M., et al. 2006, Space Science Reviews, 123, 485
2006
-
[10]
2016, ami_sim
Greenbaum, A., Sivaramakrishnan, A., Sahlmann, J., & Thatte, D. 2016, ami_sim
2016
-
[11]
Z., Pueyo, L., Ruffio, J.-b., et al
Greenbaum, A. Z., Pueyo, L., Ruffio, J.-b., et al. 2018, The Astronomical Journal, 155, 226
2018
-
[12]
Z., Pueyo, L., Sivaramakrishnan, A., & Lacour, S
Greenbaum, A. Z., Pueyo, L., Sivaramakrishnan, A., & Lacour, S. 2015, The Astrophysical Journal, 798, 68 Huélamo, N., Lacour, S., Tuthill, P., et al. 2011, Astronomy & Astrophysics, 528, L7
2015
-
[13]
Ireland, M. J. 2013, Monthly Notices of the Royal Astronomical Society, 433, 1718
2013
-
[14]
Jennison, R. C. 1958, Monthly Notices of the Royal Astronomical Society, 118, 276
1958
-
[15]
J., Martinache, F., & Girard, J
Kammerer, J., Ireland, M. J., Martinache, F., & Girard, J. H. 2019, Monthly Notices of the Royal Astronomical Society, 486, 639
2019
-
[16]
D., Cushing, M
Kirkpatrick, J. D., Cushing, M. C., Gelino, C. R., et al. 2011, The Astrophysical Journal Supplement Series, 197, 19 Article number, page 10 of 11
2011
-
[17]
L., Ireland, M
Kraus, A. L., Ireland, M. J., Martinache, F., & Hillenbrand, L. A. 2011, The Astrophysical Journal, 731
2011
-
[18]
L., Ireland, M
Kraus, A. L., Ireland, M. J., Martinache, F., & Lloyd, J. P. 2008, The Astrophys- ical Journal, 679, 762
2008
-
[19]
2011, Astronomy & Astrophysics, 532, A72
Lacour, S., Tuthill, P., Amico, P., et al. 2011, Astronomy & Astrophysics, 532, A72
2011
-
[20]
2019, Astronomy & Astrophysics, 494 Le Bouquin, J.-B
Laugier, R., Martinache, F., Ceau, A., et al. 2019, Astronomy & Astrophysics, 494 Le Bouquin, J.-B. & Absil, O. 2012, Astronomy & Astrophysics, 541, A89
2019
-
[21]
A., Wright, E
Marsh, K. A., Wright, E. L., Kirkpatrick, J. D., et al. 2013, Astrophysical Journal, 762
2013
-
[22]
2010, Astrophysical Journal, 724, 464
Martinache, F. 2010, Astrophysical Journal, 724, 464
2010
-
[23]
2009, in AIP Conference Proceedings (AIP), 393–394
Martinache, F., Guyon, O., Garrel, V ., et al. 2009, in AIP Conference Proceedings (AIP), 393–394
2009
-
[24]
1989, Astronomical Journal (ISSN 0004-6256), 97, 1510
Nakajima, T. 1989, Astronomical Journal (ISSN 0004-6256), 97, 1510
1989
-
[25]
& Pearson, E
Neyman, J. & Pearson, E. S. 1933, Philosophical Transactions of the Royal So- ciety A: Mathematical, Physical and Engineering Sciences, 231, 289
1933
-
[26]
D., Pueyo, L., Rajan, A., et al
Perrin, M. D., Pueyo, L., Rajan, A., et al. 2018, in Space Telescopes and Instru- mentation 2018: Optical, Infrared, and Millimeter Wave, ed. H. A. MacEwen, M. Lystrup, G. G. Fazio, N. Batalha, E. C. Tong, & N. Siegler, V ol. 1069809 (SPIE), 8
2018
-
[27]
2013, The Astrophysical Journal, 767, 110
Pope, B., Martinache, F., & Tuthill, P. 2013, The Astrophysical Journal, 767, 110
2013
-
[28]
H., Shaklan, S
Pravdo, S. H., Shaklan, S. B., Wiktorowicz, S. J., et al. 2006, The Astrophysical Journal, 649, 389
2006
-
[29]
B., Eisner, J
Sallum, S., Follette, K. B., Eisner, J. A., et al. 2015, Nature, 527, 342
2015
-
[30]
& Skemer, A
Sallum, S. & Skemer, A. 2019, Journal of Astronomical Telescopes, Instruments, and Systems, 5, 1
2019
-
[31]
& Friedlander, B
Scharf, L. & Friedlander, B. 1994, IEEE Transactions on Signal Processing, 42, 2146
1994
-
[32]
C., Cushing, M
Schneider, A. C., Cushing, M. C., Kirkpatrick, J. D., et al. 2015, The Astrophys- ical Journal, 804, 92
2015
-
[33]
Sivaramakrishnan, A., Lafrenière, D., Ford, K. E. S., et al. 2012, in Space Tele- scopes and Instrumentation 2012: Optical, Infrared, and Millimeter Wave, V ol. 8442, 84422S
2012
-
[34]
2004, AIP Conference Proceedings, 735, 395 STSCI
Skilling, J. 2004, AIP Conference Proceedings, 735, 395 STSCI. 2018, NIRISS Imaging
2004
-
[35]
2006, Science, 313, 935 van Cittert, P
Tuthill, P., Monnier, J., Tanner, A., et al. 2006, Science, 313, 935 van Cittert, P. 1934, Physica, 1, 201
2006
-
[36]
L., Eisenhardt, P
Wright, E. L., Eisenhardt, P. R., Mainzer, A. K., et al. 2010, Astronomical Jour- nal, 140, 1868
2010
-
[37]
1938, Physica, 5, 785
Zernike, F. 1938, Physica, 5, 785
1938
-
[38]
2016, IEEE Transactions on Geo- science and Remote Sensing, 54, 5588 Article number, page 11 of 11
Zwieback, S., Liu, X., Antonova, S., et al. 2016, IEEE Transactions on Geo- science and Remote Sensing, 54, 5588 Article number, page 11 of 11
2016
Reviewed August 14, 2026 · model on record in the stance chip above.
Discussion (0). Continue with ORCID to comment.