REVIEW 3 major objections 4 minor 23 references
Optical and photoelectrical studies on anisotropic metal-insulator transition of RuAs
T0 review · 3 major / 4 minor · reviewed 2026-08-14 · deepseek-v4-flash
Pith's one-line read The central claim is that RuAs's two-step metal-insulator transition is driven by anisotropic gap opening: the c-axis gap appears near 250 K, while the b-axis gap appears only near 200 K.
desk verdict Solid LDA-backed optical study of RuAs, but the headline anisotropic gap-opening temperatures rely on an unvalidated Drude-Lorentz fit. read the letter →
The pith
A machine-rendered reading of the paper's core claim, the machinery that carries it, and where it could break.
The reading
What carries the argument
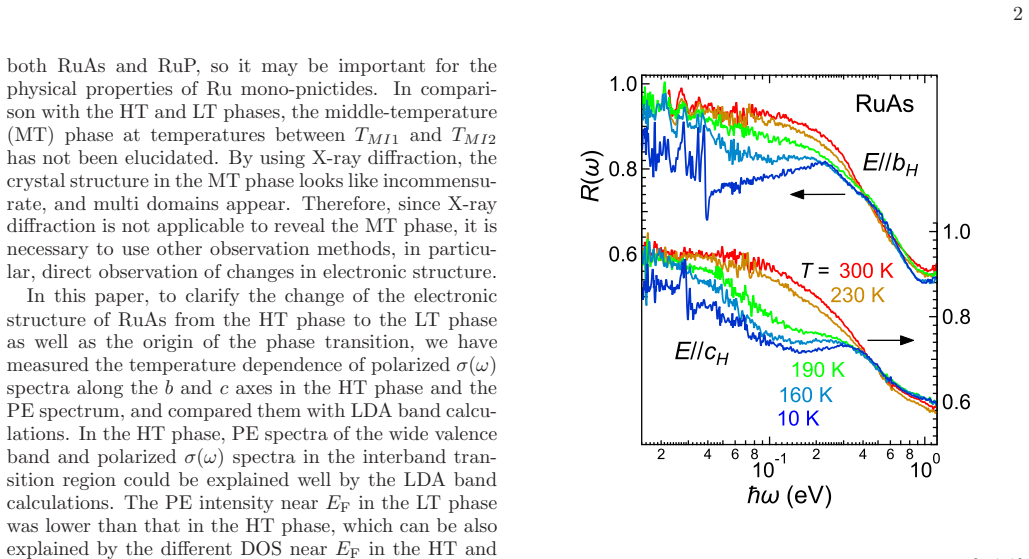
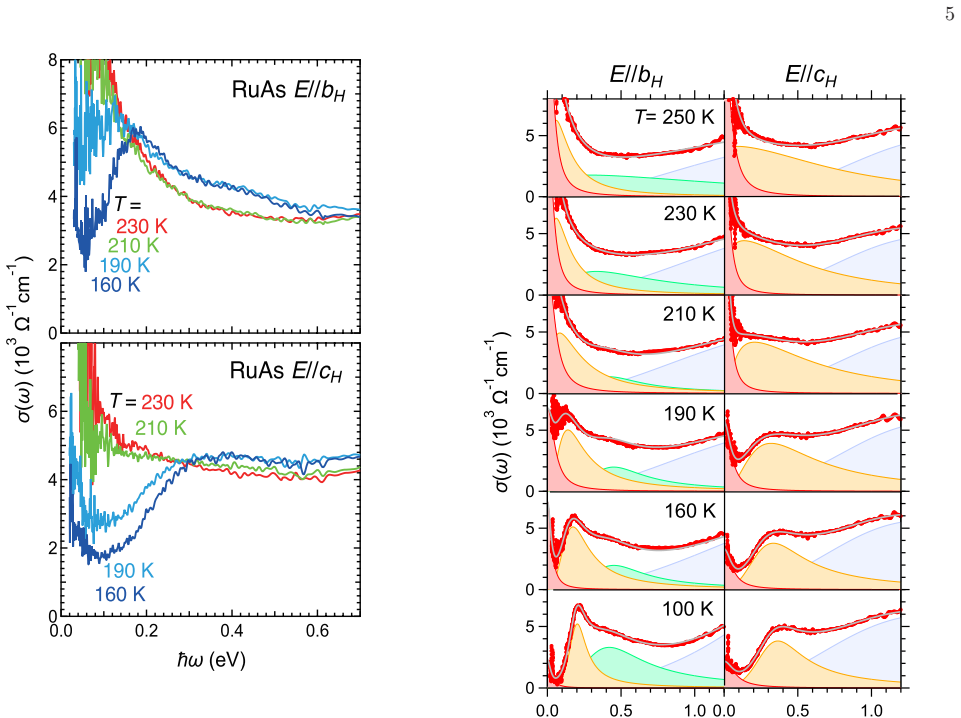
The central tool is temperature-dependent polarized optical conductivity σ(ω) obtained from Kramers-Kronig analysis of reflectivity, fitted with one Drude and two or three Lorentz oscillators. The load-bearing quantities are the energy of the lowest-energy Lorentz peak and the center of gravity of the spectrum below 1.2 eV, tracked versus temperature and fitted to the BCS gap function to assign each axis its own gap-opening temperature.
What would settle it
A single experiment that would settle it: polarized optical conductivity on detwinned crystals with the low-energy reflectance measured directly down to a few meV instead of extrapolated; if the two polarizations show the same gap-onset temperature, or if the c-axis gap opens below 240 K, the anisotropic two-step scenario fails.
Extended reading notes
Core claim
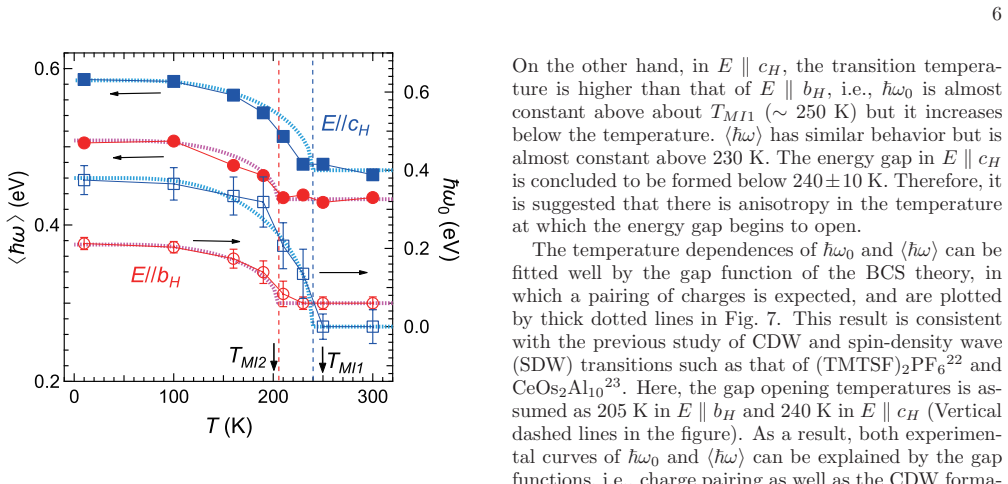
The central discovery is that the metal-insulator transition in RuAs is not a single isotropic event: the polarized optical conductivity shows that the charge gap opens at about 240 ± 10 K along the c axis but only below about 205 K along the b axis, approximately matching the two structural transition temperatures T_MI1 (~250 K) and T_MI2 (~200 K). The lowest Lorentz oscillator peak and the spectral center of gravity track a BCS-like gap function with these two opening temperatures, and the resulting 2Δ/k_B T_c of about 19 rules out a simple Peierls picture. The authors attribute the two-step transition to successive charge orderings along the two directions, consistent with the 3×3×3 superlattice that contains different charge periodicities along c and b.
Load-bearing premise
The central assumption is that the fitted lowest Lorentz peak energy and the spectrum's center of gravity are faithful measures of the true energy gap, so their temperature-dependent rise marks when each gap actually opens.
Editorial extensions
If this is right
- If the claim is right, the two-step MIT in RuAs is a sequence of two direction-specific charge-ordering transitions, with the c-axis ordering setting in at T_MI1 and the b-axis ordering at T_MI2.
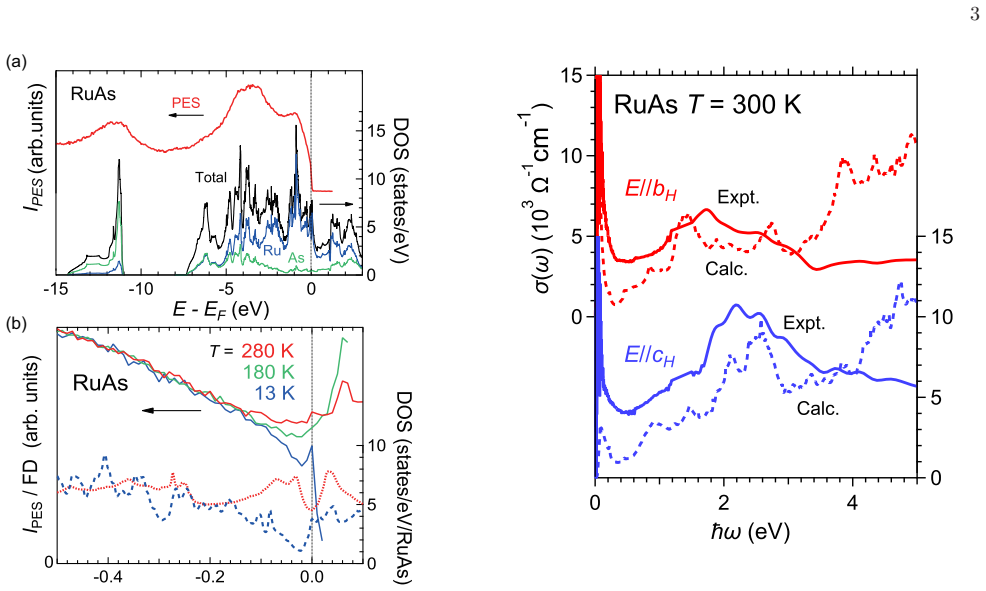
- The success of LDA in reproducing the high- and low-temperature optical and photoemission spectra indicates that the gap formation is a band-structure effect, such as superlattice folding, rather than a correlation-driven Mott-like mechanism.
- The large 2Δ/k_B T_c ≈ 19 ratio shows the gap is not purely Peierls-like, so charge ordering or charge pairing must contribute, and the same logic should be tested in the isostructural compound RuP.
- Temperature-dependent Drude weight and photoelectron intensity near the Fermi level both decrease through the transition, directly linking the gap opening to the observed rise in electrical resistivity.
Reading between the lines
- A natural testable extension is to perform the same polarized optical conductivity measurement on detwinned crystals of RuP; if the gap-opening temperatures do not show a similar directional hierarchy, the two-step transitions in RuAs and RuP may have different microscopic origins.
- The proposed scenario implies that only the c-axis charge order exists in the incommensurate middle phase, so resonant X-ray scattering at the Ru L-edge could look for that partial ordering and its incommensurate modulation.
- Because the gap-opening temperatures are read through a BCS-type mean-field fit, a simultaneous resistivity and optics measurement on the same sample could check whether the extracted onset temperatures coincide with the thermodynamic first-order transitions.
Signed reviews
Editorial analysis
A structured set of objections, weighed in public.
Referee Report
Summary. The manuscript reports polarized optical conductivity, angle-integrated photoemission, and LDA band-structure calculations for RuAs, which undergoes a two-step metal-to-insulator transition at approximately 250 K (T_MI1) and 200 K (T_MI2). The authors show that the high-temperature and low-temperature electronic structures can be largely explained by LDA-based interband calculations without invoking strong electron correlations. The central new claim is that the energy gap opens anisotropically: along the c axis the gap starts to open near T_MI1, while along the b axis it opens only below T_MI2. This claim is drawn from temperature-dependent Drude-Lorentz fits to the optical conductivity and from the temperature-dependent center of gravity of the spectra, and it is used to propose that the two-step transition originates from two direction-dependent charge-ordering events.
Significance. If the anisotropic gap-opening claim is correct, the result is significant because it provides direct electronic-structure evidence that the two-step MIT in RuAs arises from anisotropic charge ordering, and it connects the optical response to the independently characterized structural transitions. The paper also contains a genuinely useful consistency check: the polarized optical conductivity and photoemission spectra in the HT and LT phases are compared with LDA calculations and show good mutual agreement, which is a strength. The temperature-dependent PE intensity near E_F and the decreasing Drude weight are consistent with carrier depletion across the transition. However, the central claim about different gap-opening temperatures rests on a fitting procedure for which no uncertainties, model comparisons, or robustness checks are reported, and this is the main weakness of the manuscript.
major comments (3)
- [Section III.C, Fig. 7] The central claim that the c-axis gap opens near 240 K and the b-axis gap near 205 K is inferred from the temperature dependence of the lowest Lorentz peak energy (ħω0) and the 0–1.2 eV center of gravity (⟨ħω⟩). These quantities are extracted from a least-squares decomposition into one Drude and either three or two Lorentz oscillators, with the number of oscillators chosen “because of spectral shapes.” No uncertainties on the fitted parameters, no residual analysis, and no alternative model comparisons are provided. Because the Drude term has strong low-energy spectral weight, temperature-dependent Drude damping or spectral weight can shift the apparent position and centroid of the neighboring Lorentzian even if the underlying interband edge is unchanged. The manuscript therefore does not rule out that the reported onsets are fitting-parameter trade-offs rather than genuine gap-opening temperatures. I request a robustness analysis: for example, fits with different oscillator counts, fits in which Drude parameters are constrained by DC conductivity, and confidence intervals on ħω0 and ⟨ħω⟩.
- [Section II, Kramers-Kronig extrapolation] The optical conductivity is obtained by Kramers-Kronig analysis with the reflectivity extrapolated below 15 meV using a Hagen-Rubens form at T ≥ 210 K and a constant at T ≤ 190 K. The authors state that this extrapolation does not affect the spectra around 100 meV “so much,” but no quantitative estimate is given. This matters for the central claim because the center of gravity ⟨ħω⟩ integrates the conductivity down to zero energy, and the fitted Lorentz peak energies of 0.2–0.4 eV are not far above the extrapolated region. A quantitative test of how the extracted onsets and peak energies change under alternative low-energy extrapolations is needed, as is ideally measurement to lower photon energies.
- [Section III.C, BCS fit and error bars] The BCS gap functions shown in Fig. 7 are computed using assumed transition temperatures of 205 K (E ‖ bH) and 240 K (E ‖ cH), so the statement that the temperature dependence is “explained by the gap functions” is partly built into the fit and does not independently determine or validate the onset temperatures. Moreover, the data points in Fig. 7 are shown without error bars, and the assertion that ħω0 and ⟨ħω⟩ are “almost constant” above the transition and then rise below is not accompanied by any statistical test. Please report uncertainties on the extracted peak energies and centroids, and, if a BCS-like fit is used, either treat the transition temperature as a free parameter with an uncertainty or clearly label the curves as a guide based on independent resistivity/structural data.
minor comments (4)
- [Section III.C] There is a typographical error in “To clarify the above inferencethe σ(ω) spectra have been fitted”; “inferencethe” should be “inference, the.”
- [Section I / Section III.C] The value 2Δ/k_B T_c ∼ 19 is presented without specifying which measured gap (b-axis or c-axis) and which transition temperature were used to compute it. The definition should be stated explicitly because the ratio is used to argue against a Peierls-like transition.
- [Fig. 7] The quantity ⟨ħω⟩, called the center of gravity of the σ(ω) spectra, is not defined in the text or figure caption. Please state the definition, including the integration range and whether the Drude contribution is included.
- [Fig. 4 and surrounding text] The comparison of measured σ(ω) with calculated interband-only spectra is informative, but the caption of Fig. 4 does not state explicitly that the calculated curves contain no Drude contribution. Adding this clarification would prevent a misleading visual comparison.
Circularity Check
No significant circularity: the anisotropic gap-opening temperatures are extracted from measured optical spectra and cross-checked against parameter-free LDA calculations.
full rationale
The central claim—that the energy gap along the c axis opens near T_MI1 (~250 K) while the b-axis gap opens below T_MI2 (~200 K)—is inferred from temperature-dependent polarized optical conductivity spectra. The onset temperatures are read from the measured temperature evolution of the lowest-energy Lorentz peak energy and the spectral centroid in Fig. 7, not from a fitted parameter that was defined in terms of the claimed conclusion. The BCS curves in Fig. 7 are explicitly plotted using assumed gap-opening temperatures of 205 K and 240 K; the text states these are 'assumed,' so the BCS overlay is a parameterized consistency check, not a prediction that generates the onset temperatures. The LDA band-structure calculations are parameter-free electronic-structure calculations using lattice parameters from a prior experimental structure determination (Ref. 10); agreement with the PE and sigma(omega) spectra is an external comparison, not an input recycled into the conclusion. The main weaknesses—the ambiguous choice of the number of Lorentz oscillators, unreported fit uncertainties, and the Kramers-Kronig extrapolation below 15 meV—are correctness or robustness concerns, not circularity. No step in the derivation reduces by construction to its own input, and no load-bearing uniqueness claim is imported from a self-citation. The paper's central observation is therefore self-contained with respect to circularity.
Assumptions & free parameters
free parameters (2)
- BCS gap-opening temperatures =
205 K for E||bH, 240 K for E||cH
- Number of Lorentz oscillators in the Drude-Lorentz fit =
3 for E||bH, 2 for E||cH
assumptions (5)
- domain assumption LDA band structure calculations using lattice parameters from Ref. 10 adequately describe the measured electronic structure in the HT and LT phases.
- domain assumption Kramers-Kronig analysis with the stated low-energy extrapolations does not significantly affect the optical conductivity spectra around 0.1-0.4 eV.
- domain assumption The Drude-Lorentz decomposition is an appropriate model for the optical conductivity and that the lowest Lorentz oscillator tracks the charge gap.
- domain assumption The BCS temperature dependence of the gap applies to the anisotropic charge-gap opening in this material.
- domain assumption Surface metallic states mask the bulk gap in photoemission, so the small PE intensity change near E_F does not contradict the insulating bulk.
Cite this review
Pith. "Pith review of Optical and photoelectrical studies on anisotropic metal-insulator transition of RuAs." pith.science (2026). https://pith.science/paper/524SOCC4
@misc{pith2026190803312,
  author       = {Pith},
  title        = {Pith review of: Optical and photoelectrical studies on anisotropic metal-insulator transition of RuAs},
  year         = {2026},
  howpublished = {\url{https://pith.science/paper/524SOCC4}},
  note         = {Machine review of arXiv:1908.03312}
}
abstract
The anisotropic changes in the electronic structure of a metal-to-insulator transition (MIT) material, RuAs, with two-step phase transition are reported by using polarized optical conductivity [$\sigma(\omega)$] spectra, angle-integrated photoelectron (PE) spectra, and band calculations based on local density approximation (LDA). Both the PE and $\sigma(\omega)$ spectra not only in the high-temperature (HT) phase but also in the low-temperature (LT) phase as well as the energy gap formation owing to the MIT were almost consistent with those derived from the LDA band calculations, so the fundamental electronic structure in the HT and LT phases can be explained without electron correlations. However, the electronic structure in the middle phase between the HT and LT phases has not been clarified. The polarized $\sigma(\omega)$ spectra revealed not only the anisotropic energy gap formation but also the anisotropic gap-opening temperature, i.e., the energy gap along the $c$ axis in the HT phase starts to open near the higher transition temperature, but that along the $b$ axis opens below the lower transition temperature. The finding suggests that the two-step MIT originates from the anisotropic energy gap formation.
Figures

Figures from the paper (2 more)
Reference graph
Works this paper leans on
-
[1]
Y. Kamihara, T. Watanabe, M. Hirano, and H. Hosono, J. Am. Chem. Soc. 130 , 3296 (2008)
work page 2008
- [2]
- [3]
-
[4]
B. Saparov, J. E. Mitchell, and A. S. Sefat, Supercond. Sci. Technol. 25 , 084016 (2012)
work page 2012
- [5]
-
[6]
R. Y. Chen, Y. G. Shi, P. Zheng, L. Wang, T. Dong, and N. L. Wang, Phys. Rev. B 91 , 125101 (2015)
work page 2015
-
[7]
K. Sato, D. Ootsuki, Y. Wakisaka, N. L. Saini, T. Mizokawa, M. Arita, H. Anzai, H. Namatame, M. Taniguchi, D. Hirai, and H. Takagi, arXiv: 1205.2669 (2012)
work page Pith review arXiv 2012
- [8]
Show all 23 references
-
[9]
S. Li, Y. Kobayashi, M. Itoh, D. Hirai, and H. Takagi, Phys. Rev. B 95 , 155137 (2017)
2017
-
[10]
Kotegawa, K
H. Kotegawa, K. Takeda, Y. Kuwata, J. Hayashi, H. Tou, H. Sugawara, T. Sakurai, H. Ohta, and H. Harima, Phys. Rev. Mater. 2 , 055001 (2018)
2018
-
[11]
H. Goto, T. Toriyama, T. Konishi, and Y. Ohta, Physics Procedia 75 , 91, (2015)
2015
-
[12]
Kimura and H
S. Kimura and H. Okamura, J. Phys. Soc. Jpn. 82 , 021004 (2013)
2013
-
[13]
Kimura, JASCO Report 50 , 6 (2008)
S. Kimura, JASCO Report 50 , 6 (2008). [in Japanese]
2008
-
[14]
Kimura, H
S. Kimura, H. Yokoyama, H. Watanabe, J. Sichelschmidt, V. S\"u , M. Schmidt, and C. Felser, Phys. Rev. B 96 , 075119 (2017)
2017
-
[15]
Kimura, Y
S. Kimura, Y. Sakurai, E. Nakamura, and T. Mizuno, AIP Conf. Proc. 879 , 595 (2007)
2007
-
[16]
Dressel and G
M. Dressel and G. Gr\"uner, Electrodynamics of Solids (Cambridge University Press, Cambridge, UK, 2002)
2002
-
[17]
Kimura, T
S. Kimura, T. Ito, M. Sakai, E. Nakamura, N. Kondo, T. Horigome, K. Hayashi, M. Hosaka, M. Katoh, T. Goto, T. Ejima, and K. Soda, Rev. Sci. Instrum. 81 , 053104 (2010)
2010
-
[18]
Blaha, K
P. Blaha, K. Schwarz, P. Sorantin, and S. B. Trickey, Comput. Phys. Commun. 59 , 399 (1990)
1990
-
[19]
A. C. Hewson, The Kondo Problem to Heavy Fermions (Cambridge University Press, Cambridge, 1993)
1993
-
[20]
Gr\"uner, Density Waves in Solids (Perseus Publishing, Cambridge, 1994)
G. Gr\"uner, Density Waves in Solids (Perseus Publishing, Cambridge, 1994)
1994
-
[21]
Wooten, Optical Properties of Solids (Academic Press, New York, 1972)
F. Wooten, Optical Properties of Solids (Academic Press, New York, 1972)
1972
-
[22]
Dressel, L
M. Dressel, L. Degiorgi, J. Brinckmann, A. Schwartz, and G. Gr\"uner, Physica (Amsterdam) 230–232B , 1008 (1997)
1997
-
[23]
Kimura, T
S. Kimura, T. Iizuka, H. Miyazaki, A. Irizawa, Y. Muro, and T. Takabatake, Phys. Rev. Lett. 106 , 056404 (2011)
2011
Reviewed August 14, 2026 · model on record in the stance chip above.
Discussion (0). Continue with ORCID to comment.