REVIEW 3 major objections 7 minor 63 references
Reconstructing commuters network using machine learning and urban indicators
T0 review · 3 major / 7 minor · reviewed 2026-08-14 · deepseek-v4-flash
Pith's one-line read Supervised machine learning on urban indicators can reconstruct Brazil's intercity commuting network, with 90.4% accuracy on link existence and 77.6% of flow variance explained.
desk verdict The headline accuracy and R² are computed on a balanced sample, so the network-reconstruction claim is not supported; the paper is worth a revision, not a desk reject. read the letter →
The pith
A machine-rendered reading of the paper's core claim, the machinery that carries it, and where it could break.
The reading
What carries the argument
The central object is a per-pair feature vector $S_{st}=\{r_{st}, m_s, n_t, U_s, U_t\}$ built from the distance, both city populations, and the 22 urban indicators of source and target city, giving 45 features per ordered pair of cities. Gradient-boosted decision trees map that vector to a binary link label and to a commuter count; the training set is balanced to one real link per one invented non-link, and Shapley-value attribution, a game-theoretic measure of each feature's marginal contribution, ranks the drivers that carry the predictions.
What would settle it
Train and test the same procedure on a random sample of all ordered city pairs, not just the balanced subset, and compute precision, recall, and the coefficient of determination on the full set of 55,247 actual flows; if accuracy falls to the trivial no-link baseline or the variance explained drops far below 77.6%, the central reconstruction claim is not established.
Extended reading notes
Core claim
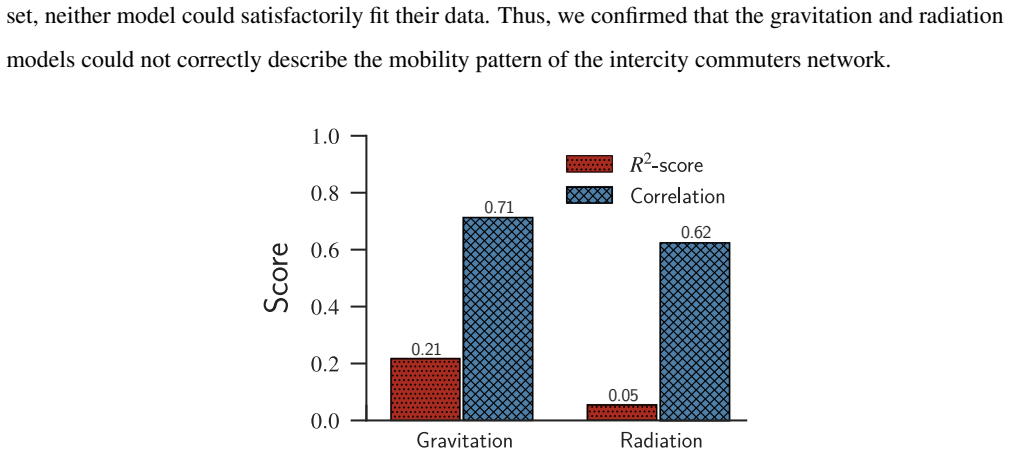
The paper claims that a supervised machine-learning pipeline, given the distance between two cities, their populations, and 22 urban indicators for each, can decide whether a commuting link exists and how many people use it; on the 2010 Brazilian network of 5,565 cities and 55,247 non-zero flows, it reports 90.4% classification accuracy and 77.6% of flow variance explained, against under 25% variance explained by gravity and radiation models. It further claims, through game-theoretic feature attribution, that distance is the strongest predictor but that target-city GDP, area, traffic accidents, elderly population, and unemployment also shape commuting.
Load-bearing premise
The headline numbers come from an artificially balanced sample that is half real commuting pairs and half randomly invented pairs, so they do not by themselves tell how the model performs on the true network, where fewer than two in a thousand city pairs have commuters.
Editorial extensions
If this is right
- City-to-city commuter flows can be estimated from routinely collected statistics, reducing reliance on costly origin-destination surveys.
- Gravity and radiation models are not sufficient for network reconstruction because they predict a fully connected network, whereas the supervised classifier provides a way to predict non-links as well as links.
- A small set of indicators, including distance, GDP, area, traffic accidents, elderly population, and unemployment, carries most of the predictive signal, so a feasible data-collection effort could reproduce the approach.
- Because the method learns from node attributes rather than network topology, it applies to other networks where attributes are available but links are unknown, such as trade, social, or metabolic networks.
- Interpreting the models with game-theoretic feature attribution converts black-box predictions into named drivers of commuting, offering testable hypotheses about why people move.
Reading between the lines
- Editorial inference: the reported 90.4% accuracy and 77.6% R-squared describe performance on a half-real, half-invented dataset; on the true sparse network, accuracy would be dominated by the trivial 'no link' prediction unless precision and recall are reported.
- Editorial inference: the same training recipe could be applied to other countries or years, and the feature-attribution ranking could show whether distance and GDP remain the dominant drivers or whether the result is specific to Brazil in 2010.
- Editorial inference: the paper's method requires only node attributes, so it suggests a possible shortcut for reconstructing networks where link data is missing but attribute data exists; the authors hint at this transfer but do not demonstrate it.
Signed reviews
Editorial analysis
A structured set of objections, weighed in public.
Referee Report
Summary. The paper proposes a supervised machine-learning approach—XGBoost classification and regression—to reconstruct the directed Brazilian intercity commuter network from distance, population sizes, and 22 urban indicators. It reports 90.4% accuracy for predicting the existence of a commuting link and 77.6% R² for predicting the number of commuters, compares these results with gravity and radiation models, and uses SHAP values to identify important features. The reported metrics are computed on a class-balanced sample of 110,494 city pairs (50% real links, 50% fabricated non-links matched by state pair), not on the full space of directed city pairs, and no full-network precision, recall, F1, or regression metrics are reported.
Significance. If the claimed levels of accuracy and explained variance held on the full network, this would be a valuable applied contribution to mobility modeling, in particular the systematic benchmarking of 27 classifiers and 23 regressors and the SHAP-based feature analysis. However, the headline numbers are computed on an artificial distribution with 50% link prevalence, whereas the true network has 0.178% density; the central claim that the model 'reconstructs the commuters network' with 90.4% accuracy is therefore not established by the reported evaluation. The appropriate evidence—precision/recall on the full pair space and commensurable regression benchmarks—is missing.
major comments (3)
- [Methods – Class balancing; Results – Fig. 3C] The 90.4% accuracy is measured on a test set with 50% true links and 50% randomly chosen non-links matched by state pair, not on the true 0.178%-dense network (55,247 directed edges among 5,565 x 5,564 = 30,963,660 possible ordered pairs). Applying the confusion matrix in Fig. 3C (90% true-positive rate, 91% true-negative rate) to the full network would yield about 49,700 true positives and about 2.78 million false positives, i.e., precision of roughly 1.8%, so almost every predicted link would be spurious. Accuracy on the full network would be about 91%, while the trivial always-negative classifier would obtain 99.8% accuracy; accuracy therefore cannot support the abstract's reconstruction claim. The authors should report full-network precision, recall, F1, and precision-recall curves, or clearly reframe the task as link prediction on a balanced sample rather than network reconstruction.
- [Results – State-of-the-art models and Reconstructing the weighted commuters network; Fig. 2 and Fig. 4C] The comparison between the proposed regressor and the gravity/radiation baselines is not apples-to-apples: the baselines are fitted and evaluated only on the existing non-zero flows (as stated in the paragraph after Eq. 2), whereas the XGBoost regressor's R² = 77.6% is computed on the balanced test set in which half of the rows are zero-flow non-links. R² values computed on these two different outcome distributions are not comparable, so the claim that the machine-learning model describes 77.6% of the variance and outperforms the baselines is not supported. The authors should report R², MAE, and RMSE for all methods on the same set of pairs—ideally both on all directed pairs and on existing edges only—and should also report error metrics for the zero/non-zero distinction.
- [Interpreting machine learning models using SHAP; Discussion] SHAP values describe the fitted model's decision mechanism; they are not estimates of causal effects. The abstract's statement that GDP and unemployment rate are 'driven-forces for people to commute' and the Discussion's attract/repel language go beyond what the evidence can support. Since the SHAP analysis is performed on the balanced sample, the feature rankings may also reflect the artificial sampling scheme rather than the true predictive relationship in the full network. I recommend rephrasing these results as 'features the learned model relies on' and, if causal claims are intended, adding a separate identification strategy.
minor comments (7)
- [Results – Reconstructing the weighted commuters network] The text says 'Fig. 5C compares the predictions...' but this should refer to Fig. 4C, not Fig. 5C.
- [Acknowledgments] The phrase 'Fundaçõ de Amparo' should read 'Fundação de Amparo'.
- [Reference 4] The title 'Modeling the polycentric pransition of cities' contains a typo; it should be 'polycentric transition'.
- [Discussion] The word 'Theelderly population indicator' is missing a space and should be 'The elderly population indicator'.
- [Methods – Feature selection] The phrase 'decreasing the number of dependable variables' should read 'decreasing the number of dependent variables'.
- [Methods – Model evaluation] The definition of 'balanced accuracy score' as 'the ratio between the correct classified instances and all instances' is inconsistent with the confusion-matrix accuracy reported in Fig. 3C; please clarify whether the reported 90.4% is ordinary accuracy or a class-balanced metric.
- [Throughout] The terms 'gravitation model' and 'gravity model' are used interchangeably; please choose one term for consistency.
Circularity Check
No significant circularity: the central predictive claims rest on held-out test evaluation, and the cited prior work is not load-bearing.
full rationale
The paper's derivation chain is not circular. The classification and regression tasks use features Sst = {rst, ms, nt, Us, Ut} plus 22 urban indicators per city, and the target labels and weights come from external IBGE commuting data. The Methods describe a 70/30 holdout split, with the test set used only after model selection, feature selection, and hyperparameter tuning; the reported 90.4% accuracy and 77.6% R-squared are therefore computed on held-out city pairs, not on fitted training values or on quantities derived from the target by construction. The gravity and radiation comparisons are fitted on the same external data, so the ML comparison is an independent empirical benchmark rather than an imported result. SHAP values are explicitly interpretations of the already-fitted XGBoost models, and the paper does not present them as an independent derivation of causal drivers; that is a limitation of interpretation, not circularity. The paper's self-citations, such as urban scaling and street-network work by the authors, are background context and are not used to justify the central prediction claims. The balanced-sample evaluation issue identified by the skeptic concerns external validity, because the 50/50 class-balanced test set does not represent the 0.178%-dense true network and no full-network precision, recall, or R-squared is reported; however, that is an evaluation-validity problem, not a circularity problem, since the reported numbers are not equivalent by construction to the training inputs or to any fitted parameter. No step in the claimed derivation reduces to its own input, so the circularity score is 0.
Assumptions & free parameters
free parameters (4)
- Class balance ratio =
0.5 (50% positive, 50% negative)
- XGBoost classifier hyperparameters =
lr=0.05, n_estimators=300, max_depth=9, subsample=0.85, colsample_bytree=0.8, reg_lambda=0.75
- XGBoost regressor hyperparameters =
lr=0.05, n_estimators=900, max_depth=7, subsample=0.85, reg_lambda=1.25, gamma=0.25, min_child_weight=2
- Feature selection threshold =
dynamic, set where model score starts decreasing
assumptions (3)
- domain assumption IBGE 2010 census data correctly measures daily intercity commuter flows and all 22 urban indicators for every Brazilian municipality.
- domain assumption The 22 city-level indicators plus distance and population contain enough signal to predict intercity flows.
- standard math Standard statistical and ML evaluation conventions (R², balanced accuracy, Shapley values) are accepted as valid measures of predictive performance.
Cite this review
Pith. "Pith review of Reconstructing commuters network using machine learning and urban indicators." pith.science (2026). https://pith.science/paper/YFIKTEY5
@misc{pith2026190803512,
  author       = {Pith},
  title        = {Pith review of: Reconstructing commuters network using machine learning and urban indicators},
  year         = {2026},
  howpublished = {\url{https://pith.science/paper/YFIKTEY5}},
  note         = {Machine review of arXiv:1908.03512}
}
read the original abstract
Human mobility has a significant impact on several layers of society, from infrastructural planning and economics to the spread of diseases and crime. Representing the system as a complex network, in which nodes are assigned to regions (e.g., a city) and links indicate the flow of people between two of them, physics-inspired models have been proposed to quantify the number of people migrating from one city to the other. Despite the advances made by these models, our ability to predict the number of commuters and reconstruct mobility networks remains limited. Here, we propose an alternative approach using machine learning and 22 urban indicators to predict the flow of people and reconstruct the intercity commuters network. Our results reveal that predictions based on machine learning algorithms and urban indicators can reconstruct the commuters network with 90.4% of accuracy and describe 77.6% of the variance observed in the flow of people between cities. We also identify essential features to recover the network structure and the urban indicators mostly related to commuting patterns. As previously reported, distance plays a significant role in commuting, but other indicators, such as Gross Domestic Product (GDP) and unemployment rate, are also driven-forces for people to commute. We believe that our results shed new lights on the modeling of migration and reinforce the role of urban indicators on commuting patterns. Also, because link-prediction and network reconstruction are still open challenges in network science, our results have implications in other areas, like economics, social sciences, and biology, where node attributes can give us information about the existence of links connecting entities in the network.
Figures


Figures from the paper (2 more)


Reference graph
Works this paper leans on
-
[1]
Barbosa, H. et al. Human mobility: Models and applications. Phys. Reports 734, 1 – 74, DOI: 10.1016/j.physrep.2018.01.001 (2018)
-
[2]
Ullman, E. L. Geography as spatial interaction (University of Washington Press, 1980). 22/28
work page 1980
-
[3]
Bettencourt, L. M. A., Lobo, J., Strumsky, D. & West, G. B. Urban scaling and its deviations: Revealing the structure of wealth, innovation and crime across cities. PLOS ONE 5, 1–9, DOI: 10.1371/journal.pone.0013541 (2010)
-
[4]
Louf, R. & Barthelemy, M. Modeling the polycentric pransition of cities. Phys. Rev. Lett. 111, 198702, DOI: 10.1103/PhysRevLett.111.198702 (2013)
-
[5]
Trenchard, H. & Perc, M. Energy saving mechanisms, collective behavior and the variation range hypothesis in biological systems: A review. Biosystems 147, 40 – 66, DOI: 10.1016/j.biosystems. 2016.05.010 (2016)
-
[6]
Helbing, D. et al. Saving human lives: What complexity science and information systems can contribute. J. Stat. Phys. 158, 735–781, DOI: 10.1007/s10955-014-1024-9 (2015)
-
[7]
Eubank, S. et al. Modelling disease outbreaks in realistic urban social networks. Nature 429, 180, DOI: 10.1038/nature02541 (2004)
-
[8]
Colizza, V ., Barrat, A., Barthélemy, M. & Vespignani, A. The role of the airline transportation network in the prediction and predictability of global epidemics. Proc. Natl. Acad. Sci. 103, 2015–2020, DOI: 10.1073/pnas.0510525103 (2006)
Show all 63 references
-
[9]
Balcan, D. et al. Multiscale mobility networks and the spatial spreading of infectious diseases. Proc. Natl. Acad. Sci. 106, 21484–21489, DOI: 10.1073/pnas.0906910106 (2009)
2009 doi
-
[11]
Caminha, C. et al. Human mobility in large cities as a proxy for crime. PLOS ONE 12, 1–13, DOI: 10.1371/journal.pone.0171609 (2017)
2017 doi
-
[12]
Spadon, G. et al. Behavioral characterization of criminality spread in cities. vol. 108, 2537 – 2541, DOI: https://doi.org/10.1016/j.procs.2017.05.118 (2017). International Conference on Computational Science, ICCS 2017, 12-14 June 2017, Zurich, Switzerland
2017 doi
-
[13]
Zipf, G. K. The P1P2/D hypothesis: on the intercity movement of persons. Am. Sociol. Rev. 11, 677–686, DOI: 10.2307/2087063 (1946)
1946 doi
-
[14]
& Stanley, H
Jung, W.-S., Wang, F. & Stanley, H. E. Gravity model in the Korean highway.EPL (Europhysics Lett. 81, 48005, DOI: 10.1209/0295-5075/81/48005 (2008). 23/28
2008 doi
-
[15]
C., Maritan, A
Simini, F., González, M. C., Maritan, A. & Barabási, A.-L. A universal model for mobility and migration patterns. Nature 484, 96, DOI: 10.1038/nature10856 (2012)
2012 doi
-
[16]
P., Serras, J., Johansson, A
Masucci, A. P., Serras, J., Johansson, A. & Batty, M. Gravity versus radiation models: On the importance of scale and heterogeneity in commuting flows. Phys. Rev. E 88, 022812, DOI: 10.1103/ PhysRevE.88.022812 (2013)
2013
-
[17]
Ren, Y ., Ercsey-Ravasz, M., Wang, P., González, M. C. & Toroczkai, Z. Predicting commuter flows in spatial networks using a radiation model based on temporal ranges. Nat. Commun. 5, 5347, DOI: 10.1038/ncomms6347 (2014)
2014 doi
-
[18]
Ravenstein, E. G. The laws of migration. J. Stat. Soc. Lond. 48, 167–235, DOI: 10.2307/2979181 (1885)
-
[19]
Stouffer, S. A. Intervening opportunities: A theory relating mobility and distance. Am. Sociol. Rev. 5, 845–867, DOI: 10.2307/2084520 (1940)
1940 doi
-
[20]
Louail, T. et al. Uncovering the spatial structure of mobility networks. Nat. Commun. 6, 6007, DOI: 10.1038/ncomms7007 (2015)
2015 doi
-
[21]
& Zhou, T
Lü, L. & Zhou, T. Link prediction in complex networks: A survey. Phys. A: Stat. Mech. its Appl. 390, 1150 – 1170, DOI: https://doi.org/10.1016/j.physa.2010.11.027 (2011)
2011 doi
-
[22]
Newman, M. E. Clustering and preferential attachment in growing networks. Phys. Rev. E 64, 025102, DOI: 10.1103/PhysRevE.64.025102 (2001)
2001 doi
-
[23]
Effects of missing data in social networks
Kossinets, G. Effects of missing data in social networks. Soc. Networks 28, 247–268, DOI: 10.1016/j. socnet.2005.07.002 (2006)
2006 doi
-
[24]
& Widom, J
Jeh, G. & Widom, J. Simrank: A measure of structural-context similarity. In Proceedings of the Eighth Acm Sigkdd International Conference on Knowledge Discovery and Data Mining, 538–543, DOI: 10.1145/775047.775126 (ACM, 2002)
2002
-
[25]
Fu, C. et al. Link weight prediction using supervised learning methods and its application to yelp layered network. IEEE Transactions on Knowl. Data Eng. 30, 1507–1518, DOI: 10.1109/TKDE. 2018.2801854 (2018)
2018
-
[26]
& Newman, M
Clauset, A., Moore, C. & Newman, M. E. Hierarchical structure and the prediction of missing links in networks. Nature 453, 98, DOI: 10.1038/nature06830 (2008). 24/28
2008 doi
-
[27]
& Garlaschelli, D
Mastrandrea, R., Squartini, T., Fagiolo, G. & Garlaschelli, D. Enhanced reconstruction of weighted networks from strengths and degrees.New J. Phys. 16, 043022, DOI: 10.1088/1367-2630/16/4/043022 (2014)
2014 doi
-
[28]
& Garlaschelli, D
Squartini, T., Mastrandrea, R. & Garlaschelli, D. Unbiased sampling of network ensembles. New J. Phys. 17, 023052, DOI: 10.1088/1367-2630/17/2/023052 (2015)
2015 doi
-
[29]
& Sales-Pardo, M
Guimerà, R. & Sales-Pardo, M. Missing and spurious interactions and the reconstruction of complex networks. Proc. Natl. Acad. Sci. 106, 22073–22078, DOI: 10.1073/pnas.0908366106 (2009)
2009 doi
-
[30]
Peixoto, T. P. Reconstructing networks with unknown and heterogeneous errors. Phys. Rev. X 8, 041011, DOI: 10.1103/PhysRevX.8.041011 (2018)
2018 doi
-
[31]
& Barabasi, A.-L
Wang, D., Pedreschi, D., Song, C., Giannotti, F. & Barabasi, A.-L. Human mobility, social ties, and link prediction. In Proceedings of the 17th ACM SIGKDD International Conference on Knowledge Discovery and Data Mining, KDD ’11, 1100–1108, DOI: 10.1145/2020408.2020581 (ACM, Ne...
-
[32]
Xuan, Q. et al. Modern food foraging patterns: Geography and cuisine choices of restaurant patrons on yelp. IEEE Transactions on Comput. Soc. Syst. 5, 508–517 (2018)
2018
-
[33]
& Filkov, V
Xuan, Q., Okano, A., Devanbu, P. & Filkov, V . Focus-shifting patterns of oss developers and their congruence with call graphs. In Proceedings of the 22Nd ACM SIGSOFT International Symposium on Foundations of Software Engineering, FSE 2014, 401–412, DOI: 10.1145/2635868.263591...
2014
-
[34]
A., Havlin, S
Makse, H. A., Havlin, S. & Stanley, H. E. Modelling urban growth patterns. Nature 377, 608, DOI: 10.1038/377608a0 (1995)
1995 doi
-
[35]
& Brockmann, D
Thiemann, C., Theis, F., Grady, D., Brune, R. & Brockmann, D. The structure of borders in a small world. PLOS ONE 5, 1–7, DOI: 10.1371/journal.pone.0015422 (2010)
2010 doi
-
[36]
M., Batty, M
Roth, C., Kang, S. M., Batty, M. & Barthélemy, M. Structure of urban movements: Polycentric activity and entangled hierarchical flows. PLOS ONE 6, 1–8, DOI: 10.1371/journal.pone.0015923 (2011)
2011 doi
-
[37]
Spatial networks
Barthélemy, M. Spatial networks. Phys. Reports 499, 1 – 101, DOI: 10.1016/j.physrep.2010.11.002 (2011). 25/28
2011 doi
-
[38]
& Amaral, L
Guimerà, R., Mossa, S., Turtschi, A. & Amaral, L. A. N. The worldwide air transportation network: Anomalous centrality, community structure, and cities global roles. Proc. Natl. Acad. Sci. 102, 7794–7799, DOI: 10.1073/pnas.0407994102 (2005)
2005 doi
-
[39]
H., Ffrancon, R., Abrams, D
Lee, S. H., Ffrancon, R., Abrams, D. M., Kim, B. J. & Porter, M. A. Matchmaker, matchmaker, make me a match: Migration of populations via marriages in the past. Phys. Rev. X 4, 041009, DOI: 10.1103/PhysRevX.4.041009 (2014)
2014 doi
-
[40]
Alves, L. G. A., Mendes, R. S., Lenzi, E. K. & Ribeiro, H. V . Scale-adjusted metrics for predicting the evolution of urban indicators and quantifying the performance of cities. PLOS ONE 10, 1–17, DOI: 10.1371/journal.pone.0134862 (2015)
2015 doi
-
[41]
S., Silva, F
Domingues, G. S., Silva, F. N., Comin, C. H. & da F Costa, L. Topological characterization of world cities. J. Stat. Mech. Theory Exp. 2018, 083212, DOI: 10.1088/1742-5468/aad365 (2018)
2018 doi
-
[42]
& Rodrigues, J
Spadon, G., Gimenes, G. & Rodrigues, J. F. Topological street-network characterization through feature-vector and cluster analysis. In International Conference on Computational Science, 274–287, DOI: 10.1007/978-3-319-93698-7_21 (Springer, 2018)
-
[43]
Alves, L. G. A., Ribeiro, H. V ., Lenzi, E. K. & Mendes, R. S. Distance to the scaling law: A useful approach for unveiling relationships between crime and urban metrics. PLOS ONE 8, 1–8, DOI: 10.1371/journal.pone.0069580 (2013)
2013 doi
-
[44]
Lundberg, S. M. & Lee, S.-I. A unified approach to interpreting model predictions. In Proceedings of the 31st International Conference on Neural Information Processing Systems, NIPS’17, 4768–4777 (Curran Associates Inc., USA, 2017)
2017
-
[45]
Moura, D. C. 3D Density Histograms for Criteria-driven Edge Bundling. ArXiv:1504.0268 (2015)
2015
-
[46]
Accessed: 2017-09-01
Brazilian Institute of Geography and Statistics (IBGE) (2017). Accessed: 2017-09-01
2017
-
[47]
Shaping the world economy: Suggestions for an international economic policy
Leibenstein, H. Shaping the world economy: Suggestions for an international economic policy. The Econ. J. 76, 92–95, DOI: 10.2307/2229041 (1966)
1966 doi
-
[48]
& Rubinstein, Y
Helpman, E., Melitz, M. & Rubinstein, Y . Estimating trade flows: Trading partners and trading volumes. The Q. J. Econ. 123, 441–487, DOI: 10.3386/w12927 (2008)
2008 doi
-
[49]
Kaluza, P., Kölzsch, A., Gastner, M. T. & Blasius, B. The complex network of global cargo ship movements. J. The Royal Soc. Interface 7, 1093–1103, DOI: 10.1098/rsif.2009.0495 (2010). 26/28
2010
-
[50]
S., Blondel, V
Expert, P., Evans, T. S., Blondel, V . D. & Lambiotte, R. Uncovering space-independent communities in spatial networks. Proc. Natl. Acad. Sci. 108, 7663–7668, DOI: 10.1073/pnas.1018962108 (2011)
2011 doi
-
[51]
Principles and procedures of statistics, with special reference to the biological sciences
Carpenter, R. Principles and procedures of statistics, with special reference to the biological sciences. The Eugen. Rev. 52, 172, DOI: 10.1002/bimj.19620040313 (1960)
1960 doi
-
[52]
Statistical Methods of Analysis
Chiang, C. Statistical Methods of Analysis. Statistical Methods of Analysis (World Scientific, 2003)
2003
-
[53]
Pedregosa, F. et al. Scikit-learn: Machine learning in Python. J. Mach. Learn. Res. 12, 2825–2830 (2011)
2011
-
[54]
& Guestrin, C
Chen, T. & Guestrin, C. XGBoost: A scalable tree boosting system. In Proceedings of the 22nd ACM SIGKDD international conference on knowledge discovery and data mining, 785–794, DOI: 10.1145/2939672.2939785 (ACM, 2016)
2016
-
[55]
Lundberg, S. M. et al. Explainable machine-learning predictions for the prevention of hypoxaemia during surgery. Nat. Biomed. Eng. 2, 749, DOI: 10.1038/s41551-018-0304-0 (2018)
2018 doi
-
[56]
M., Erion, G
Lundberg, S. M., Erion, G. G. & Lee, S.-I. Consistent individualized feature attribution for tree ensembles. arXiv preprint arXiv:1802.03888 (2018)
2018 arXiv
-
[57]
Shapley, L. S. A value for n-person games. Contributions to Theory Games 2, 307–317 (1953)
1953
-
[58]
& Hedström, P
Keuschnigg, M., Mutgan, S. & Hedström, P. Urban scaling and the regional divide. Sci. Adv. 5, DOI: 10.1126/sciadv.aav0042 (2019)
2019 doi
-
[59]
Alves, L. G. A., Mangioni, G., Rodrigues, F., Panzarasa, P. & Moreno, Y . Unfolding the complexity of the global value chain: Strength and entropy in the single-layer, multiplex, and multi-layer international trade networks. Entropy 20, 909, DOI: 10.3390/e20120909 (2018)
2018 doi
-
[60]
Alves, L. G. A. et al. The nested structural organization of the worldwide trade multi-layer network. Sci. Reports 9, 2866, DOI: 10.1038/s41598-019-39340-w (2019)
2019 doi
-
[61]
Adamic, L. A. & Adar, E. Friends and neighbors on the web. Soc. Networks 25, 211–230, DOI: 10.1016/S0378-8733(03)00009-1 (2003)
2003 doi
-
[62]
& Amaral, L
Guimera, R. & Amaral, L. A. N. Functional cartography of complex metabolic networks. Nature 433, 895, DOI: 10.1038/nature03288 (2005). 27/28
2005 doi
-
[63]
Bootstrap methods: Another look at the jackknife
Efron, B. Bootstrap methods: Another look at the jackknife. In Kotz, S. & Johnson, N. L. (eds.) Breakthroughs in Statistics: Methodology and Distribution, 569–593 (Springer New York, New York, NY , 1992)
1992
-
[64]
Friedman, J. H. Greedy function approximation: A gradient boosting machine. The Annals Stat. 29, 1189–1232 (2001). 28/28
2001
Reviewed August 14, 2026 · model on record in the stance chip above.
Discussion (0). Continue with ORCID to comment.