REVIEW 5 major objections 8 minor 47 references
Studies of Star-forming Complexes in the Galaxies NGC 628, NGC 2976, and NGC 3351
T0 review · 5 major / 8 minor · reviewed 2026-08-14 · deepseek-v4-flash
Pith's one-line read Star-forming complexes show two CO kinematic regimes split near 70 km/s.
desk verdict A careful, modest archival study whose one genuinely new kinematic result is real but statistically fragile, because the decreasing CO branch rests on a handful of faint complexes with unquantified velocity-scatter errors. read the letter →
The pith
A machine-rendered reading of the paper's core claim, the machinery that carries it, and where it could break.
The reading
What carries the argument
The central object is the velocity scatter ΔV, computed as the difference between the 3σ endpoints of the CO spectrum for each complex rather than as a fitted dispersion, which lets the authors include faint and multi-peaked sources that previous CO studies excluded. ΔV carries the argument by splitting the sample into two kinematic regimes around 70 km/s. Supporting machinery is the multi-wavelength aperture photometry of the same complexes, reduced to a common spatial resolution, which provides the Hα, ultraviolet, infrared, and atomic-gas fluxes that establish the star-formation context and the CO-brightness comparisons.
What would settle it
Re-observe the apparently high-ΔV complexes in CO at higher sensitivity and velocity resolution: if the inverse branch is genuine, deeper data should show broad, low-column-density CO wings and an absence of bright complexes with ΔV > 70 km/s; if it is an artifact, deeper data should reveal either bright CO emission at high scatter or show that the large endpoint spreads are produced by two unrelated velocity components along the line of sight.
Extended reading notes
Core claim
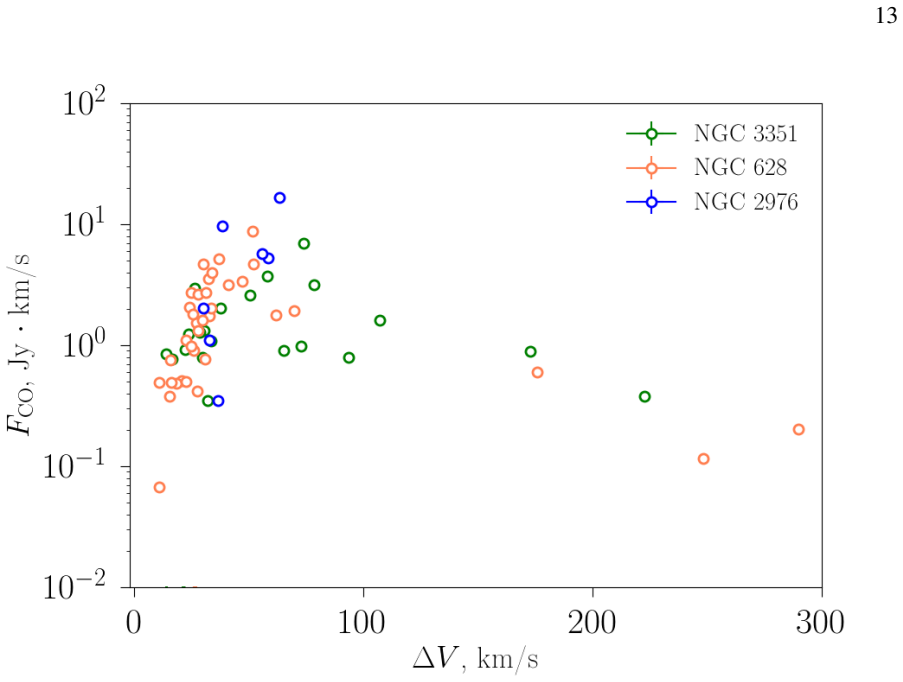
The authors define a velocity scatter ΔV for each star-forming complex as the difference between the velocities at the 3σ endpoints of its CO spectrum, deliberately avoiding Gaussian fits so that weak and multi-peaked emission can be included. In their sample of 95 complexes across three galaxies, the CO flux rises with ΔV up to about 70 km/s and then falls in complexes with larger scatter; the same two-group pattern appears in infrared surface brightness. They propose that the rising branch traces undisturbed molecular gas whose CO luminosity scales with mass, while the falling branch contains complexes whose gas has been disrupted by ongoing star formation, likely through supernova-driven shocks, and is fading in molecular emission. The paper presents this as preliminary, emphasizing that the uncertainty in ΔV cannot be accurately assessed and that weak, multi-peaked spectra make the endpoint criterion fragile.
Load-bearing premise
The load-bearing premise is that the velocity scatter ΔV, defined through 3σ endpoints of CO spectra, is a meaningful measure of internal kinematics whose uncertainties are small enough to support a clean two-regime split; if the measurement errors are large, or if faint high-ΔV complexes are preferentially kept while bright high-ΔV complexes are removed by the selection cuts, the declining CO branch could be an artifact.
Editorial extensions
If this is right
- If the two-regime relation is real, velocity-broadened molecular complexes in external galaxies can be read as objects in a later, feedback-dominated stage of evolution rather than simply as high-mass gas reservoirs.
- Surveys that select complexes by bright CO emission would systematically miss the high-ΔV branch, so complete censuses of star-forming complexes must include faint, extended molecular sources.
- The ~70 km/s break provides a concrete threshold that numerical simulations of supernova feedback in giant molecular clouds can be tested against.
- A larger sample of galaxies spanning different metallicities and morphologies could show whether the break velocity and the slope of the fading branch vary with environment.
Reading between the lines
- A direct test would be to stack the CO spectra of the high-ΔV complexes: if the branch is real, the average profile should show broad, faint wings, whereas two unrelated velocity components along the line of sight would produce a double-peaked stack instead.
- The same two-regime behavior may be visible in atomic hydrogen, and the authors themselves call for HI and Hα kinematic studies; if HI shows the same fading at high scatter, the feedback interpretation would be strengthened independently of CO excitation effects.
- If supernova feedback drives the second branch, high-ΔV, low-CO complexes should also show elevated radio continuum or mid-infrared evidence of recent supernova remnants, a correlation the current data do not yet test.
Signed reviews
Editorial analysis
A structured set of objections, weighed in public.
Referee Report
Summary. Smirnova and Wiebe analyze archival multi-wavelength observations (GALEX UV, Spitzer 3.6–24 µm, Herschel 70–160 µm, THINGS HI, HERACLES CO, and ground-based Hα) of star-forming complexes in NGC 628, NGC 2976, and NGC 3351, using apertures defined in their earlier study and convolved to a common resolution. They report that UV, 8 µm, and 24 µm fluxes and surface brightnesses correlate with Hα; that the F8/F24 flux ratio anticorrelates with Hα flux; that HI correlates with Hα while CO correlates more weakly; and that the CO velocity scatter ΔV, defined as the full 3σ width of the CO spectrum, is claimed to relate to the CO flux in two regimes—rising below about 70 km/s and falling above it. The high-ΔV branch is described in the body as preliminary, and the authors explicitly state that the uncertainty in ΔV cannot be accurately assessed and is comparable to ΔV for faint complexes, and that their Umin and γ dust-model parameters are functions of the observed IR fluxes. The main conclusions are the correlations plus the tentative two-regime kinematic relation.
Significance. The paper's catalog and multiwavelength measurements for nearly one hundred complexes in three galaxies of different morphological types are a useful resource, and the qualitative correlations are broadly consistent with established SFR-indicator behavior. The potentially novel element is the two-regime ΔV–FCO relation: if confirmed, it would provide an observational constraint on how molecular gas kinematics respond to feedback in the regime where CO emission fades while internal motions grow, complementing galaxy-scale studies of gas velocity dispersion. The manuscript has genuine strengths: it uses homogeneous archival data reduced to a common resolution, the methodology is transparent, and the authors themselves flag the principal weaknesses, including the impossibility of accurately assessing ΔV uncertainties (Section III.B) and the fitted-flux dependence of Umin and γ (Section IV). Because the paper provides no quantitative significance measures and its headline kinematic claim rests on a handful of faint complexes with errors comparable to the measured quantities, the significance of the results is provisional until the robustness tests described below are supplied.
major comments (5)
- [§III.B, Fig. 7, §V, Abstract] The central kinematic claim—that FCO grows with ΔV for ΔV ≲ 70 km/s and decreases with ΔV above that—is not statistically supported as presented. Section III.B states that the authors 'cannot accurately assess the uncertainty in ΔV' and assume it is 'comparable to the ΔV values for SFCs with low FCO fluxes.' The decreasing branch in Fig. 7 rests on about five complexes (NGC 628 #3 and #61; NGC 3351 #8, #19, and #23 in Table 1), all of them faint CO sources for which the 3σ-endpoint definition is most fragile, and the 70 km/s division is a visual choice with no significance test attached to either branch. Because the abscissa uncertainties are comparable to the position of the break itself, the data as presented cannot distinguish a two-regime relation from a scatter-dominated distribution. To make the claim load-bearing, the authors should (i) quantify ΔV uncertainties by Monte Carlo resampling of the observed noise and re-derivation of the 3σ endpoints; (ii) report correlation statistics (e.g., Spearman ρ with uncertainties) separately for ΔV ≤ 70 km/s and ΔV > 70 km/s; (iii) test the stability of the decreasing branch under removal of any single high-ΔV complex; and (iv) align the Abstract with Section V, where the two-regime result is already qualified as preliminary and as requiring 'further verification due to uncertainties associated with estimation of the parameter ΔV.' The Abstract's flat statement that the increase in velocity scatter is 'accompanied by a decrease in the CO line luminosity' is stronger than the acknowledged uncertainties permit.
- [§II, Fig. 7] Selection and measurement effects may produce the apparent inverse branch without any real decrease in CO luminosity. The SFC sample was chosen to include emission in at least one band (Section II), the 3σ detection threshold removes faint complexes with low peak flux regardless of their intrinsic ΔV, and the cut that excludes SFCs with ΔV exceeding half the global velocity range suppresses the high-ΔV end in galaxies with small rotation ranges such as NGC 2976. A faint, broadened complex is retained only if its peak exceeds 3σ, while a bright complex with the same ΔV has a higher peak and is more likely to be kept; this asymmetry can create a spurious anticorrelation between FCO and ΔV at high ΔV even if no physical trend exists. The authors should test this with injection experiments: embed artificial CO spectra of known FCO and ΔV into the line-free channels of the data cubes, run them through the same 3σ-endpoint and half-global-velocity selection, and show that the recovery of ΔV is unbiased as a function of FCO at high ΔV.
- [§III.B, §IV] The interpretation of the high-ΔV branch as internal kinematics disturbed by feedback is not yet supported by the definition of ΔV, which is the full 3σ velocity extent of the spectrum rather than the width of a single component. This quantity includes the relative motion of multiple kinematically distinct clouds along the line of sight and, for the largest apertures (several kpc at the distances of these galaxies), the gradient of galactic rotation across the aperture. Fig. 6 illustrates the ambiguity: complex 3 of NGC 628 shows 'several lines slightly above the background' separated by almost 300 km/s, a pattern that could equally be a superposition of unrelated molecular clouds. The manuscript should estimate the rotation-shear contribution to ΔV from the HERACLES velocity fields or a rotation-curve model and quantify how much of the reported ΔV is attributable to shear and projection; without such an assessment, the feedback-dominated interpretation in Section IV is an interpretation rather than a measurement.
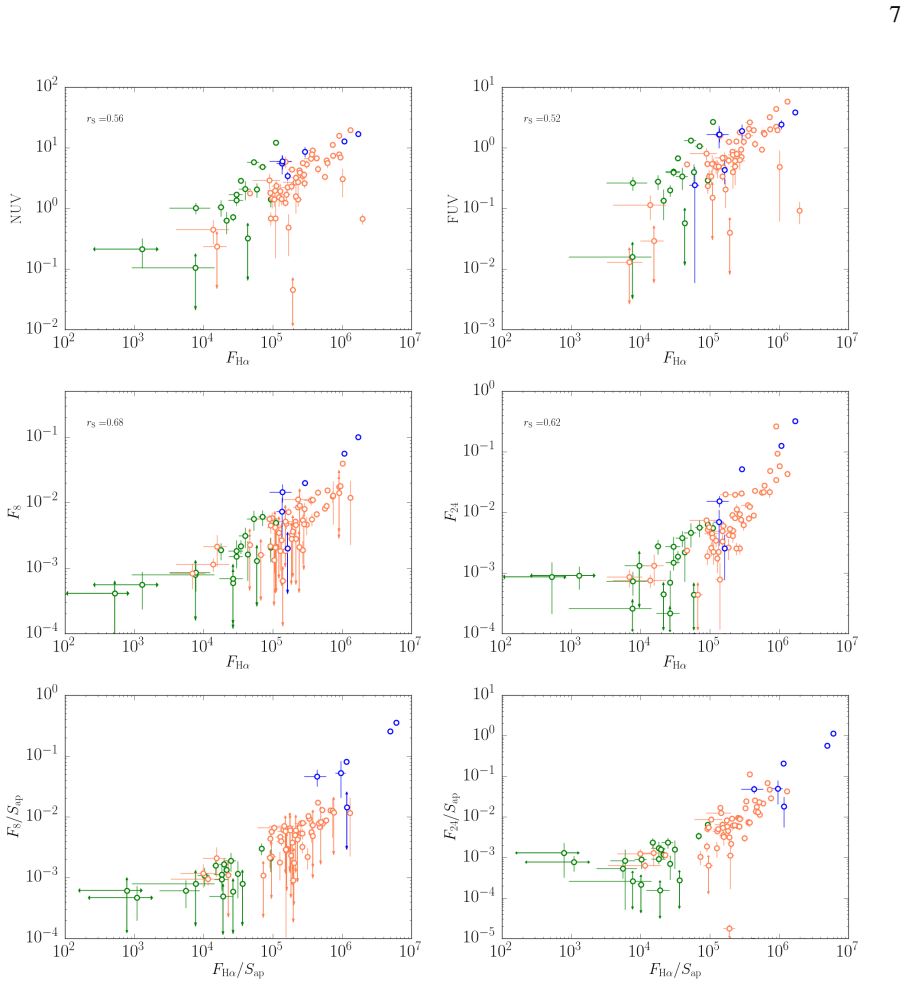
- [§III.A, Figs. 2–4] The paper's correlational findings—Hα with UV, 8 μm, 24 μm, HI, and CO fluxes and surface brightnesses, and the F8/F24 anticorrelation with Hα—are asserted from visual inspection of figures, with no correlation coefficients, significance levels, or scatter estimates anywhere in Section III. This matters because per-galaxy samples are small (7 SFCs in NGC 2976), several flagged outliers exist (NGC 3351 #20 and #21), and some relations are non-linear or dominated by the dynamic range of the fluxes. The authors should report rank correlation coefficients with uncertainties for each claimed relation, for the full sample and per galaxy, and state explicitly how the identified outliers are treated in these statistics.
- [§IV, Conclusion 3] The interpretation of the F8/F24–Hα anticorrelation as evidence for a change in excitation conditions (an increase in the model parameter γ) is partly circular. As the authors acknowledge, the values of Umin and γ adopted from [14] 'are obtained by fitting spectra, and are therefore functions of the observed IR fluxes'; since F8/F24 is itself one of the fitted flux ratios, the Draine & Li (2007) model can reproduce the observed trend by construction, and the degeneracy between a reduced PAH mass fraction qPAH and an increased γ is not broken by the present data. The hedge in Section IV ('this correspondence should not be overemphasized') is appropriate, but Conclusion 3 still presents the excitation-condition explanation as a substantive result. The authors should refit the SEDs with the 8 μm band excluded (or use an independent PAH indicator), or explicitly recast Section IV as a consistency check and state in the conclusions that the mechanism is underdetermined by these data.
minor comments (8)
- [Fig. 3 caption, §III.A] Fig. 3's caption and the corresponding text describe both lower panels as 'the ratio of the 8 µm flux and far-IR flux'; the right panel should be the ratio of the 24 µm flux to the far-IR flux.
- [§III.B] Section III.B, the phrase 'for SFRs for which ΔV is comparable to the total velocity range considered' should read 'for SFCs' (star-forming complexes), not 'SFRs' (star-forming regions).
- [§II] Section II, the KINGFISH survey sentence contains a typographical double bracket, '[11]]', and the survey footnote markers are inconsistently placed.
- [§I] Section I describes NGC 628 as 'a classic spiral galaxy viewed almost side-on'; NGC 628 (M74) is nearly face-on, so the sentence should be corrected.
- [Table 1] Table 1 as printed contains only coordinates, FHa, ΔV, FUV, and NUV; the CO, HI, 8 μm, 24 μm, and far-IR fluxes that underlie Figs. 2–8 are not listed, so the quantitative claims cannot be checked from the table; the full table, or a machine-readable version, should be provided.
- [Table 1] Several rows of Table 1 have no FHa entry (e.g., NGC 628 #1, #2, #6, #7, #33, #38, #40–#43, #54, #56, #58, #62); the authors should state whether these are non-detections or formatting truncation.
- [Figs. 4 and 7] The units of the CO and HI fluxes plotted in Figs. 4 and 7 are never defined; the text should state that these are integrated line fluxes (presumably Jy km/s) from the THINGS and HERACLES surveys.
- [§IV] Section IV, 'the variable Umin, defined in [14], correlates well with FHα, making these variables interchangeable' should be rephrased, since Umin is a model parameter; it is the value of Umin inferred from the SED fit that correlates with FHα.
Circularity Check
IR interpretation partially circular: Umin and gamma were fitted to the same IR fluxes they are used to explain; the CO two-regime claim is independent.
-
fitted input called prediction
[Section IV (Discussion), explanation of the F8/F24 anti-correlation]
"The model [32] predicts that increasing γ with Umin fixed leads to a reduction of the ratio F8/F24, and to a significant increase in F24/FIR with F8/FIR remaining almost constant. This corresponds to the observations, but this correspondence should not be overemphasized. The values of Umin and γ derived from the observations in [14] are obtained by fitting spectra, and are therefore functions of the observed IR fluxes."
Umin and γ were derived in the authors' prior paper [14] by fitting the Draine & Li model [32] to the Spitzer/Herschel IR fluxes of the same star-forming complexes. Using these fitted parameters to reproduce the observed F8/F24 and F24/FIR trends is therefore not an independent model prediction: the parameters are functions of the very flux ratios they are invoked to explain. The paper concedes this in the quote ('should not be overemphasized'), yet the Discussion and Conclusion 3 still present the excitation-condition explanation as a finding. The circularity is limited to this IR interpretation; it is self-admitted and tentative.
full rationale
The central, most original claim is the CO kinematics result: the two-regime relation between CO luminosity and velocity scatter ΔV, with a rising branch below ~70 km/s and a tentative decreasing branch at larger ΔV. This claim is not circular: FCO and ΔV are both measured from the HERACLES CO spectra, and no fitted parameter couples them; the two-regime behavior is an empirical scatter relation. The Hα–UV–IR correlations and HI correlations are likewise direct aperture-photometry results. The only step that reduces to its own inputs is the Section IV interpretation of the F8/F24 anti-correlation, where Umin and γ taken from the authors' prior fit [14] are used to explain trends in the same IR flux ratios they were fitted to; the authors explicitly warn that the correspondence should not be overemphasized. Because that IR interpretation is tentative and the central CO claim is independent, the overall circularity is partial and modest (4), not a forced derivation. The fragility of the high-ΔV branch (handful of low-FCO complexes, unquantified ΔV errors) is a robustness/statistics concern, not circularity.
Assumptions & free parameters
free parameters (3)
- Umin (average radiation intensity) =
not given here; fitted in Smirnova et al. 2017 [14]
- gamma (mass fraction of dust in high-intensity regions) =
not given here; fitted in [14]
- Delta V regime threshold =
~70 km/s
assumptions (4)
- domain assumption H-alpha emission traces recent massive star formation and scales with the current SFR.
- domain assumption CO(2-1) line emission traces molecular gas and the CO flux is a measure of SFC mass.
- domain assumption The Draine and Li 2007 dust model describes the IR emission and relates 8 and 24 micron emission to PAH abundance and radiation intensity.
- domain assumption The aperture selection from Smirnova et al. 2017 defines physically meaningful star-forming complexes.
Cite this review
Pith. "Pith review of Studies of Star-forming Complexes in the Galaxies NGC 628, NGC 2976, and NGC 3351." pith.science (2026). https://pith.science/paper/N2K4JY5J
@misc{pith2026190803756,
  author       = {Pith},
  title        = {Pith review of: Studies of Star-forming Complexes in the Galaxies NGC 628, NGC 2976, and NGC 3351},
  year         = {2026},
  howpublished = {\url{https://pith.science/paper/N2K4JY5J}},
  note         = {Machine review of arXiv:1908.03756}
}
abstract
We analyze parameters of the interstellar matter emission in star-forming complexes in the high metallicity galaxies NGC~628, NGC~2976, and NGC~3351, which have different morphological types. The relation between H$\alpha$ emission and emission in CO and HI lines is considered along with the relation between H$\alpha$ emission and dust emission in the infrared range (IR). The fluxes and surface brightnesses in the UV and IR correlate well with H$\alpha$ emission. The HI emission also correlates well with H$\alpha$, while the correlation between the CO and H$\alpha$ emission is much less prominent. The ratio of the fluxes at 8 and 24 $\mu$m decreases with increasing H$\alpha$ flux. This may be due to changes in the properties of the dust ensemble (a decrease in the mass fraction of polycyclic aromatic hydrocarbons) or to changes in excitation conditions. Analysis of the kinematics of the CO lines shows that the CO flux grows with increasing velocity scatter $\Delta V$ when $\Delta V\lesssim70$~km/s. Preliminary evidence for the existence of star-forming complexes with higher values of $\Delta V$ is presented, and the increase in the velocity scatter is accompanied by a decrease in the CO line luminosity of the complex.
Figures


Figures from the paper (6 more)




Reference graph
Works this paper leans on
- [14]
-
[1]
We have found correlations between the H α fluxes and surface brightnesses of SFCs and analogous parameters in the UV and IR
-
[2]
This is most likely due to a more substantial increase of the 24µm flux
The ratio of the fluxes of SFCs in the 8 and 24µm bands decreases with increasing Hα flux. This is most likely due to a more substantial increase of the 24µm flux
-
[3]
Our analysis of the origins of the variations F8/F24 flux ratio indicates that this may be due not only to evolutionary factors (variations in the mass fraction of PAHs), but also to variations in the conditions for excitation of this emission
-
[4]
The Origin and Evolution of the Universe
Our analysis of data on the kinematics of molecular gas in the SFCs shows that the re- lationship between the CO luminosity and the velocity scatter is ambiguous. Preliminary 18 results indicate that the CO luminosity and ∆V are correlated when ∆V ≲ 70 km/s, while the growth of ∆V is accompanied by a decrease in the CO luminosity for larger values of the ...
-
[5]
Wiebe, D. S., Khramtsova, M. S., Egorov, O. V ., et al. 2014, Astronomy Letters, 40, 278
work page 2014
-
[6]
M. S. Khramtsova, D. S. Wiebe, T. A. Lozinskaya, and O. V . Egorov, 2014, Monthly Not. Roy. Astron. Soc., 444, 757. 19
work page 2014
-
[7]
Kennicutt, R. C. 1998, Ann.Rev.Astron.Astrophys, 36, 189
work page 1998
Show all 47 references
-
[8]
J., Scalo, J., Maciel, W
Rocha-Pinto, H. J., Scalo, J., Maciel, W. J., et al. 2000, A&A, 358, 869
2000
-
[9]
P., & Whitney, B
Robitaille, T. P., & Whitney, B. A. 2010, ApJL, 710, L11
2010
-
[10]
2013, Secular Evolution of Galaxies, 419
Calzetti, D. 2013, Secular Evolution of Galaxies, 419
2013
-
[11]
(far-IR at 70, 100, and 160 µm with the Herschel Space Telescope), SINGS [12] (near- and mid-IR bands at 3.6, 4.5, 5.8, 8.0, and 24µm with the Spitzer Space Telescope), and HERACLES
-
[12]
R. C. Kennicutt et al., 2003, Publ. Astron. Soc. Pacif., 115, 928
2003
-
[13]
velocity scatter
(CO (21) line using the 30-m IRAM telescope). We investigated the relationship between different components of the ISM in particular SFCs. Infrared data were used to estimate the total mass of dust (M), the mass fraction of PAHs (qPAH), and the average radiation intensityUmin ...
-
[15]
M., Meurer, G
Audcent-Ross, F. M., Meurer, G. R., Wong, O. I., et al. 2018, MNRAS, 480, 119
2018
-
[16]
2010, Astrophys
Calzetti, D., Wu, S.-Y ., Hong, S., et al. 2010, Astrophys. J. , 714, 1256
2010
-
[17]
Walter et al., 2008, Astron
F. Walter et al., 2008, Astron. J., 136, 2563
2008
-
[18]
R. C. Kennicutt et al., 2011, Publ. Astron. Soc. Pacif., 123, 1347
2011
-
[19]
A. K. Leroy et al., 2009, Astron. J., 137, 4670
2009
-
[20]
I., Murga, M
Smirnova, K. I., Murga, M. S., Wiebe, D. S., et al. 2017, Astronomy Reports, 61, 646
2017
-
[21]
2013, AJ, 146, 150
Cald ´u-Primo, A., Schruba, A., Walter, F., et al. 2013, AJ, 146, 150
2013
-
[22]
K., et al
Pety, J., Schinnerer, E., Leroy, A. K., et al. 2013, Astrophys. J. , 779, 43
2013
-
[23]
M., de Blok, W
Mogotsi, K. M., de Blok, W. J. G., Cald ´u-Primo, A., et al. 2016, AJ, 151, 15
2016
-
[24]
A., Yukita, M., Tennant, A
Swartz, D. A., Yukita, M., Tennant, A. F., et al. 2006, Astrophys. J. , 647, 1030
2006
-
[25]
M., Chromey, F
Elmegreen, D. M., Chromey, F. R., Santos, M., et al. 1997, AJ, 114, 1850
1997
-
[26]
2014, MNRAS, 437, 1534
S ´anchez-Bl´azquez, P., Rosales-Ortega, F., Diaz, A., et al. 2014, MNRAS, 437, 1534
2014
-
[27]
S., & Efremov, Y
Gusev, A. S., & Efremov, Y . N. 2013, MNRAS, 434, 313
2013
-
[28]
C., Lee, J
Kennicutt, R. C., Lee, J. C., Funes, J. G., et al. 2008, ApJS, 178, 247
2008
-
[29]
C., Fanson, J., Schiminovich, D., et al
Martin, D. C., Fanson, J., Schiminovich, D., et al. 2005, ApJL, 619, L1
2005
-
[30]
Aniano, B
G. Aniano, B. T. Draine, K. D. Gordon, and K. Sandstrom, 2011, Publ. Astron. Soc. Pacif., 123, 1218
2011
-
[31]
B., Courtois, H
Tully, R. B., Courtois, H. M., & Sorce, J. G. 2016, AJ, 152, 50
2016
-
[32]
M. S. Khramtsova, D. S. Wiebe, P. A. Boley, and Y . N. Pavlyuchenkov, 2013, Monthly Not. Roy. Astron. Soc., 431, 2006
2013
-
[33]
Larson, R. B. 1981, MNRAS, 194, 809
1981
-
[34]
Gusev, A. S. 2014, MNRAS, 442, 3711
2014
-
[35]
C., Christie, D., et al
Li, Q., Tan, J. C., Christie, D., et al. 2018, PASJ, 70, S56
2018
-
[36]
R., Burkhart, B., Forbes, J
Krumholz, M. R., Burkhart, B., Forbes, J. C., et al. 2018, MNRAS, 477, 2716
2018
-
[37]
Kim, J.-G., Kim, W.-T., & Ostriker, E. C. 2018, Astrophys. J. , 859, 68
2018
-
[38]
B. T. Draine and A. Li, 2007, Astrophys. J., 657, 810
2007
-
[39]
V ., Tikhonov, A
Moiseev, A. V ., Tikhonov, A. V ., & Klypin, A. 2015, MNRAS, 449, 3568
2015
-
[40]
A., & Mitchell, G
Frail, D. A., & Mitchell, G. F. 1998, Astrophys. J. , 508, 690
1998
-
[41]
G., Dwek, E., Blair, W
Arendt, R. G., Dwek, E., Blair, W. P., et al. 2010, Astrophys. J. , 725, 585
2010
-
[42]
Tappe, A., Rho, J., & Reach, W. T. 2006, Astrophys. J. , 653, 267. 20
2006
-
[43]
2012, Astrophys
Tappe, A., Rho, J., Boersma, C., et al. 2012, Astrophys. J. , 754, 132
2012
-
[44]
R., Jones, A
Micelotta, E. R., Jones, A. P., & Tielens, A. G. G. M. 2010, A&A, 510, A36
2010
-
[45]
S., Khoperskov, S
Murga, M. S., Khoperskov, S. A., & Wiebe, D. S. 2016, Astronomy Reports, 60, 669
2016
-
[46]
D., Smith, R
Slavin, J. D., Smith, R. K., Foster, A., et al. 2017, Astrophys. J. , 846, 77
2017
-
[47]
2017, A&A, 599, A76
Melnick, J., Telles, E., Bordalo, V ., et al. 2017, A&A, 599, A76. 21 TABLE I: Parameters of the ISM of galaxies: NGC 628, NGC 2976, NGC 3351. n α, h : m : s δ,◦ :′ :′′ FHa ± ∆FHa ∆V FUV ± ∆FUV , Jy NUV ± ∆NUV , Jy NGC 628 1 1:36:37.090 +15:50:26.34 15.893 0.90 ± 0.07 2.74 ± 0...
2017
Reviewed August 14, 2026 · model on record in the stance chip above.
Discussion (0). Continue with ORCID to comment.