REVIEW 4 major objections 5 minor 31 references
Lightweight and Scalable Particle Tracking and Motion Clustering of 3D Cell Trajectories
T0 review · 4 major / 5 minor · reviewed 2026-08-14 · deepseek-v4-flash
Pith's one-line read A fully unsupervised pipeline finds at least three distinct 3D motion patterns in Toxoplasma gondii, contrary to the earlier single-pattern claim.
desk verdict A reasonable engineering extension of the authors' prior 2D work, with real speedups and open code, but the three-phenotype claim rests on unvalidated tracking and hand-picked hyperparameters. read the letter →
The pith
A machine-rendered reading of the paper's core claim, the machinery that carries it, and where it could break.
The reading
What carries the argument
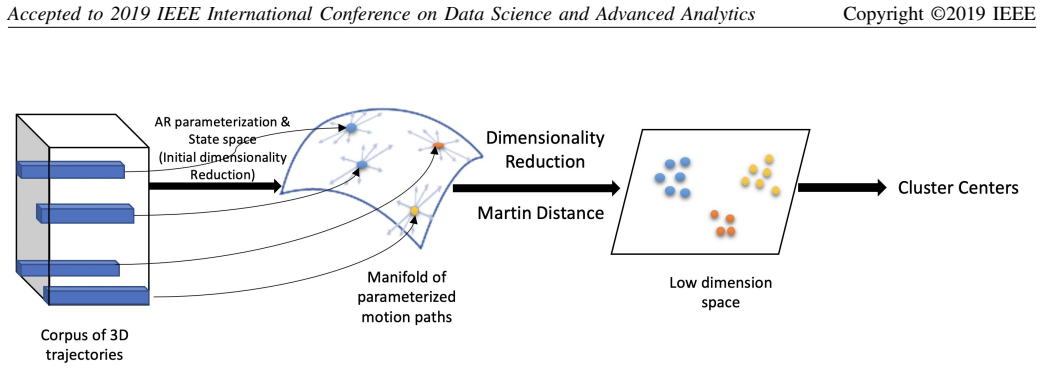
The load-bearing machinery is a chain: an autoregressive (AR) model of order 5 turns each cell's position sequence into five 2x2 transition matrices, encoding the dynamics of a low-dimensional hidden state while discarding absolute coordinates; the Martin distance, a geodesic distance for comparing linear dynamical systems, measures pairwise dissimilarity of those AR parameters; and spectral clustering on the resulting affinity matrix groups trajectories into motion phenotypes. The AR transition matrices are the central object because they carry the motion signature, and the Martin distance is what respects their non-Euclidean geometry. A PCA projection first maps 3D positions into a 2D latent space shared by all trajectories.
What would settle it
Take a set of 3D T. gondii videos with manually annotated cell positions, run the pipeline on them, and compare the extracted trajectories to the annotations; if tracking errors are substantial, the three clusters would not reproduce among the correctly tracked trajectories. A cleaner test would be to generate synthetic 3D trajectories with known circular, semi-circular, and straight-line corkscrew dynamics and check whether the pipeline recovers exactly those three groups.
Extended reading notes
Core claim
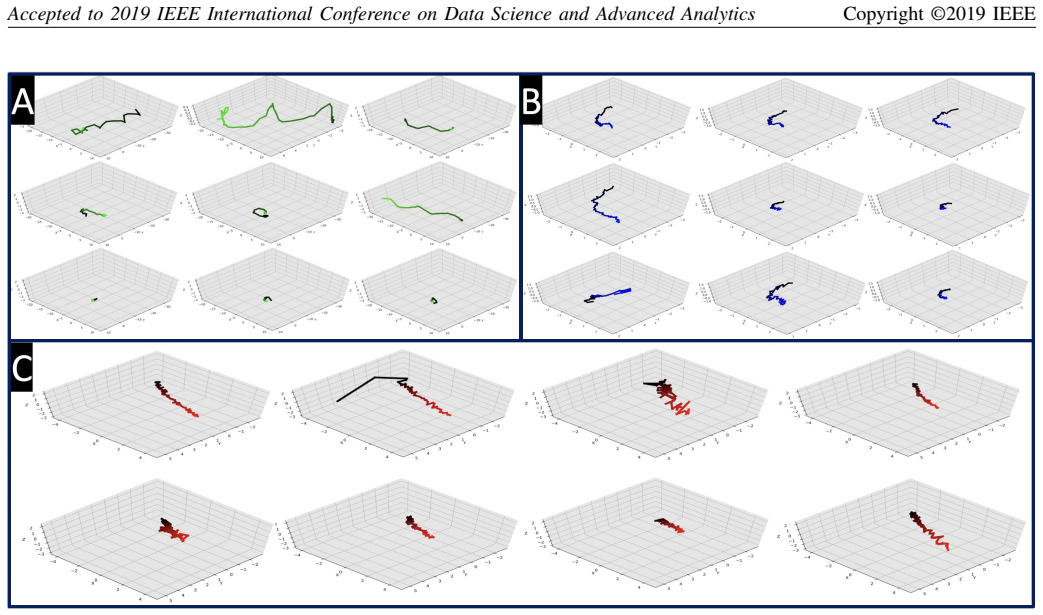
The central claim is that trajectories of T. gondii in 3D do not collapse into a single motion type: after parameterizing about 3,000 trajectories with an order-5 autoregressive model, comparing trajectories with Martin distance, and clustering the resulting affinity graph with spectral clustering using k=3, the authors report three distinct clusters: circular or helical motion, erratic clockwise semi-circular motion, and straight-line corkscrew motion. The paper further claims that this unsupervised grouping is consistent with prior 2D findings, that the AR transition matrices are similar within clusters and differ across clusters, and that the full detection-to-clustering pipeline runs in a lightweight, distributed fashion without sacrificing the result.
Load-bearing premise
The whole result assumes that the detected and tracked trajectories are true cell paths, because the paper never measures detection or tracking error against ground truth; if the tracking step frequently confuses cells or loses them, the clusters would reflect tracking noise rather than real motion.
Editorial extensions
If this is right
- T. gondii motility in 3D is not a single behavior: at least three reproducible motion phenotypes exist and can be separated automatically.
- Because the clustering is unsupervised and uses coordinate-invariant motion parameters, the same pipeline can be applied to new T. gondii videos without retraining or manual labels.
- The 87.9% wall-time reduction shows that the full detection-tracking-clustering analysis is feasible on large 4D microscopy datasets, not just small 2D samples.
- The framework is transferable in principle to other motile parasites, such as Plasmodium ookinetes and sporozoites, whose motility is similarly tied to infectivity.
- The three clusters provide a concrete starting hypothesis for linking specific motion patterns to stages of the lytic cycle or to drug effects.
Reading between the lines
- A testable extension implicit in the paper: if the pipeline is applied to videos after pharmacological stimulation or inhibition of motility, the relative sizes or geometries of the three clusters should shift, which would validate the phenotypes as functional states rather than artifacts of the parameterization.
- An implication the authors leave implicit is that, because the features are invariant to absolute position, the method should be insensitive to where in the imaging volume a cell moves; it could therefore be applied to other organisms whose motion differs mainly in turn rate and curvature.
- If tracking errors are rare, the same AR-plus-Martin-distance pipeline could be used to compare mutant strains: a motility-mutant line should show a shifted cluster distribution relative to wild-type, offering a direct bridge from computational phenotypes to genetics.
Signed reviews
Editorial analysis
A structured set of objections, weighed in public.
Referee Report
Summary. This paper presents a computational pipeline for detecting, tracking, and clustering the 3D motion of Toxoplasma gondii parasites in time-lapse microscopy. The pipeline includes preprocessing, cell detection, tracking via Hungarian assignment, trajectory extraction, AR-model parameterization, Martin-distance kernel construction, and spectral clustering. The authors also implement a Dask-based distributed version and report wall-time reductions on Google Cloud Platform. The central scientific claim is that the unsupervised pipeline reveals at least three distinct motion phenotypes in 3D, contrary to a prior suggestion of a single 3D motion type. The abstract asserts that the results 'prove both the accuracy and performance' of the method.
Significance. If the claims were fully validated, the work would be useful: it provides an open-source, scalable 3D tracking and motion-clustering framework for a medically relevant parasite, and it extends prior 2D phenotype discovery to 3D. The performance measurements are concrete and reproducible, and the code release is a strength. However, the scientific and methodological claims currently outrun the evidence: there is no quantitative accuracy evaluation of the detection/tracking stage, and the clustering choices are not validated.
major comments (4)
- [Section III-D and Section IV] The abstract claims that the results 'prove both the accuracy and performance' of the method, but no quantitative accuracy evaluation is reported anywhere in the Results section. Cell detection and tracking are delegated to the prior work [5], and the Results contain only visualizations (Figs. 6-9) and wall-time comparisons (Fig. 12). Because the AR parameters and Martin distances are computed from the extracted trajectories, any detection or association errors propagate directly into the clustering; without ground-truth or synthetic benchmarks, the phenotype clusters cannot be attributed to real cell motion. Please add quantitative tracking/association metrics (e.g., precision/recall against manual annotations or synthetic ground truth).
- [Section III-F, III-H, IV] The unsupervised claim rests on several data-dependent choices made on the same corpus: the AR order d=5 is asserted to 'work well' (Section III-F), the number of clusters k=3 is selected from 'a drop in the eigenvalues' with no quantitative criterion (Section IV), and beta in Eq. (16) is a free parameter of the RBF kernel. No sensitivity analysis is provided to show that the three clusters are stable under reasonable variations of d, beta, and k. The conclusion itself concedes that the model 'relies on hand-tuned hyperparameters' and 'makes for a brittle model.' This brittleness is directly relevant to the central biological claim, so please provide stability/sensitivity analyses or a principled selection procedure.
- [Section IV-A and Section III-H] The text states that after computing the graph Laplacian L, the three largest eigenvectors of L are used to embed the trajectories. Standard spectral clustering uses the eigenvectors corresponding to the smallest nonzero eigenvalues of the Laplacian (or the largest eigenvectors of the affinity matrix), because the small-eigenvalue eigenvectors encode the cluster structure. Please clarify whether L is the graph Laplacian or the affinity matrix, and correct the eigenvector selection if necessary; as written, the embedding may not be the one that separates the clusters.
- [Section IV-B and Conclusion] The biological conclusion that there are 'at least three types of motion patterns' is supported only by qualitative visual inspection of sample trajectories (Fig. 7), an aggregated colored plot (Fig. 8), and subjective comparison of AR matrices (Fig. 9). There is no statistical validation of cluster separation or stability (e.g., silhouettes, bootstrap, permutation tests), and no quantitative comparison against the single-motion model of [14]. Given that the pipeline is unsupervised and the parameters are tuned on the same data, the visual impression alone is not sufficient to reject the previous single-motion hypothesis.
minor comments (5)
- [Section III-C, Eqs. (5)-(6)] The notation is inconsistent: the equations use y_t and x_t, while the text defines r_t = (x_t,y_t,z_t) and refers to a hidden state h_t. Please use one consistent set of symbols.
- [Throughout] Several typos exist, e.g., 'hihgly' in Section I, 'form trajectories' instead of 'from trajectories' in Section III-F, 'applicant' instead of 'application' in the Conclusion, and 'comutational' in the caption of Fig. 12.
- [Eq. (16)] The RBF kernel formulation S_i = exp(-beta * M_i / sigma) is unusual; typically the exponent is -d^2/(2 sigma^2) or -gamma * d^2. Please clarify the roles of beta and sigma and report how these values were chosen.
- [Fig. 6 caption] The caption says 'different angles (90,180,270,360)' but 360 degrees is equivalent to 0 degrees; please correct to (0,90,180,270) or similar.
- [Section III-D] Since the tracking module is central and borrowed from [5], please briefly describe its algorithmic steps and any reported accuracy from [5] so that readers can assess the error propagation risk.
Circularity Check
No circularity: the clustering result is an empirical, data-driven output of standard unsupervised methods applied to new data, not a quantity derived from its own inputs.
full rationale
The derivation chain is self-contained: the pipeline applies standard AR parameterization (Eqs. 5-6), Martin distance (Eqs. 10-15), an RBF affinity kernel (Eq. 16), and scikit-learn spectral clustering (Section III-H) to trajectories produced by its own detection and tracking modules. The choice k=3 is made on the same data by inspecting eigenvalues and the affinity matrix, and the three phenotypes are then characterized by visual inspection; this is an empirical, data-driven discovery claim rather than a fitted parameter renamed as a prediction. Citations to the authors' prior work ([4], [5], [20]) supply components and motivation, but the central result—that spectral clustering separates the AR-parameterized trajectories into k=3 groups—does not reduce to those citations, nor does the paper import a uniqueness theorem or define its inputs in terms of its outputs. The conclusion's admission that the model 'relies on hand-tuned hyperparameters' is a robustness caveat, not evidence that the clustering output is equivalent to its own inputs. The absence of a ground-truth accuracy evaluation for detection and tracking is a correctness and validity risk, but it is not circularity by construction.
Assumptions & free parameters
free parameters (5)
- Number of clusters k =
3
- AR model order d =
5
- RBF kernel scale beta =
not specified
- Latent dimension n =
2
- Trajectory length cutoff =
61 frames
assumptions (5)
- domain assumption T. gondii 3D motion is adequately captured by a linear AR model of order 5 on a 2D latent subspace with a shared projection matrix C.
- domain assumption Cell detection and tracking are accurate enough that the extracted trajectories reflect true cell motion.
- domain assumption Trajectories from different videos and experiments can be pooled into a single corpus for clustering.
- ad hoc to paper The eigengap-based choice k=3 corresponds to biologically real phenotypes.
- standard math Martin distance computed with shared C and the RBF kernel is a valid similarity for spectral clustering of AR models.
Cite this review
Pith. "Pith review of Lightweight and Scalable Particle Tracking and Motion Clustering of 3D Cell Trajectories." pith.science (2026). https://pith.science/paper/ENNPOECR
@misc{pith2026190803775,
  author       = {Pith},
  title        = {Pith review of: Lightweight and Scalable Particle Tracking and Motion Clustering of 3D Cell Trajectories},
  year         = {2026},
  howpublished = {\url{https://pith.science/paper/ENNPOECR}},
  note         = {Machine review of arXiv:1908.03775}
}
read the original abstract
Tracking cell particles in 3D microscopy videos is a challenging task but is of great significance for modeling the motion of cells. Proper characterization of the cell's shape, evolution, and their movement over time is crucial to understanding and modeling the mechanobiology of cell migration in many diseases. One in particular, toxoplasmosis is the disease caused by the parasite Toxoplasma gondii. Roughly, one-third of the world's population tests positive for T. gondii. Its virulence is linked to its lytic cycle, predicated on its motility and ability to enter and exit nucleated cells; therefore, studies elucidating its motility patterns are critical to the eventual development of therapeutic strategies. Here, we present a computational framework for fast and scalable detection, tracking, and identification of T. gondii motion phenotypes in 3D videos, in a completely unsupervised fashion. Our pipeline consists of several different modules including preprocessing, sparsification, cell detection, cell tracking, trajectories extraction, parametrization of the trajectories; and finally, a clustering step. Additionally, we identified the computational bottlenecks, and developed a lightweight and highly scalable pipeline through a combination of task distribution and parallelism. Our results prove both the accuracy and performance of our method.
Figures


Figures from the paper (8 more)





Reference graph
Works this paper leans on
-
[14]
Leung, Jacqueline M., et al. ”Disruption of TgPHIL1 alters specific parameters of Toxoplasma gondii motility measured in a quantitative, three-dimensional live motility assay.” PloS one9.1 (2014): e85763
work page 2014
-
[5]
Fazli, Mojtaba S., et al. ”Toward Simple & Scalable 3D Cell Tracking.” 2018 IEEE International Conference on Big Data (Big Data). IEEE, 2018
work page 2018
-
[1]
Saadatnia, Geita, and Majid Golkar. ”A review on human toxoplasmo- sis.” Scandinavian journal of infectious diseases 44.11 (2012): 805-814
work page 2012
-
[2]
Toxoplasmosis of animals and humans
Dubey, Jitender Prakask. Toxoplasmosis of animals and humans. CRC press, 2016
work page 2016
-
[3]
Fazli, M.S., Vella, S.A., Moreno, S.N. and Quinn, S., 2017. Compu- tational motility tracking of calcium dynamics in toxoplasma gondii. arXiv preprint arXiv:1708.01871
arXiv 2017
-
[4]
Fazli, M.S., Velia, S.A., Moreno, S.N. and Quinn, S., 2018, April. Unsupervised discovery of toxoplasma gondii motility phenotypes. In Biomedical Imaging (ISBI 2018), 2018 IEEE 15th International Sym- posium on (pp. 981-984). IEEE
work page 2018
-
[6]
O. Hirose et al., ”SPF-CellTracker: Tracking Multiple Cells with Strongly-Correlated Moves Using a Spatial Particle Filter,” in IEEE/ACM Transactions on Computational Biology and Bioinformatics, vol. 15, no. 6, pp. 1822-1831, 1 Nov.-Dec. 2018
work page 2018
-
[7]
A. Arasteh and B. V . Vahdat, ”Multiple cell tracking algorithm assess- ment using simulation of spermatozoa movement,” 2015 IEEE 15th International Conference on Bioinformatics and Bioengineering (BIBE), Belgrade, 2015, pp. 1-6. Accepted to 2019 IEEE International Conference on Data Science and Advanced Analytics Copyright ©2019 IEEE
work page 2015
Show all 31 references
-
[8]
A Novel Multiobject Tracking Approach in the Pres- ence of Collision and Division
Lu, Mingli et al. “A Novel Multiobject Tracking Approach in the Pres- ence of Collision and Division.” Computational and mathematical meth- ods in medicinevol. 2015 (2015): 695054. doi:10.1155/2015/695054
2015 doi
-
[9]
& Quinn, S
Li, X., Makkie, M., Lin, B., Sedigh Fazli, M., Davidson, I., Ye, J., ... & Quinn, S. (2016, August). Scalable fast rank-1 dictionary learning for fMRI big data analysis. In Proceedings of the 22nd ACM SIGKDD International Conference on Knowledge Discovery and Data Mining(pp. 5...
2016
-
[10]
”Distributed rank-1 dictionary learning: Towards fast and scalable solutions for fMRI big data analytics.” 2016 IEEE International Conference on Big Data (Big Data)
Makkie, Milad, et al. ”Distributed rank-1 dictionary learning: Towards fast and scalable solutions for fMRI big data analytics.” 2016 IEEE International Conference on Big Data (Big Data). IEEE, 2016
2016
-
[11]
”Helical motion of the cell body enhances Caulobacter crescentus motility.” Proceedings of the National Academy of Sci- ences111.31 (2014): 11252-11256
Liu, Bin, et al. ”Helical motion of the cell body enhances Caulobacter crescentus motility.” Proceedings of the National Academy of Sci- ences111.31 (2014): 11252-11256
2014
-
[12]
”How to track bacteria.” Review of Scientific Instru- ments42.6 (1971): 868-871
Berg, Howard C. ”How to track bacteria.” Review of Scientific Instru- ments42.6 (1971): 868-871
1971
-
[13]
M., et al
Taute, K. M., et al. ”High-throughput 3D tracking of bacteria on a standard phase contrast microscope.” Nature communications6 (2015): 8776
2015
-
[15]
”Scikit-learn: Machine learning in Python.” Journal of machine learning research12.Oct (2011): 2825-2830
Pedregosa, Fabian, et al. ”Scikit-learn: Machine learning in Python.” Journal of machine learning research12.Oct (2011): 2825-2830
2011
-
[16]
”The opencv library (2000).” Dr
Bradski, Gary. ”The opencv library (2000).” Dr. Dobb's Journal of Software Tools(2000)
2000
-
[17]
Saeidpour, Arash, et al. ”Parameterized Fragility Assessment of Bridges Subjected to Hurricane Events Using Metamodels and Multiple Envi- ronmental Parameters.” Journal of Infrastructure Systems 24.4 (2018): 04018031
2018
-
[18]
Dynamic textures,
G. Doretto, A. Chiuso, Y . N. Wu, and S. Soatto, “Dynamic textures,” International Journal of Computer Vision, vol. 51, no. 2, pp. 91–109, 2003
2003
-
[19]
Image-based characterization of thrombus formation in time-lapse dic microscopy,
N. Brieu, N. Navab, J. Serbanovic-Canic, W. H. Ouwehand, D. L. Stemple, A. Cvejic, and M. Groher, “Image-based characterization of thrombus formation in time-lapse dic microscopy,” Medical image analysis, vol. 16, no. 4, pp. 915–931, 2012
2012
-
[20]
Distributed Spectral Graph Methods for Analyzing Large-Scale Unstructured Biomedical Data
Quinn, Shannon. Distributed Spectral Graph Methods for Analyzing Large-Scale Unstructured Biomedical Data. Diss. University of Pitts- burgh, 2014
2014
-
[21]
”Shift-invariant dynamic tex- ture recognition.” Computer Vision–ECCV 2006 (2006): 549-562
Woolfe, Franco, and Andrew Fitzgibbon. ”Shift-invariant dynamic tex- ture recognition.” Computer Vision–ECCV 2006 (2006): 549-562
2006
-
[22]
Ravichandran, R
A. Ravichandran, R. Chaudhry and R. Vidal, ”View-invariant dynamic texture recognition using a bag of dynamical systems,” 2009 IEEE Conference on Computer Vision and Pattern Recognition, Miami, FL, 2009, pp. 1651-1657.doi: 10.1109/CVPR.2009.5206847
2009
-
[23]
”A tutorial on spectral clustering.” Statistics and computing 17.4 (2007): 395-416
V on Luxburg, Ulrike. ”A tutorial on spectral clustering.” Statistics and computing 17.4 (2007): 395-416
2007
-
[24]
”Scikit-learn: Machine learning in Python.” Journal of machine learning research 12.Oct (2011): 2825-2830
Pedregosa, Fabian, et al. ”Scikit-learn: Machine learning in Python.” Journal of machine learning research 12.Oct (2011): 2825-2830
2011
-
[25]
Fowlkes, S
C. Fowlkes, S. Belongie, F. Chung and J. Malik, ”Spectral grouping using the Nystrom method,” in IEEE Transactions on Pattern Analysis and Machine Intelligence, vol. 26, no. 2, pp. 214-225, Feb. 2004. doi: 10.1109/TPAMI.2004.1262185
2004 arXiv
-
[26]
”On Time Parameterization of a Robot Path.” IFAC- PapersOnLine 48, no
Suleiman, Wael. ”On Time Parameterization of a Robot Path.” IFAC- PapersOnLine 48, no. 3 (2015): 52-57
2015
-
[27]
T., Reaves, B., Fazli, M., Courtney, A., Quinn, F
Durden, A., Loy, A. T., Reaves, B., Fazli, M., Courtney, A., Quinn, F. D., ... & Quinn, S. P. (2018). Dynamic Social Network Modeling of Diffuse Subcellular Morphologies
2018
-
[28]
(2015, July)
Rocklin, M. (2015, July). Dask: Parallel computation with blocked algorithms and task scheduling. In Proceedings of the 14th python in science conference (No. 130-136)
2015
-
[29]
”On Kuhn's Hungarian methoda tribute from Hungary.” Naval Research Logistics (NRL) 52.1 (2005): 2-5
Frank, Andrs. ”On Kuhn's Hungarian methoda tribute from Hungary.” Naval Research Logistics (NRL) 52.1 (2005): 2-5
2005
-
[30]
Jones, E., Oliphant, T., & Peterson, P. (2001). SciPy: Open source scientific tools for Python
2001
-
[31]
Ruiz, Silvia NJ Moreno, and L
Wetzel, Dawn M., Lea Ann Chen, Felix A. Ruiz, Silvia NJ Moreno, and L. David Sibley. ”Calcium-mediated protein secretion potentiates motility in Toxoplasma gondii.” Journal of Cell Science 117, no. 24 (2004): 5739-5748
2004
Reviewed August 14, 2026 · model on record in the stance chip above.
Discussion (0). Continue with ORCID to comment.