REVIEW 4 major objections 5 minor 2 references
Pressure-Thresholded Response in Cylindrically Shocked Cyclotrimethylene Trinitramine (RDX)
T0 review · 4 major / 5 minor · reviewed 2026-08-14 · deepseek-v4-flash
Pith's one-line read Cylindrically shocked RDX switches damage mode at about 12 GPa
desk verdict Genuinely new non-planar shock data on RDX, but the headline 12 GPa threshold is an indirect estimate whose error bars overlap; worth a serious referee with strong pressure to revise the threshold claim. read the letter →
The pith
A machine-rendered reading of the paper's core claim, the machinery that carries it, and where it could break.
The reading
What carries the argument
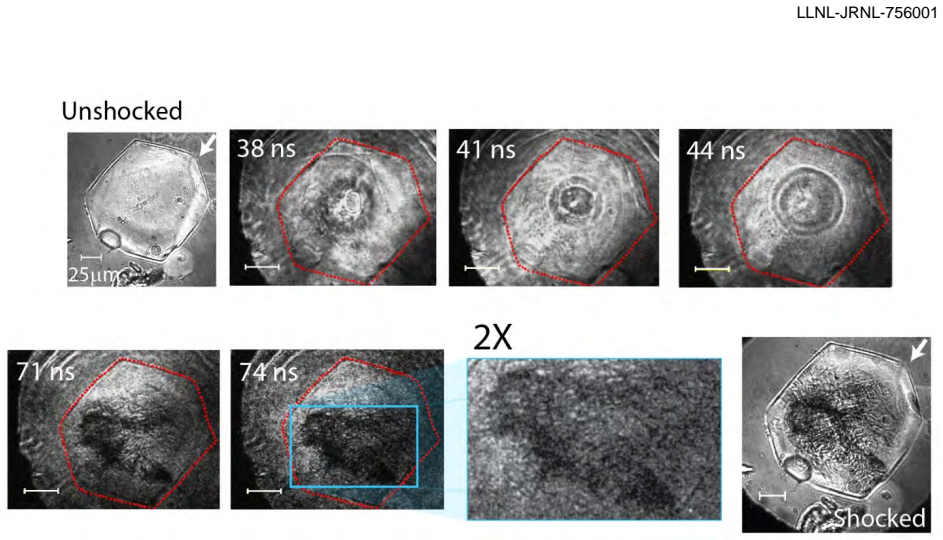
The carrying mechanism is the cylindrical waveguide shock itself: a ring-shaped laser drive launches a converging shock through a thin polystyrene film in which RDX crystals are embedded, and the shock velocity in the polymer is tracked frame by frame with a boundary-detection image processing algorithm. Pressure inside the crystal is then inferred by impedance matching on the principal Hugoniots, followed by the CCW convergence model, an analytic model of an accelerating converging shock, to estimate the pressure near the assumed 5-micrometer focal zone. The second major probe is crossed-polarizer imaging of deformation planes, which reveals birefringence changes from crystallographic deformation, together with time-resolved photoemission and ultra-small-angle X-ray scattering of recovered crystals. A spheroid void scattering model converts the scattering data into the pressure-dependent void sizes, aspect ratios, and number densities the paper reports.
What would settle it
Measure the pressure inside an embedded RDX crystal during the same waveguide shock by an independent method, such as time-resolved X-ray diffraction of the compressed lattice, and check whether the switch in photoemission and void morphology occurs at the independently measured 12 GPa; alternatively, record the emission spectrum above threshold to test whether it shows molecular gas-phase bands expected from chemistry rather than the broadband continuum of fractoluminescence.
Extended reading notes
Core claim
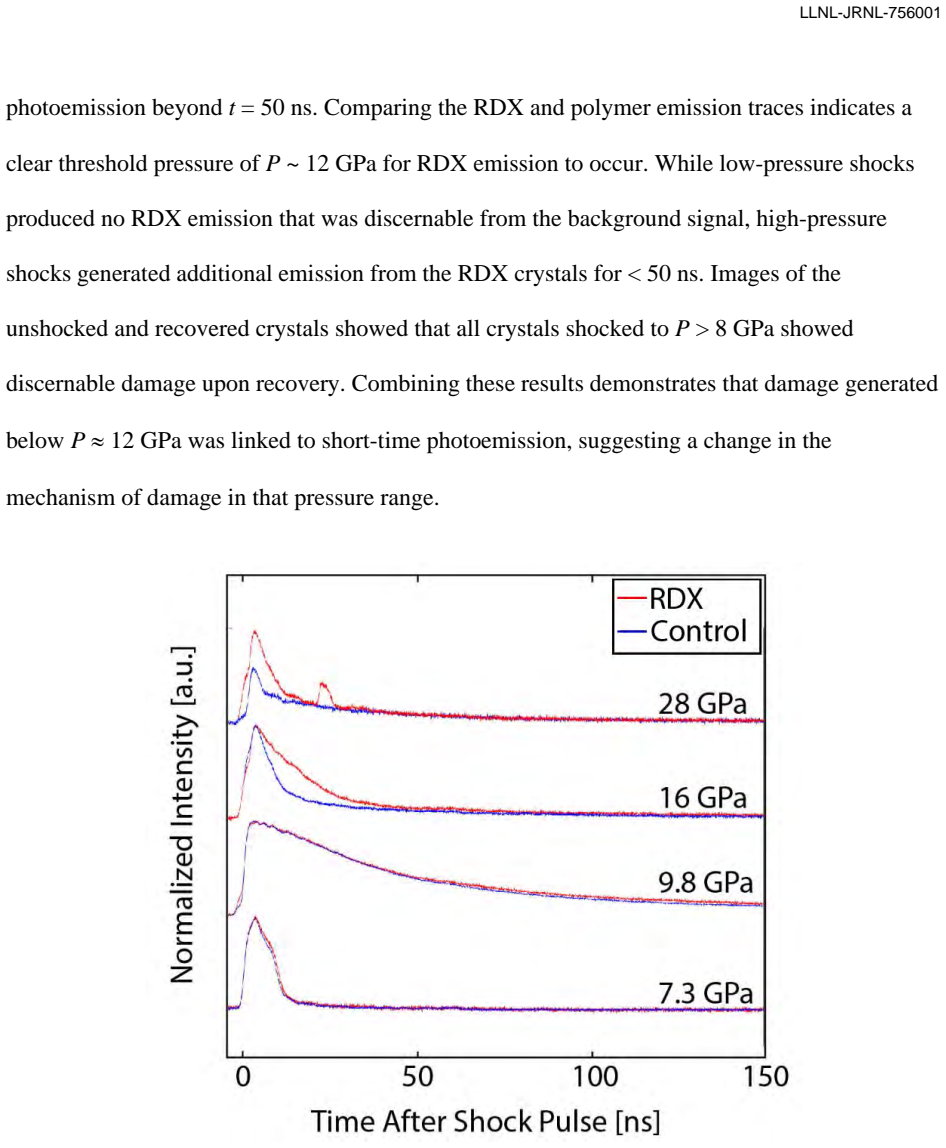
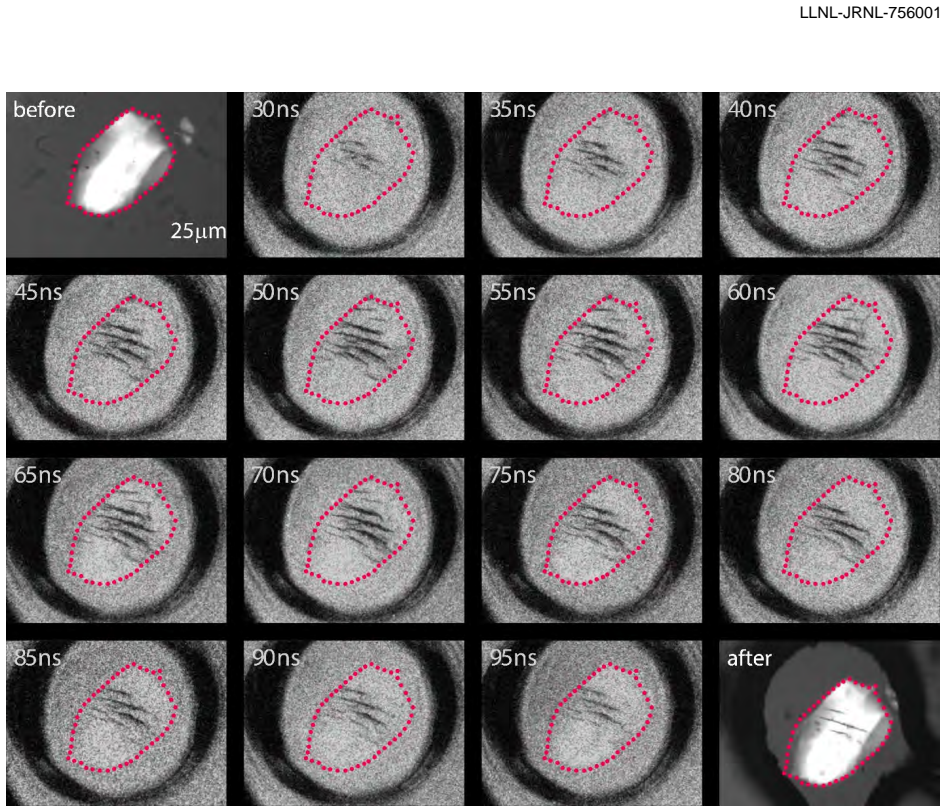
On the paper's own terms, the central discovery is a single threshold pressure of about 12 GPa at the center of convergence that separates two qualitatively distinct response modes in cylindrically shocked RDX. Below that pressure, deformation proceeds along a single set of crystallographically preferential planes and leaves behind relatively large, oblong voids. Above it, the same crystal geometry produces brief photoemission lasting tens of nanoseconds, a cascade of deformation planes in up to seven directions appearing and shifting after the shock has passed, and a dense population of small spherical voids. The paper further claims that the deformation directions are preferential and crystal-controlled even though the cylindrical shock applies stress along many crystallographic directions, and that the pore shapes, sizes, and number densities change systematically by orders of magnitude with shock pressure. These observations are presented as evidence that non-planar, converging shocks can couple chemistry and plasticity in a thresholded way, consistent with the hot-spot picture of initiation.
Load-bearing premise
The pressure inside the RDX crystal is never measured; it is estimated from the shock speed in the surrounding polymer through impedance matching and the CCW convergence model, including an assumed 5-micrometer focal spot size, so the 12 GPa threshold and the pressure-dependent void trends stand or fall with that estimate.
Editorial extensions
If this is right
- Below about 12 GPa at the focus, RDX crystals in this geometry deform along one family of planes and recover with large oblong voids; above it, they emit briefly and recover with many small spherical voids.
- Void morphology can serve as a post-shock pressure gauge for embedded RDX grains, with aspect ratio and number density changing sharply near the threshold.
- The observed preferential deformation directions show that non-planar converging shocks still select lattice-controlled planes at moderate pressure, so uniaxial-shock sliding-system predictions will not fully describe real polymer-bonded-explosive stress states.
- Above the threshold, deformation continues and reorganizes for tens of nanoseconds after the shock has passed, so initiation models must include post-shock mechanical evolution, not just the shock front itself.
Reading between the lines
- Inference: if the threshold reflects thermally activated chemistry at defects, then seeding RDX with controlled defects or changing crystal orientation should shift the apparent 12 GPa value; this is testable by comparing pristine and intentionally defected crystals.
- Inference: the same waveguide shock geometry could be applied to other energetic crystals to see whether a thresholded deformation-to-chemistry crossover is generic or specific to RDX.
- Inference: determining the crystallographic orientation of the high-pressure crystals would allow the observed seven deformation directions to be matched to specific slip or cleavage systems, something the paper's data do not yet resolve.
Signed reviews
Editorial analysis
A structured set of objections, weighed in public.
Referee Report
Summary. The paper reports an experimental study of RDX single crystals embedded in polystyrene and subjected to cylindrically converging shock waves generated by a laser-driven waveguide geometry. Using single-shot multi-frame imaging (femtosecond and nanosecond), the authors track shock propagation and subsequent deformation of the crystals; time-resolved photoemission is used to detect shock-induced emission; and SEM and USAXS are used to characterize voids in recovered crystals. The central claim is that there is a strong pressure threshold near 12 GPa at the center of convergence: below this pressure, crystals deform along a single family of parallel planes with oblong voids and no resolvable chemistry, while above it they exhibit photoemission, multiple families of deformation planes, and small spherical voids with dramatically higher number densities. The paper also claims that the deformation directions are crystallographically controlled despite the multi-directional stress of the converging shock.
Significance. The experiments are technically novel: the waveguide geometry produces cylindrical shocks in a quasi-2D sample, and the combination of single-shot multi-frame imaging with USAXS void statistics on recovered crystals provides a rare direct look at shock-induced deformation and damage in an energetic crystal. The observed qualitative separation between low-pressure planar deformation and high-pressure multi-directional deformation with photoemission is reproducible across 5-10 crystals per drive energy (stated in Section II) and is supported by the complementary imaging, emission, and scattering data. If the pressure calibration is accepted, the ~12 GPa threshold is a useful anchor for modeling hotspot-initiation and chemistry-coupled plasticity in RDX under non-planar loading. However, the quantitative threshold rests on an indirect pressure reconstruction, and the current presentation does not yet establish the threshold beyond the overlapping uncertainties of the bracketing points.
major comments (4)
- [Section II, Table 1] The claimed ~12 GPa threshold is not statistically resolved by the bracketing drive energies, because the inferred pressures at the focus are 10±3 GPa and 16±5 GPa, whose 1σ ranges overlap between 11 and 13 GPa; the central claim therefore needs either a full uncertainty propagation that includes the model inputs, additional intermediate drive energies, or a reformulated statement of the threshold as a qualitative separation rather than a precise value.
- [Section II, Table 1] The text states a shock focal spot size of 5 μm diameter, whereas the CCW calculation and Table 1 use Rs = 5 μm as a radius, a factor-of-two inconsistency in the convergence length scale that shifts all tabulated pressures; this ambiguity, together with the stated 2-10% off-Hugoniot deviation for Rs < 5 μm, is not propagated into the quoted uncertainties and must be addressed before the threshold value can be considered quantitative.
- [Section II, Table 1] Sample thickness is not independently varied across drive energies (37.5 μm at 7 GPa versus 28-34 μm at 10-28 GPa), so a thickness-dependent calibration error in the waveguide shock could create or shift the apparent pressure threshold; the authors should provide evidence that the inferred pressures are insensitive to this thickness range or otherwise deconvolve thickness from pressure.
- [Section IV, Fig. 11] For the 28 GPa crystal, the crystallographic orientation was not determined (as the text acknowledges), so the assertion that the multiple deformation directions reflect crystallographic preference is not directly supported in the high-pressure regime; the conclusions should temper this claim or the orientation should be measured for at least one high-pressure crystal.
minor comments (5)
- [Introduction] The word 'denotation' appears where 'detonation' is intended; please correct this typo.
- [Results II, Table 2] The text refers to 'Table' without a number ('As shown in Table ,'); the table number should be inserted.
- [Supplementary S4] The sentence 'While the uncapped samples had clear and unambiguous signals for the shock position (coming from the capping fluid)' appears to refer to capped samples, since uncapped samples do not contain capping fluid; please correct this apparent inversion.
- [Fig. 6 caption] The caption states that emission amplitudes are normalized to the same height across pressures; because this normalization removes relative intensity information, it should be stated prominently in the main text near the threshold discussion, not only in the caption.
- [Section I, Fig. 1] The distinction between capped and uncapped geometries would be clearer if Figure 1 included a schematic of the capping layer; the current text description is easy to overlook amid the optical layout.
Circularity Check
No significant circularity: the threshold pressure and response trends are extracted from independent measurements, with only legitimate calibration self-citations.
full rationale
The paper's central claims—a ~12 GPa threshold separating single-mode planar deformation from chemistry-coupled multi-plane dynamics, preferential deformation directions, and pressure-dependent void morphology—are not derived by fitting to the target conclusions. The pressure scale is reconstructed from a measured polystyrene shock velocity via impedance matching along literature principal Hugoniots and the CCW convergence model, with focal-spot and off-Hugoniot corrections taken from prior work. This is a calibration chain, not a self-referential derivation: the threshold is located by comparing independently measured photoemission, imaging, and USAXS responses across four drive energies. Self-citations (refs 41–44 and 49) support the waveguide shock launching, LADA image processing, and release-time calibration, but none of these citations supplies the threshold value, the deformation-plane multiplicities, or the void statistics. The USAXS fits use SEM images only for initial fitting parameters of a scattering model, which is standard characterization practice and does not presuppose the pressure threshold. The largest genuine weakness is that the 12 GPa value is bracketed by 10 ± 3 and 16 ± 5 GPa, so the precise threshold is underdetermined; however, that is an uncertainty/accuracy concern, not circularity. No equation in the paper is shown to reduce to its own inputs, and no fitted parameter is renamed as a prediction. The derivation chain is therefore self-contained with respect to the circularity patterns considered here.
Assumptions & free parameters
free parameters (6)
- Polystyrene acoustic velocity C0 =
1.1 km/s
- Shock focal spot size at convergence =
5 μm
- USAXS void mean radius, P=10 GPa =
497 ± 8 nm
- USAXS void mean radius, P=16 GPa =
193 ± 12 nm
- USAXS void mean radius, P=28 GPa =
30.8 ± 12 nm
- USAXS spheroid aspect ratios and volume fractions =
6.1/0.0064, 2.1/0.0085, 1.3/0.0071
assumptions (5)
- domain assumption Impedance matching along principal Hugoniots relates polymer shock velocity to RDX pressure.
- domain assumption CCW model accurately describes accelerating cylindrical shock convergence in the waveguide.
- domain assumption The linear features imaged through crossed polarizers are deformation planes in RDX, not polymer or substrate artifacts.
- domain assumption The scattering baseline from an unshocked crystal represents the matrix scattering for shocked crystals.
- standard math Standard small-angle scattering theory in the dilute limit applies.
Cite this review
Pith. "Pith review of Pressure-Thresholded Response in Cylindrically Shocked Cyclotrimethylene Trinitramine (RDX)." pith.science (2026). https://pith.science/paper/RI2LEOJF
@misc{pith2026190803785,
  author       = {Pith},
  title        = {Pith review of: Pressure-Thresholded Response in Cylindrically Shocked Cyclotrimethylene Trinitramine (RDX)},
  year         = {2026},
  howpublished = {\url{https://pith.science/paper/RI2LEOJF}},
  note         = {Machine review of arXiv:1908.03785}
}
read the original abstract
We demonstrate a strongly thresholded response in cyclotrimethylene trinitramine (RDX) when it is cylindrically shocked using a novel waveguide geometry. Using ultrafast single-shot multi-frame imaging, we demonstrate that <100-{\mu}m diameter single crystals of RDX embedded in a polymer host deform along preferential planes for >100 ns after the shock first arrives in the crystal. We use in-situ imaging and time-resolved photoemission to demonstrate that short-lived chemistry occurs with complex deformation pathways. Using scanning electron microscopy and ultrasmall-angle X-ray scattering, we demonstrate that the shock-induced dynamics leave behind porous crystals, with pore shapes and sizes that change significantly with shock energy. A threshold pressure of ~ 12 GPa at the center of convergence separated the single-mode planar crystal deformations from the chemistry-coupled multi-plane dynamics at higher pressures. Our observations indicate preferential directions for deformation for our cylindrically shocked system, despite the applied stress along many different crystallographic planes.
Figures


Figures from the paper (7 more)



Reference graph
Works this paper leans on
-
[1]
(1) Ilavsky, J.; Zhang, F.; Andrews, R. N.; Ku zmenko, I.; Jemian, P. R.; Levine, L. E.; Allen, A. J. Development of Combined Microstructure and Structure Characterization Facility for in Situ and Operando Studies at the Advanced Photon Source. J. Appl. Crystallogr. 2018, 51, 867–882. (2) Zhang, F.; Ilavsky, J.; Long, G. G.; Quintana, J. P. G.; Allen, A. ...
work page 2018
-
[2013]
LLNL-JRNL-756001 (5) Ilavsky, J.; Jemian, P. R. Irena: Tool Suite for Modeling and Analysis of Small-Angle Scattering. J. Appl. Crystallogr. 2009, 42, 347–353. (6) Dresselhaus-Cooper, L.; Gorfain, J. E.; Key, C. T.; Ofori-Okai, B. K.; Ali, S. J.; Martynowych, D. J.; Gleason, A.; Kooi, S.; Nelson, K. A. Development of Single-Shot Multi-Frame Imaging of Cyl...
work page 2009
Reviewed August 14, 2026 · model on record in the stance chip above.
Discussion (0). Continue with ORCID to comment.