REVIEW 3 major objections 5 minor 29 references
Transcriptional Response of SK-N-AS Cells to Methamidophos
T0 review · 3 major / 5 minor · reviewed 2026-08-14 · deepseek-v4-flash
Pith's one-line read Methamidophos exposure in SK-N-AS neuroblastoma cells triggers unfolded protein response, cAMP response, calcium ion processes, and cell-cell signaling, and the data confirm the expected acetylcholine buildup.
desk verdict A useful exploratory dataset and a first look at time-warp causal inference, but the process-level claims rest on technical triplicates and ad hoc filters—worth a serious referee, not a headline. read the letter →
The pith
A machine-rendered reading of the paper's core claim, the machinery that carries it, and where it could break.
The reading
What carries the argument
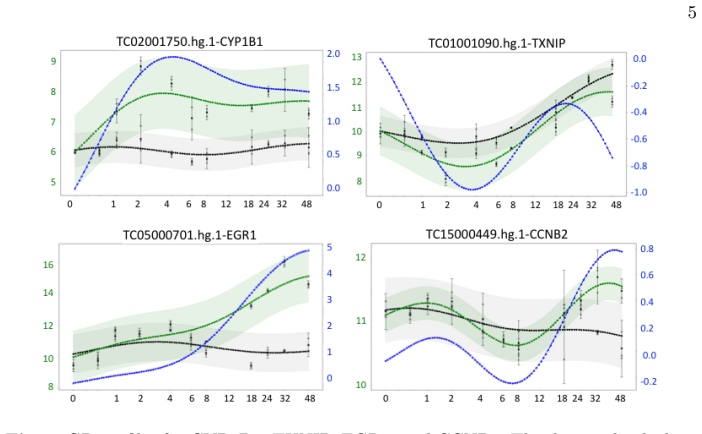
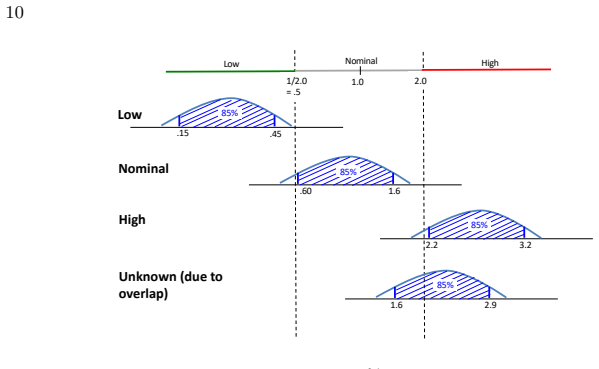
The carrying mechanism is a multi-stage analysis pipeline built on Gaussian-process time profiles. Transcripts are represented by smoothed log2 ratio profiles sampled at 100 time points, clustered by k-means after PCA compression, and ranked by PCA loadings, autoencoder reconstruction quality, and GAN discriminator confidence (atypical vs typical). A 194-transcript working set, Top20X, is defined as transcripts ranked in the top 20 by at least one ranking function that also show significant change, meaning at least 1 log2 fold change or 1 SD separation at 15 sampled times. This set feeds process-annotation scanning and two causality-inference tools: Siamese convolutional networks for undirected causality plus lag direction, and time-warp causal inference that aligns high/low/nominal event sequences with a Needleman-Wunsch-style dynamic program and bootstrap fold-change confidence. The convergence of the ranking filters and the two causality methods on overlapping transcripts is what supports the process-level conclusions.
What would settle it
Repeat the exposure with independent biological replicates (for example, six per time point) and check whether the 18–48 h upregulation of HSPA5, DDIT3, FOS, JUN, NR4A1, and VGF and the 18 h downregulation of CHRM3, CHRNA3, CHRNB2, GNA11, and GNA12 reappear with the same sign and timing; a failure to replicate would collapse the central process claims. Directly measuring acetylcholine accumulation in the culture medium would independently test the buildup assumption.
Extended reading notes
Core claim
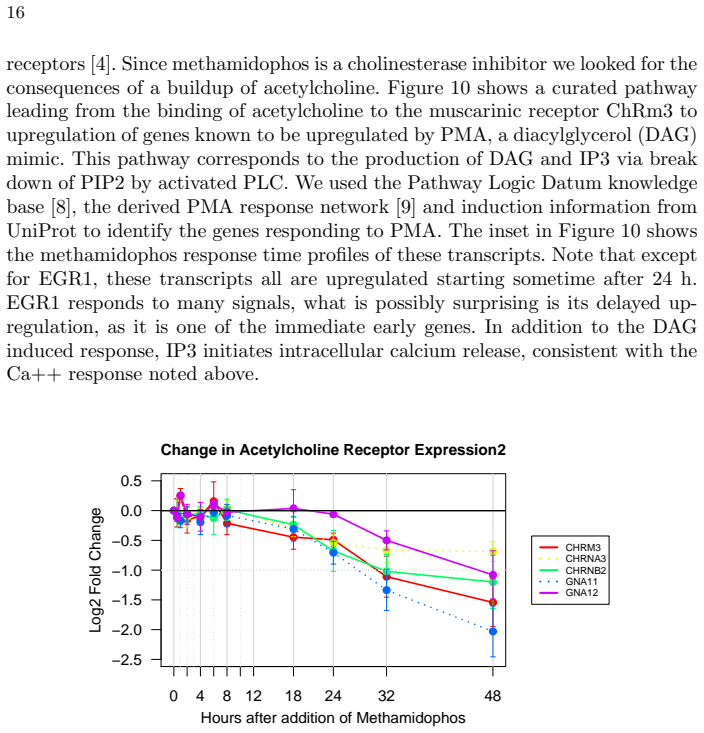
The central claim is that the transcriptomic response of SK-N-AS cells to methamidophos is organized around late upregulation of unfolded-protein-response and cAMP-responsive genes, coordinated calcium-ion expression changes, and a cell-cell signaling signature, alongside the expected consequence of acetylcholine accumulation. UPR transcripts such as HSPA5, DDIT3, PPP1R15A, and DNAJB1 rise mostly from 24–32 h onward; forskolin-defined cAMP-responsive genes (FOS, JUN, NR4A1, GDF15, VGF, PER1, ZFP36, and others) also turn upward around 24 h; calcium-related transcripts split into an upregulated group (DDIT3, FOS, HSP90B1, HSPA5, JUN, ITPKB, and others) and a downregulated group (EEF2K, HSPH1, RGS4, RIMS3, S1PR3, and others). Acetylcholine receptors CHRM3, CHRNA3, CHRNB2, and GPCR partners GNA11 and GNA12 are downregulated from about 18 h, and cyclin profiles indicate G2 arrest from 32 h. The paper claims its causal-inference algorithms recover a known DDIT3-to-GDF15 relation and propose additional edges that remain unverified.
Load-bearing premise
The analysis assumes that three technical replicates per condition and time point are sufficient to estimate separation and fold-change significance; if biological variability between independent cultures is comparable to or larger than this technical noise, some called expression changes and inferred causal edges could be noise.
Editorial extensions
If this is right
- If the claims hold, UPR, cAMP response, calcium ion handling, and cell-cell signaling become the prioritized hypotheses for methamidophos' broader mechanism of action in neuronal cells, guiding targeted protein and metabolite measurements.
- The 18 h onset of receptor downregulation and the 32 h G2 arrest give temporal landmarks for designing follow-up experiments: the early window (0.5–8 h) is relatively quiet, while the key process signals accumulate by 24–48 h.
- The recovered DDIT3-to-GDF15 edge, if confirmed as causal, links ER stress to the secreted stress signal GDF15 in this cell type, connecting the UPR and cell-cell signaling candidate processes.
- The two causality algorithms produce complementary network structures (short clustered chains vs longer sparser chains), so jointly used they can prioritize transcript pairs for experimental validation.
Reading between the lines
- A testable extension would be to run the same pipeline on a positive control (for example, tunicamycin for UPR or forskolin for cAMP) in SK-N-AS cells; the false-positive rate of the anomaly and causality rankings under known perturbations would calibrate how much of the methamidophos signal is specific.
- The suspected 1 h spike in the raw profiles implies that the choice between raw and GP-smoothed profiles can flip biological conclusions; comparing both views on the same transcript sets is a cheap robustness check that the paper only partially explores.
- Because the cell-cell signaling candidates (CCL7, CCL13, CCR5, IFNA2, and others) rest almost entirely on the possibly artifactual 1 h spike, direct measurement of secreted factors would be the decisive test of whether cell-cell signaling is a genuine response.
- The inferred causal edges could be sharpened by promoter binding-site analysis, such as checking whether BHLHE40 and FOS binding sites overlie the UPR and cAMP responders, turning the network predictions into sequence-level hypotheses.
Signed reviews
Editorial analysis
A structured set of objections, weighed in public.
Referee Report
Summary. This paper describes a data-analysis workflow for time-series transcriptomics and applies it to SK-N-AS human neuroblastoma cells exposed to the acetylcholinesterase inhibitor methamidophos. The workflow combines Gaussian-process (GP) modeling of expression profiles, PCA and k-means clustering, autoencoder and GAN-based anomaly rankings, a transcript-selection predicate called Top20X, and two causality-inference methods (Siamese convolutional networks and time-warp alignment). On the basis of 10 time points (0.5-48 h) with three technical replicates per condition, the authors report candidate mechanism-of-action processes: unfolded protein response (UPR), cAMP response, calcium-ion-related processes, and cell-cell signaling. They also report downregulation of acetylcholine receptors after 18 h, which they interpret as a consequence of acetylcholine buildup, and they present inferred causal edges among selected transcripts, including a known DDIT3-GDF15 relation. The paper is framed as both a biological application and a demonstration of novel analysis algorithms.
Significance. If the methodological pipeline is robust, the paper offers a useful data-driven approach for generating mechanism-of-action hypotheses from time-series omics data without requiring a prior interaction network. The strengths of the manuscript include the explicit predicate definitions in Appendix 6.1, the use of multiple independent ranking and inference methods, the reporting of validation accuracy on synthetic data for the Siamese causality models, and an honest discussion of the uncertainty of inferred causal edges. The authors also make a Top20X summary spreadsheet available. However, the biological conclusions are only as strong as the transcript-level significance calls, and those calls rest entirely on three technical replicates per condition and time point. The paper would be more convincing if the process-level and causal claims were either supported by biological replication or explicitly reframed as hypothesis-generating results requiring independent validation.
major comments (3)
- [Sections 2.1, 2.2, 2.5, and 6.1] The statistical significance machinery is built exclusively on three technical replicates per condition and time point. The GP confidence bands in Section 2.2 and the bootstrap fold-change distributions in Section 2.5 resample those same three readings, so the sep(d,n), o-significant, upby, and dnby predicates quantify only measurement noise, not biological variability. Because Top20X and the subsequent Panther overrepresentation results (Appendix 6.2) and process lists (Section 3.2) all depend on these transcript-level significance calls, the process-level claims in the abstract are not protected against biological noise. The authors should either add biological replication or a variance-component estimate, or explicitly reclassify all process-level and network-level conclusions as hypotheses requiring independent confirmation.
- [Abstract and Section 3.3] The abstract states that the data 'confirmed the expected consequence of acetylcholine buildup,' but Section 3.3 is titled 'Conjectured acetylcholine build up' and the evidence is indirect: expression profiles of PMA-responsive genes, downregulation of CHRM3/CHRNA3/CHRNB2 and GNA11/GNA12, and a curated pathway model. No direct measurement of acetylcholine or receptor activation is reported. The word 'confirmed' overstates the strength of the evidence; 'consistent with' would be more accurate, and the claim should be labeled as a candidate consequence.
- [Sections 2.4 and 3.5] The causal networks inferred in Section 3.5 are produced by models trained on synthetic data generated from GP templates with mixin parameter m=4; the reported accuracy (0.75 for edge existence, 0.72 for direction) is validated on synthetic data only, not on the experimental methamidophos data. The paper does acknowledge this in the discussion ('We have not yet found evidence supporting or disagreeing with the other hypothesized relations'), but the presentation of 'causal relations' in the abstract and Section 3.5 could easily be read as established biological causality. Please add an explicit caveat at the point of presentation that these are computational hypotheses whose biological interpretation requires experimental follow-up.
minor comments (5)
- [Section 3.2] The text 'see Appendix 15 for details' should refer to Appendix 6.3 (cell-cell signaling), not 'Appendix 15'.
- [Section 6.1] The sentence 'We use three models parameterized by the feature window size (Section ??).' contains an unresolved cross-reference; it should point to Section 2.3.
- [Throughout] The spelling of the database name is inconsistent: 'PatherDB' appears in Section 2 and the abstract/Introduction, while 'PantherDB' is used elsewhere; please unify.
- [References] Reference [5] contains a typo: 'a wroldwide hub' should be 'a worldwide hub'.
- [Data availability] No raw microarray data accession number or repository deposit is provided; for reproducibility, the authors should deposit the raw data in an appropriate public repository (e.g., GEO or ArrayExpress).
Circularity Check
No significant circularity: the analysis applies prior methods and external annotations to a new dataset, and no central claim is equivalent to its inputs by construction.
full rationale
The paper's derivation chain is self-contained in the sense required for a circularity finding. The GP profiles, anomaly rankings, and causal edges are computed from the new methamidophos transcriptomic data, while the candidate biological processes (UPR, cAMP, calcium, cell-cell signaling) are identified by mapping the selected transcripts to external annotations from UniProt, PantherDB, Pathway Logic, and published drug-response gene lists. The method citations [19] and [24] are prior work by overlapping author groups, but they are applied here as tools developed and validated on different cell types, drugs, and synthetic data; they are not invoked as the source of the biological conclusion. The Siamese network is trained on synthetic pairs generated from GP templates and then applied to the real GP profiles, and the timewarp algorithm uses fixed bootstrap thresholds; neither algorithm is fitted to the target result, and the inferred causal edges are explicitly presented as hypotheses requiring further work. The only notable weakness is statistical rather than circular: significance filters rest on three technical replicates per condition and time point, so biological variability is not quantified. That is a correctness-risk concern, not a reduction of the conclusion to its input by construction, and the paper itself labels the replicates as technical. No step was found in which a prediction is equivalent to a fitted parameter, a cited uniqueness theorem is doing the argumentative work, or a known result is merely renamed.
Assumptions & free parameters
free parameters (7)
- Top20X rank threshold (top 20) =
20
- Minimum signal filter for Top20X (1sd15/udby1) =
1 SD separation at 15 of 100 GP time points, or log2 fold change >= 1
- Number of k-means clusters =
128
- GAN hyperparameters =
window sizes 21, 41, 61; feature dims 20/50; 100000 epochs
- mixin parameter m for synthetic causality training =
4
- Time warp confidence level and fold-change threshold =
85% confidence; linear fold change 2.0
- Causality graph cutoff probability and lag direction threshold =
not reported numerically
assumptions (6)
- domain assumption Technical triplicates are sufficient to estimate expression variability for significance testing
- domain assumption Gaussian process models yield reliable confidence bands for treated and control profiles
- domain assumption Synthetic time series generated from GP templates are representative of real causal relations
- domain assumption GO annotations and pathway databases correctly associate transcripts with biological processes
- domain assumption The 1h upregulation spike is a possible experimental artifact
- domain assumption Bootstrap resampling with replacement from three readings produces a meaningful fold-change distribution
Cite this review
Pith. "Pith review of Transcriptional Response of SK-N-AS Cells to Methamidophos." pith.science (2026). https://pith.science/paper/GFUGGP2B
@misc{pith2026190803841,
  author       = {Pith},
  title        = {Pith review of: Transcriptional Response of SK-N-AS Cells to Methamidophos},
  year         = {2026},
  howpublished = {\url{https://pith.science/paper/GFUGGP2B}},
  note         = {Machine review of arXiv:1908.03841}
}
read the original abstract
Transcriptomics response of SK-N-AS cells to methamidophos (an acetylcholine esterase inhibitor) exposure was measured at 10 time points between 0.5 and 48 h. The data was analyzed using a combination of traditional statistical methods and novel machine learning algorithms for detecting anomalous behavior and infer causal relations between time profiles. We identified several processes that appeared to be upregulated in cells treated with methamidophos including: unfolded protein response, response to cAMP, calcium ion response, and cell-cell signaling. The data confirmed the expected consequence of acetylcholine buildup. In addition, transcripts with potentially key roles were identified and causal networks relating these transcripts were inferred using two different computational methods: Siamese convolutional networks and time warp causal inference. Two types of anomaly detection algorithms, one based on Autoencoders and the other one based on Generative Adversarial Networks (GANs), were applied to narrow down the set of relevant transcripts.
Figures

Figures from the paper (12 more)




Reference graph
Works this paper leans on
-
[1]
al.: Tensorflow: A system for large-scale machine learning
Abadi, M., et. al.: Tensorflow: A system for large-scale machine learning. In: Pro- ceedings of the 12th USENIX Conference on Operating Systems Design and Im- plementation. pp. 265–283. OSDI’16, USENIX Association (2016)
work page 2016
-
[2]
al.: Essential cell biology (2nd ed.)
Alberts, B., et. al.: Essential cell biology (2nd ed.). Garland Science, New York (2004)
work page 2004
-
[3]
In: Cowan, J.D., Tesauro, G., Alspec- tor, J
Bromley, J., Guyon, I., LeCun, Y., S¨ ackinger, E., Shah, R.: Signature verification using a ”siamese” time delay neural network. In: Cowan, J.D., Tesauro, G., Alspec- tor, J. (eds.) Advances in Neural Information Processing Systems 6, pp. 737–744. Morgan-Kaufmann (1994)
work page 1994
-
[4]
Curr Neuropharmacol 11(3), 315–335 (May 2013)
Colovi, M.B., Krsti, D.Z., Lazarevi-Pati, T.D., Bondi, A.M., Vasi, V.M.: Acetyl- cholinesterase inhibitors: pharmacology and toxicology. Curr Neuropharmacol 11(3), 315–335 (May 2013)
work page 2013
-
[5]
Nucleic Acids Research 47, D506–D515 (2019)
Consortium, U.: Uniprot: a wroldwide hub of protein knowledge. Nucleic Acids Research 47, D506–D515 (2019)
work page 2019
-
[6]
al.: Generative adversarial nets
Goodfellow, I.J., et. al.: Generative adversarial nets. In: Proceedings of the 27th International Conference on Neural Information Processing Systems - Volume 2. pp. 2672–2680. NIPS’14, MIT Press (2014)
work page 2014
-
[7]
Journal of Biological Chemistry 289(3), 1402–14 (2014)
J.N., R., E., G.J.: Binding of human nucleotide exchange factors to heat shock protein 70 (hsp70) generates functionally distinct complexes in vitro. Journal of Biological Chemistry 289(3), 1402–14 (2014)
work page 2014
-
[8]
Knapp, M.: Pla datums (2019), pl.csl.sri.com/datumkb.html, last accessed 2019 March 14
work page 2019
Show all 29 references
-
[9]
Knapp, M.: STM8: A pathway logic model of intracellular signal transduction (2019), pl.csl.sri.com/online.html, last accessed 2019 March 14
2019
-
[10]
Bioinformatics 30(4), 523–530 (2014)
Kramer, A., Green, J., Pollard, J., Tugendreich, S.: Causal analysis approaches in ingenuity pathway analysis. Bioinformatics 30(4), 523–530 (2014)
2014
-
[11]
Biochemical and Biophysical Research Communications 498, 388–394 (2018)
Li, D., Zhang, H., Zhong, Y.: Hepatic gdf15 is regulated by chop of the unfolded protein response and alleviates nafld progression in obese mice. Biochemical and Biophysical Research Communications 498, 388–394 (2018)
2018
-
[12]
Experimental Biology and Medicine 237, 14131423 (2012)
Li, T., Zhao, H., Hung, G.C., Han, J., Tsai, S., Li, B., Zhang, J., Puri, R.K., Lo, S.C.: Differentially expressed genes and pathways induced by organophosphates in human neuroblastoma cells. Experimental Biology and Medicine 237, 14131423 (2012)
2012
-
[13]
al.: Panther version 11: expanded annotation data from gene ontol- ogy and reactome pathways, and data analysis tool enhancements
Mi, H., et. al.: Panther version 11: expanded annotation data from gene ontol- ogy and reactome pathways, and data analysis tool enhancements. Nucleic Acids Research 45(D1), D183–D189 (2017)
2017
-
[14]
Journal of Molecular Biology 48(3), 443–453 (1970)
Needleman, S.B., Wunsch, C.D.: A general method applicable to the search for sim- ilarities in the amino acid sequence of two proteins. Journal of Molecular Biology 48(3), 443–453 (1970)
1970
-
[15]
Nucleic Acids Research 46(6), e34 (2018)
Noh, H., Shoemaker, J.E., Gunawan, R.: Network perturbation analysis of gene transcriptional profiles reveals protein targets and mechanism of action of drugs and influenza a viral infection. Nucleic Acids Research 46(6), e34 (2018)
2018
-
[16]
al.: Identification of potential stroke targets by lentiviral vector mediated overexpression of HIF-1 alpha and HIF-2 alpha in a primary neuronal model of hypoxia
Ralph, G.S., et. al.: Identification of potential stroke targets by lentiviral vector mediated overexpression of HIF-1 alpha and HIF-2 alpha in a primary neuronal model of hypoxia. J. Cerebral Blood Flow Metabolism 24(2), 245–58 (2004)
2004
-
[17]
al.: Uncovering a macrophage transcriptional program by in- tegrating evidence from motif scanning and expression dynamics
Ramsey, S.A., et. al.: Uncovering a macrophage transcriptional program by in- tegrating evidence from motif scanning and expression dynamics. PLOS Com- putational Biology 4(3), 1–25 (2008), https://doi.org/10.1371/journal.pcbi. 1000021 24
2008 doi
-
[18]
Bioscience, Biotechnology, and Biochemistry 77(4), 729–35 (2013)
Shinjo, S., Mizotani, Y., Tashiro, E., Imoto, M.: Comparative analysis of the expres- sion patterns of upr-target genes caused by upr-inducing compounds. Bioscience, Biotechnology, and Biochemistry 77(4), 729–35 (2013)
2013
-
[19]
CoRR abs/1905.02291 (2019), http://arxiv.org/abs/1905.02291
Stehr, M.O., Avar, P., Korte, A.R., Parvin, L., Sahab, Z.J., Bunin, D.I., Knapp, M., Nishita, D., Poggio, A., Talcott, C.L., Davis, B.M., Morton, C.A., Sevinsky, C.J., Zavodszky, M.I., Vertes, A.: Learning causality: Synthesis of large-scale causal networks from high-dimension...
2019 arXiv
-
[20]
Talcott, C.: Summary of top20x transcripts in response to methamidophos (2019), http://www.csl.sri.com/users/clt/XYZ/sumG-top20ud1s1x-u6.xlsx
2019
-
[21]
TensorFlow Probability: A library for probabilistic reasoning and statistical anal- ysis: https://www.tensorflow.org/probability
-
[22]
In: International Conference on Learning Representa- tions (2017)
Tran, D., Hoffman, M.D., Saurous, R.A., Brevdo, E., Murphy, K., Blei, D.M.: Deep probabilistic programming. In: International Conference on Learning Representa- tions (2017)
2017
-
[23]
al.: Integrative systems biology approach to identify mechanisms of action (2016), abstract and poster US HUPO 2016 Conference
Vertes, A., et. al.: Integrative systems biology approach to identify mechanisms of action (2016), abstract and poster US HUPO 2016 Conference
2016
-
[24]
al.: Inferring mechanism of action of an unknown compound from time series omics data
Vertes, A., et. al.: Inferring mechanism of action of an unknown compound from time series omics data. In: Ceska, M., Safranek, D. (eds.) Computational Methods in Systems Biology. LNBI, vol. 11095. Springer (2018)
2018
-
[25]
Physiolical Reviews 87(3), 965–1010 (2007)
Willoughby, D., Cooper, D.M.F.: Organization and Ca++ regulation of adenylyl cyclases in camp microdomains. Physiolical Reviews 87(3), 965–1010 (2007)
2007
-
[26]
al.: Elucidating compound mechanism of action by network pertur- bation analysis
Woo, J.H., et. al.: Elucidating compound mechanism of action by network pertur- bation analysis. Cell 162(2), 441–451 (2015)
2015
-
[27]
F1000Research (2014)
Wright, D., Angus, T., Enright, A., Freeman, T.: Visualisation of biopax networks using biolayout express3d. F1000Research (2014)
2014
-
[28]
Xu, C., Bailly-Maitre, B., Reed, J.C.: Endoplasmic reticulum stress: cell life and death decisions. J. Clinical Investigation 115(10), 2656–64 (2005)
2005
-
[29]
kmr27” identifiesk-means ratio cluster 27. “(+32:*)
Zak, D.E., Aderem, A.: Systems biology of innate immunity. Immunology Review. 227(1), 264282 (2009) 25 6 Appendix 6.1 Predicate details We define a number of predicates used to select subsets of transcripts and com- pare them. Roughly they concern qualitative measures of signifi...
2009
Reviewed August 14, 2026 · model on record in the stance chip above.
Discussion (0). Continue with ORCID to comment.