REVIEW 3 major objections 5 minor 45 references
Advancing characterisation with statistics from correlative electron diffraction and X-ray spectroscopy, in the scanning electron microscope
T0 review · 3 major / 5 minor · reviewed 2026-08-14 · deepseek-v4-flash
Pith's one-line read This paper claims that combining EDS and EBSD signals in a single weighted principal component analysis, followed by VARIMAX rotation, improves phase characterisation in the scanning electron microscope by reducing a 40,000-point map to a…
desk verdict Weighted PCA fusion of EBSD and EDS is a genuine, well-documented step forward, but the variance-threshold selection can miss the smallest phases; the authors are honest about this, and the paper deserves serious referee attention. read the letter →
The pith
A machine-rendered reading of the paper's core claim, the machinery that carries it, and where it could break.
The reading
What carries the argument
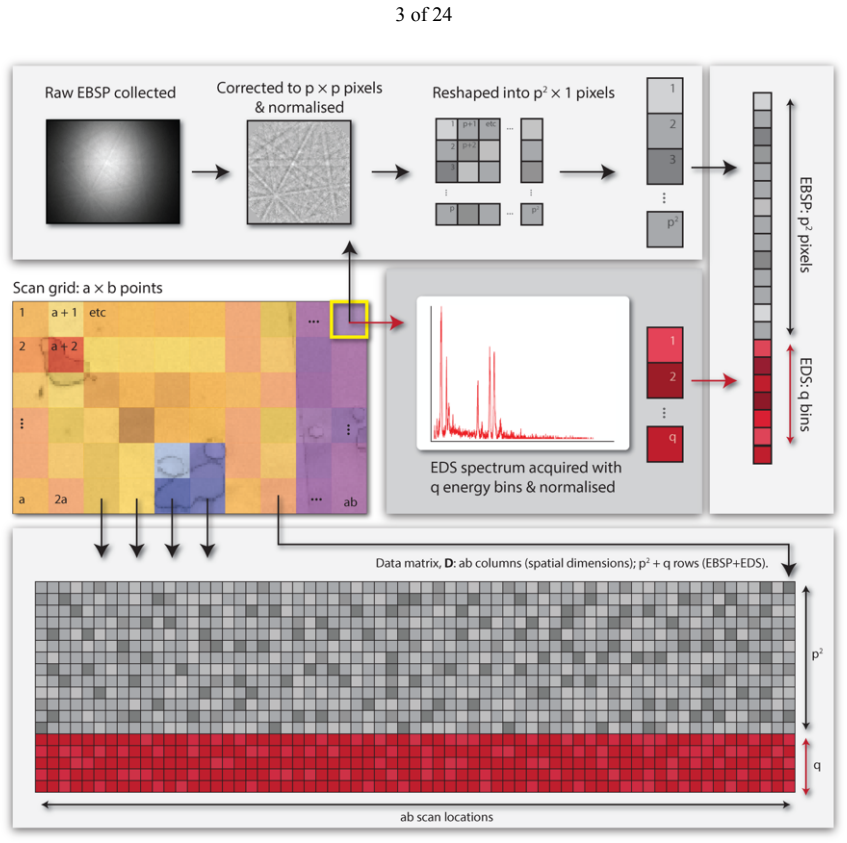
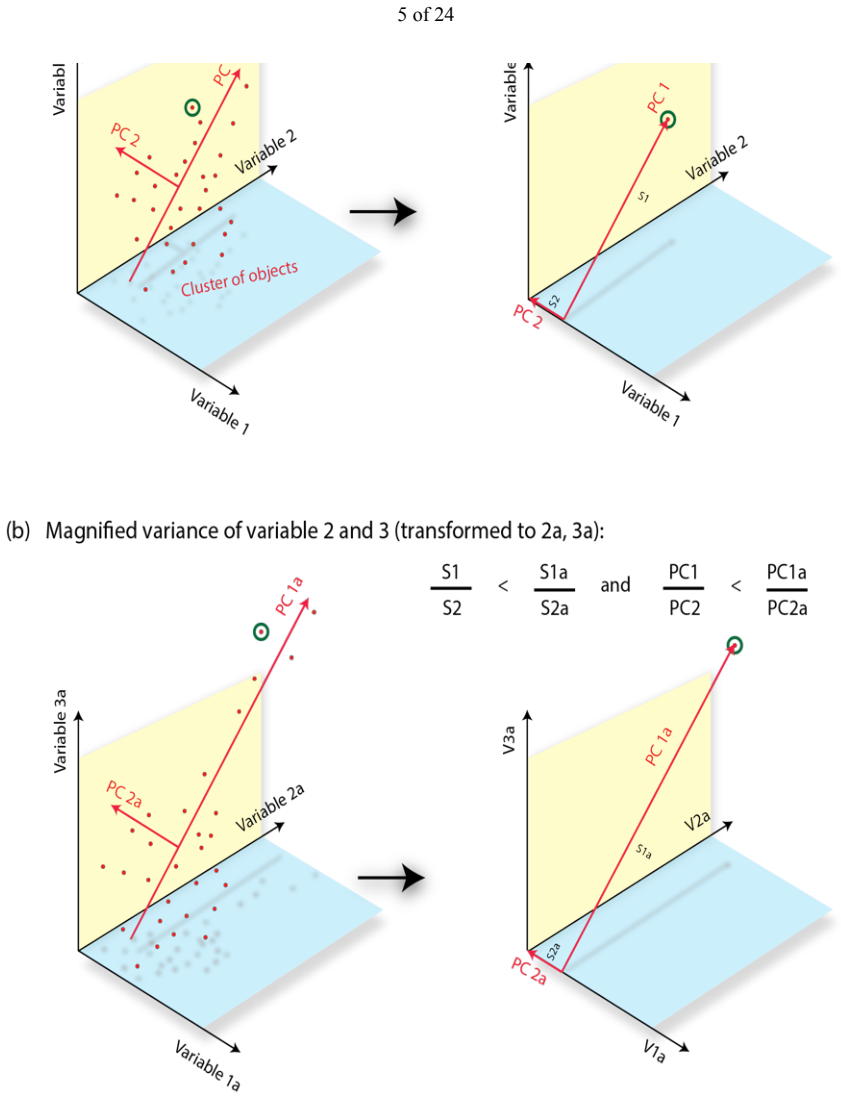
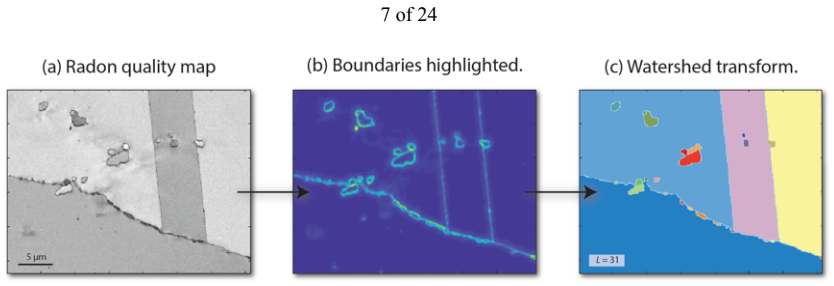
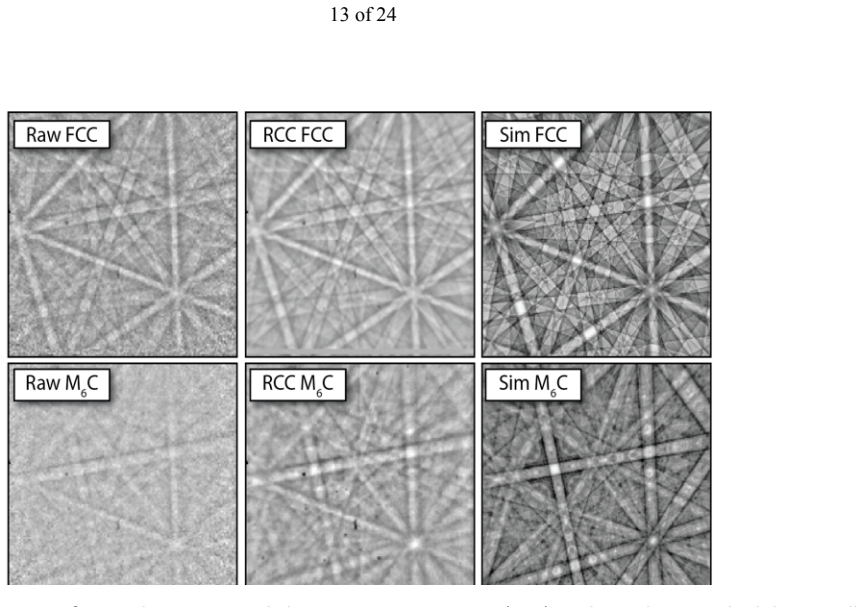
The load-bearing object is the data matrix $\mathbf{D}$, whose rows are the $p^2$ pixels of each background-corrected EBSD pattern plus the $q$ energy bins of each background-subtracted EDS spectrum, and whose columns are the scan points. Each column is standard-deviation normalised separately for the EBSD and EDS blocks, and the EBSD rows are then scaled by a weighting parameter $w$ while the EDS rows are scaled by one; a singular value decomposition yields $n$ principal components, and a VARIMAX rotation redistributes variance among them. The rows of the rotated matrix are the rotated characteristic components: the first $p^2$ entries form an RC-EBSP and the final $q$ entries form an RC-spectrum. The paper selects $n$ by a variance tolerance $t$ (retaining components whose variance contribution exceeds $t$) or by watershed grain counting, and selects $w$ by minimising the standard deviation of the quadrature-combined cross-correlation metric $\chi_{\mathrm{comb}}$ between measured and characteristic signals. This machinery is what lets a 40,000-point map collapse to 35 characteristic pairs while preserving the weak carbide signals.
What would settle it
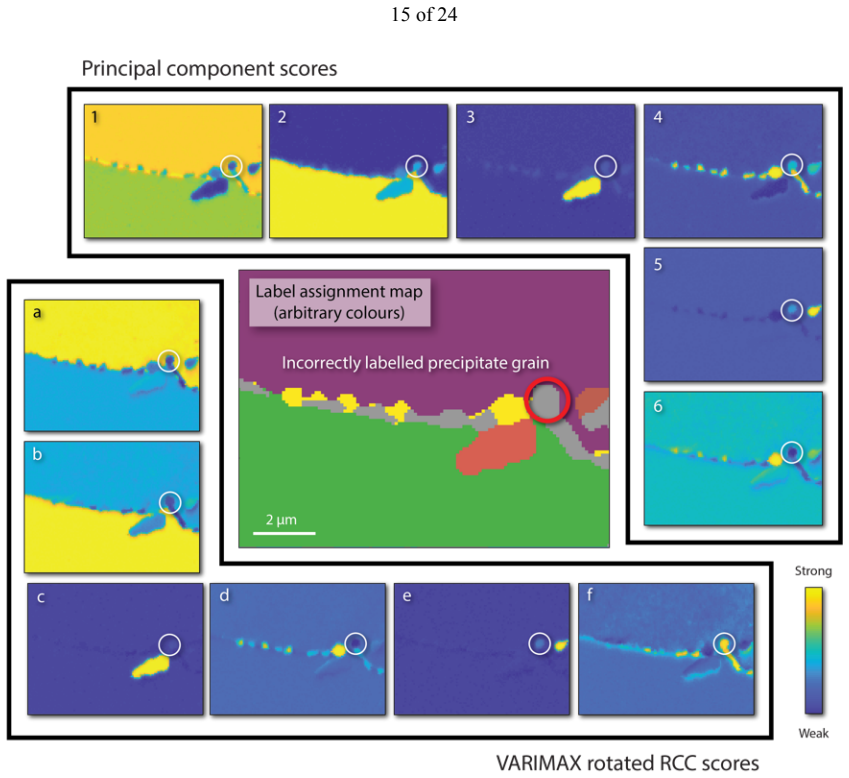
Take a map with a small MC-carbide precipitate confirmed by an independent method, compute the variance contributed by that precipitate's points to the first $n$ principal components, and run the pipeline at the paper's chosen $t=0.2\%$; if the precipitate's contribution falls below $t$ and the point is labelled as FCC Co matrix, the claimed detection of very small phases fails exactly as in the paper's artefact C.
Extended reading notes
Core claim
The central claim is that combining EDS and EBSD signals in one weighted PCA, with subsequent label identification and characterisation, improves phase characterisation in the SEM. Specifically, the paper argues that the variance-normalised concatenation of the two signals, weighted by a factor $w$ that favours EBSD or EDS, followed by VARIMAX rotation of $n$ retained principal components, produces 'rotated characteristic components' whose associated EBSP and spectrum are faithful, amplified representatives of each phase domain. Each scan point is assigned to the characteristic component with the highest score, so a full map is segmented without using spatial proximity. The authors demonstrate on a Co/Ni superalloy that the resulting RC-EBSPs can be template matched to distinguish the pseudo-FCC matrix, M6C, and MC carbides, and the paired RC-spectra quantify refractory-element segregation to each phase. They also report a limitation visible in their own Figure 10: in one tile, a small MC precipitate contributed no strong signal to any retained component and was labelled as FCC Co matrix.
Load-bearing premise
The load-bearing premise is that the retained principal components contain enough variance from every phase of interest, so a phase whose signal is below the variance cut-off is silently assigned to a dominant label; the paper's own Figure 10 shows an MC carbide lost this way.
Editorial extensions
If this is right
- A 40,000-point SEM map can be reduced to a few dozen RC-EBSPs and RC-spectra, so refined template matching against many candidate crystal structures becomes computationally practical and each structure can be tested with higher confidence.
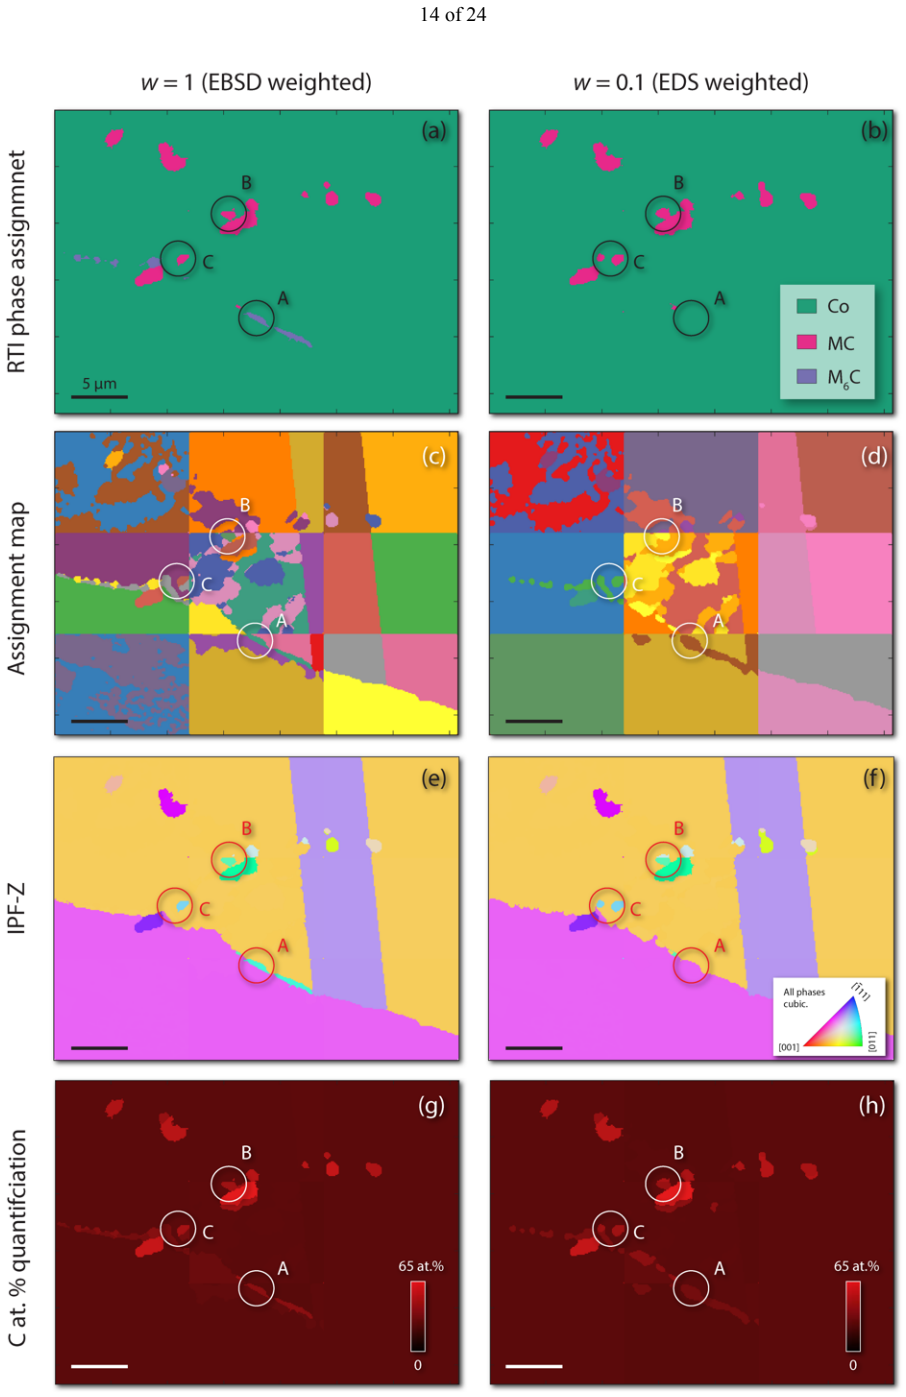
- Phases that differ mainly in chemistry (such as pseudo-FCC matrix versus MC carbide) can be separated by weighting the PCA toward EDS, while phases that differ mainly in structure (such as M23C6 versus M6C) can be separated by EBSD weighting; the weighting parameter $w$ tunes this trade-off.
- Because spatial location is never used in the PCA, the same pipeline applies to any scan-based measurement where each pixel records a spectrum or diffraction pattern, including 4D-STEM, and the labels reflect signal similarity rather than neighbourhood.
- The variance tolerance $t$ controls the sensitivity floor: oversampling (small $t$) preserves small phases at the cost of noisier labels, while undersampling (large $t$) risks missing exactly the minor precipitates the method is designed to find.
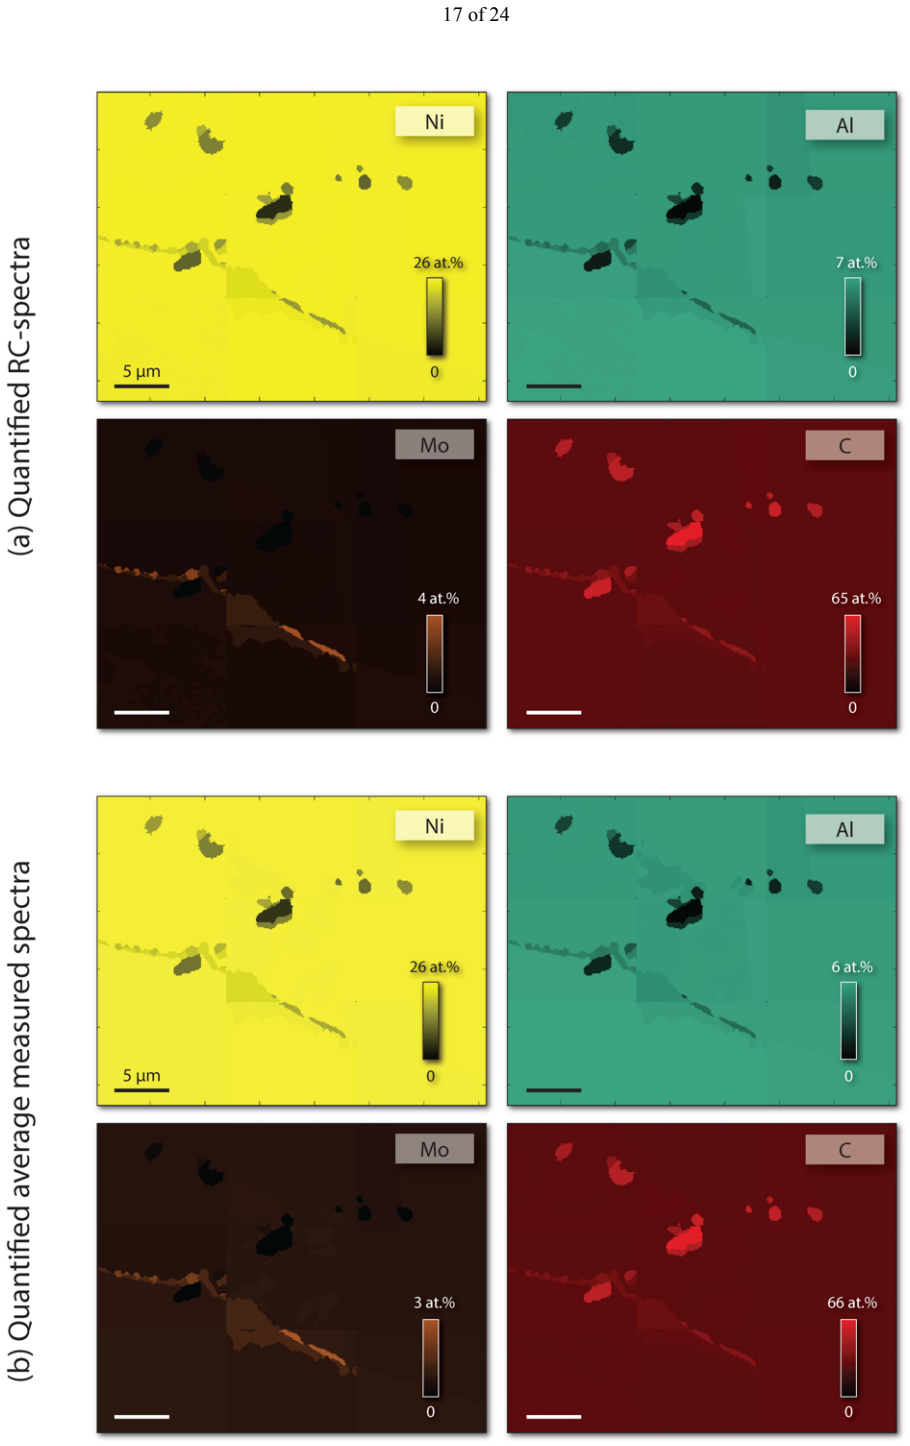
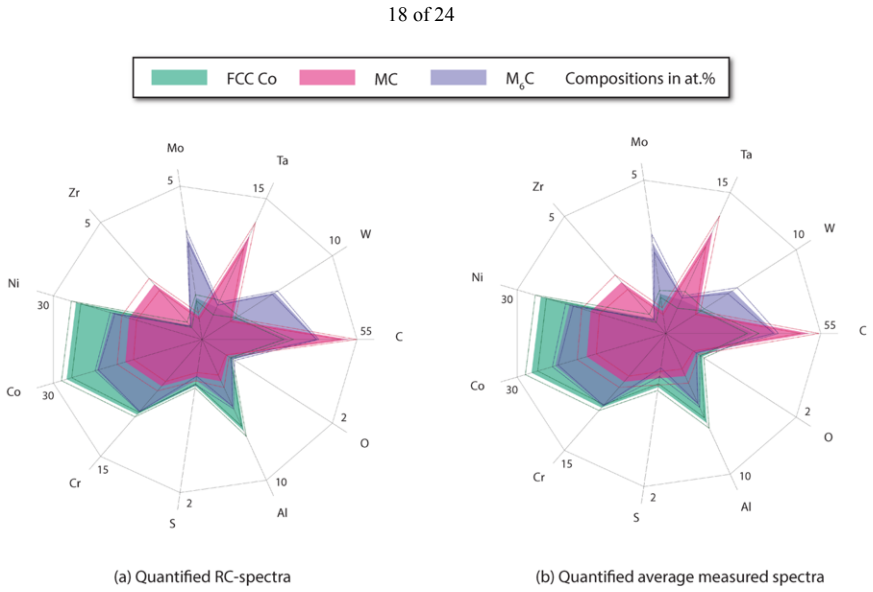
- Quantifying the RC-spectrum associated with each label, rather than each raw pixel spectrum, gives statistically robust segregation trends, for instance Ta and Zr enrichment in MC carbides and Mo, Cr, and W segregation to M6C carbides.
Reading between the lines
- Beyond the paper's explicit claims, the variance-tolerance rule could be made phase-aware: a user could first find candidate minority-phase regions by an EDS- or EBSD-weighted pass, measure their variance contribution, and then set $t$ below the smallest such contribution to guarantee retention.
- The tile-boundary orientation artefact suggests a concrete algorithmic fix the paper does not pursue: overlap tiles or carry the rotated components from neighbouring tiles into the assignment step, so a small precipitate crossing a tile edge is not split into independently labelled pieces.
- The same weighted-PCA construction should transfer to 4D-STEM nanobeam diffraction paired with EELS or EDS, but the modality weighting would need to encode the different interaction volumes and the Poisson character of counting noise, as the paper's discussion of prior noise-scaling work implies.
- A direct test of the method's sensitivity floor would be to spike a synthetic minority-phase pattern into a real map with known variance contribution and measure the smallest phase fraction the pipeline can recover at a given $t$; the paper's artefact C suggests this floor is set by variance retention, not by pattern-matching quality.
Signed reviews
Editorial analysis
A structured set of objections, weighed in public.
Referee Report
Summary. The paper develops a correlative phase-characterisation method for the scanning electron microscope that combines EDS spectra and EBSD patterns in a weighted principal component analysis followed by VARIMAX rotation. The output is a reduced set of 'rotated characteristic components' (RC-EBSPs and RC-spectra) that can be indexed by template matching and quantified chemically, with the goal of amplifying signal-to-noise for small or weakly scattering phases. The method is demonstrated on a Co/Ni-base superalloy containing M6C and MC carbides, where it visibly improves M6C pattern quality and enables chemical quantification. The authors also propose two ways to select the number of retained components (watershed grain counting and a variance-tolerance threshold t) and study the effect of an EBSD weighting parameter w. The central claim is that the weighted PCA approach with subsequent label identification and characterisation improves phase characterisation within the SEM.
Significance. If the method is robust, it is a useful contribution to correlative SEM analysis: it provides a principled way to jointly exploit EDS chemistry and EBSD structure, reduces a ~40,000-point map to a small set of characteristic signals, and enables template matching with multiple candidate structures. The demonstration on a real superalloy, with improved M6C patterns and quantitative segregation trends consistent with literature, is valuable. The paper is also commendably honest in reporting artefacts and comparing with other post-processing approaches (NPAR, NLPAR, cluster analysis). However, the central claim is not fully supported because the automated variance-tolerance selection (t = 0.2%) demonstrably discards an MC carbide precipitate (artefact C, Figure 10), and the hyperparameter selection metrics are internal to the PCA decomposition rather than validated against an external ground truth.
major comments (3)
- [§3.3, Figure 10] The variance-tolerance selection described in §3.1.2, with t = 0.2%, is shown in §3.3 to fail for the MC carbide precipitate at position C: no retained principal component strongly contributes to that grain, and the precipitate is consequently labelled with an FCC Co dominated RC-EBSP and mis-indexed. This is a direct failure of the method's central promise to improve phase characterisation for very small phases, because the automated threshold discards the minority phase as noise. The suggested remedy of relaxing t requires prior knowledge that such a phase exists, which is precisely what an exploratory analysis is supposed to discover. Please address how a user can know whether the chosen t retains all phases of interest, or provide a diagnostic test for phase completeness.
- [§3.1.2 and §3.2, χ_comb metrics] The key hyperparameters w and t are selected by minimising the standard deviation of the combined cross-correlation χ_comb (metric 4), where χ_comb measures the agreement between the measured signals and the RCCs produced by the same PCA. This metric is internal to the decomposition: it can be low even when a minority phase is entirely absent from the retained components, as artefact C demonstrates, because the majority phases dominate the cross-correlation statistics. The paper does not provide external validation that minimising this internal standard deviation corresponds to maximising true phase-classification accuracy. Please justify this proxy, or compare against an independent ground truth (e.g., a known phase map or separate indexing results).
- [§3.1.2, Figure 6] The claim that the standard deviation of χ_comb is 'stable between datasets, choice of w, and the specific values of n' is based on a limited set of examples: three alloys are mentioned, but only one composition is presented in detail (Figure 6 panels for three w values). Given that the choice of t is load-bearing for detecting minority phases, the evidence for transferability across different microstructures is thin. Please either provide a broader demonstration or temper the claim to the present dataset, and state more clearly what a user should do when applying the method to a new material.
minor comments (5)
- [Figure 10 caption] The caption refers to 'point C in Figure 7', but position C is defined in Figure 9; the cross-reference should be corrected.
- [§5, Conclusion item 4] The conclusion states a 40,000-point map can be reduced to 'a few hundred RC-EBSPs', while §4 states that the dataset in this work is reduced to 35 RC-EBSPs; please reconcile the numbers.
- [§3.1.2, χ_comb equation] The displayed equation for χ_comb is garbled in the manuscript (the square root and superscript indices are not rendered correctly); please ensure the mathematical notation is typeset properly.
- [§3.1.2, variance contribution equation] The equation defining the variance-tolerance condition contains corrupted subscripts and superscripts; please provide a clean version of the formula.
- [§8, Data statement] The data statement says data will be uploaded to Zenodo upon acceptance; it would strengthen reproducibility to provide a repository DOI or a link to the code at submission time.
Circularity Check
No circular derivation: the central claim is supported by independent template matching, EDS quantification, and an explicitly documented artefact analysis, rather than by a self-referential argument.
full rationale
The paper's derivation chain is not circular. The central claim—that weighted PCA of concatenated EBSD and EDS signals, followed by VARIMAX rotation and label identification, improves phase characterisation—does not reduce to its inputs by construction. The RCCs are defined by SVD and VARIMAX of the data matrix D, not in terms of the target phase labels or the cross-correlation metrics used for assessment. The hyperparameters n and w are selected using an internal consistency metric χcomb (Sections 3.1.2 and 3.2), but the paper does not present that metric as an external prediction; it uses it as a model-selection heuristic and then validates the output labels with independent tools: refined template matching against dynamically simulated EBSP libraries, EDS quantification using commercial ZAF correction, and comparison with atom probe tomography literature in Section 4.2. The selection of t = 0.2% and w = 0.1 is an optimisation on the same dataset, which is a limitation in terms of generalisation, not a circularity. Artefact C (Section 3.3, Figure 10) explicitly documents a case where the variance threshold discards an MC precipitate; this is an honest failure mode and a correctness caveat, not a step that assumes its conclusion. Self-citations to AstroEBSD [27], refined template matching [12], and prior EBSD PCA work [13,22] are used as tools or external methods, not as a self-referential uniqueness theorem, and the core VARIMAX idea is attributed to external authors. Therefore no circular step is present.
Assumptions & free parameters
free parameters (2)
- EBSD standard deviation weighting, w =
0.1
- Variance tolerance limit, t =
0.2%
assumptions (4)
- domain assumption VARIMAX rotation of the retained principal components yields components that correspond one-to-one with physical grains or phases.
- domain assumption Standard-deviation normalisation of each EBSD pattern and EDS spectrum, followed by a single multiplicative weight w, is sufficient to make PCA variance meaningful across modalities.
- domain assumption The interaction volume for EDS X-ray generation is much larger than that for EBSD, and this spatial mismatch can be at least partially controlled via the scalar weight w.
- domain assumption The five candidate crystal structures (FCC Co, M23C6, M2C, M6C, MC) are the correct and sufficient set for template matching of RC-EBSPs.
Cite this review
Pith. "Pith review of Advancing characterisation with statistics from correlative electron diffraction and X-ray spectroscopy, in the scanning electron microscope." pith.science (2026). https://pith.science/paper/A6XPDZCP
@misc{pith2026190804084,
  author       = {Pith},
  title        = {Pith review of: Advancing characterisation with statistics from correlative electron diffraction and X-ray spectroscopy, in the scanning electron microscope},
  year         = {2026},
  howpublished = {\url{https://pith.science/paper/A6XPDZCP}},
  note         = {Machine review of arXiv:1908.04084}
}
read the original abstract
The routine and unique determination of minor phases in microstructures is critical to materials science. In metallurgy alone, applications include alloy and process development and the understanding of degradation in service. We develop a correlative method, exploring superalloy microstructures which are examined in the scanning electron microscope (SEM) using simultaneous energy dispersive X-ray spectroscopy (EDS) and electron backscatter diffraction (EBSD). This is performed at an appropriate length scale for characterisation of carbide phases' shape, size, location, and distribution. EDS and EBSD data are generated using two different physical processes, but each provide a signature of the material interacting with the incoming electron beam. Recent advances in post-processing, driven by "big data" approaches, include use of principal component analysis (PCA). Components are subsequently characterised to assign labels to a mapped region. To provide physically meaningful signals, the principal components may be rotated to control the distribution of variance. In this work, we develop this method further through a weighted PCA approach. We use the EDS and EBSD signals concurrently, thereby labelling each region using both EDS (chemistry) and EBSD (crystal structure) information. This provides a new method of amplifying signal-to-noise for very small phases in mapped regions, especially where the EDS or EBSD signal is not unique enough alone for classification.
Figures
Figures from the paper (6 more)
Reference graph
Works this paper leans on
-
[1]
T.J.A. Slater, R.S. Bradley, G. Bertali, R. Geurts, S.M. Northover, M.G. Burke, S.J. Haigh, T.L. Burnett, P.J. Withers, Multiscale correlative tomography: An investigation of creep cavitation in 316 stainless steel, Sci. Rep. 7 (2017) 1–10. doi:10.1038/s41598-017-06976-5
-
[2]
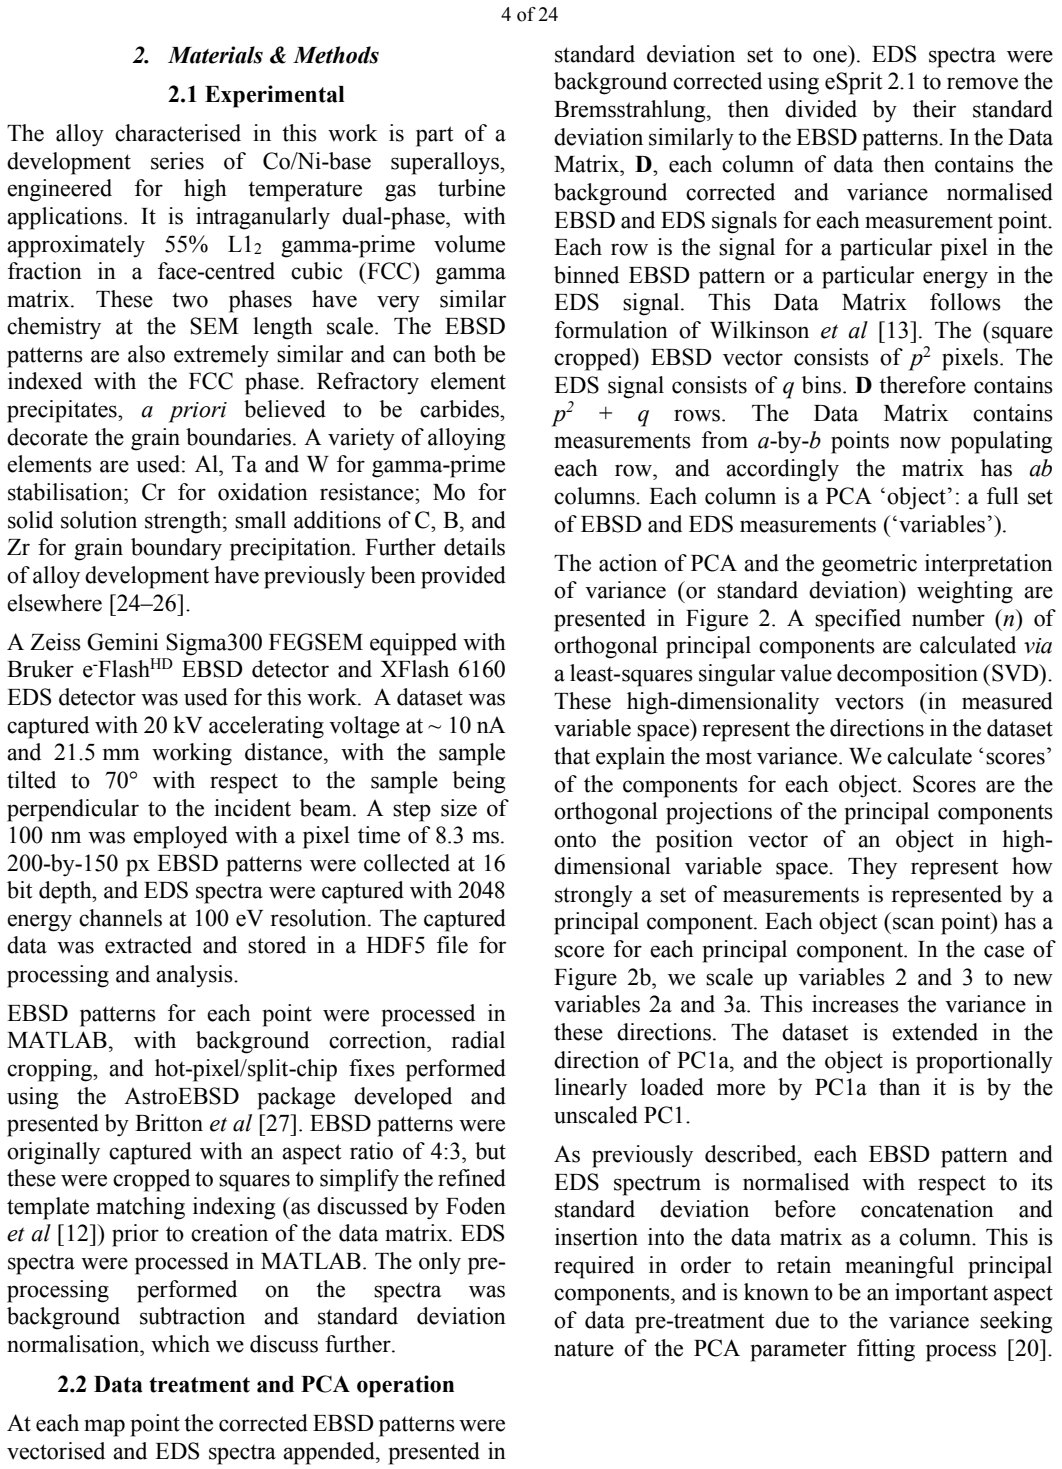
Materials & Methods 2.1 Experimental The alloy characterised in this work is part of a development series of Co/Ni-base superalloys, engineered for high temperature gas turbine applications. It is intraganularly dual-phase, with approximately 55% L12 gamma-prime volume fraction in a face-centred cubic (FCC) gamma matrix. These two phases have very similar...
-
[3]
D.S. Gianola, T. Ben Britton, S. Zaefferer, New techniques for imaging and identifying defects in electron microscopy, (2019) 450–458. doi:10.1557/mrs.2019.125
-
[4]
F. Ram, Z. Li, S. Zaefferer, S.M. Hafez Haghighat, Z. Zhu, D. Raabe, R.C. Reed, On the origin of creep dislocations in a Ni-base, single-crystal superalloy: An ECCI, EBSD, and dislocation dynamics-based study, Acta Mater. 109 (2016) 151–161. doi:10.1016/j.actamat.2016.02.038
-
[5]
T.J. Garosshen, T.D. Tillman, G.P. Mccarthy, Effects of B , C , and Zr on the Structure and Properties of a P/M Nickel Base Superalloy, Metall. Trans. A. 18A (1987) 69–77. doi:10.1007/BF02646223
-
[6]
Based on the stability of the standard deviations in χcomb, a variance tolerance t = 0.2% was selected for selection of n in subsequent analysis of the effect of the EBSD weighting parameter w. 3.2 Leveraging relative EDS variance The dataset variance contribution of the EDS energy bins, the final q rows of D, is altered via a scaling factor in order to b...
-
[7]
T.C. Pekin, C. Gammer, J. Ciston, C. Ophus, A.M. Minor, In situ nanobeam electron diffraction strain mapping of planar slip in stainless steel, Scr. Mater. 146 (2018) 87–90. doi:10.1016/j.scriptamat.2017.11.005
-
[8]
Y.T. Tang, A.J. Wilkinson, R.C. Reed, Grain Boundary Serration in Nickel-Based Superalloy Inconel 600: Generation and Effects on Mechanical Behavior, Metall. Mater. Trans. A Phys. Metall. Mater. Sci. 49 (2018) 4324–4342. doi:10.1007/s11661-018-4671-7
Show all 45 references
-
[9]
Kontis, H.A.M
P. Kontis, H.A.M. Yusof, S. Pedrazzini, M. Danaie, K.L. Moore, P.A.J. Bagot, M.P. Moody, C.R.M. Grovenor, R.C. Reed, On the effect of boron on grain boundary character in a new polycrystalline superalloy, Acta Mater. 103 (2016) 688–699. doi:10.1016/j.actamat.2015.10.006
2016 doi
-
[10]
Unocic, G.B
R.R. Unocic, G.B. Viswanathan, P.M. Sarosi, S. Karthikeyan, J. Li, M.J. Mills, Mechanisms of creep deformation in polycrystalline Ni-base disk superalloys, Mater. Sci. Eng. A. 483–484 (2008) 25–32. doi:10.1016/j.msea.2006.08.148
2008 doi
-
[11]
Viswanathan, P.M
G.B. Viswanathan, P.M. Sarosi, M.F. Henry, D.D. Whitis, W.W. Milligan, M.J. Mills, Investigation of creep deformation mechanisms at intermediate temperatures in René 88DT, Acta Mater. 53 (2005) 3041–3057. doi:10.1016/j.actamat.2005.03.017
2005 doi
-
[12]
Kontis, A
P. Kontis, A. Kostka, D. Raabe, B. Gault, Influence of composition and precipitation evolution on damage at grain boundaries in a crept polycrystalline Ni-based superalloy, Acta Mater. 166 (2019) 158–167. doi:10.1016/J.ACTAMAT.2018.12.039
2019 doi
-
[13]
Winkelmann, G
A. Winkelmann, G. Nolze, M. Vos, F. Salvat-Pujol, W.S.M. Werner, Physics-based simulation models for EBSD: Advances and challenges, IOP Conf. Ser. Mater. Sci. Eng. 109 (2016). doi:10.1088/1757-899X/109/1/012018
2016 doi
-
[14]
Foden, D
A. Foden, D. Collins, A. Wilkinson, T.B. Britton, Indexing electron backscatter diffraction patterns with a refined template matching approach, ArXiv Prepr. ArXiv1807.11313. (2018)
2018 arXiv
-
[15]
Wilkinson, D.M
A.J. Wilkinson, D.M. Collins, Y. Zayachuk, R. Korla, A. Vilalta-Clemente, Applications of Multivariate Statistical Methods and Simulation Libraries to Analysis of Electron Backscatter Diffraction and Transmission Kikuchi Diffraction Datasets, Ultramicroscopy. 196 (2018) 88–98....
2018 doi
-
[16]
Birch, S
R. Birch, S. Wang, V.S. Tong, T.B. Britton, The effect of cooling rate and grain size on hydride microstructure in Zircaloy-4, J. Nucl. Mater. 513 (2019) 221–225. doi:10.1016/j.jnucmat.2018.11.011
2019 doi
-
[17]
F. Ram, M. De Graef, Phase differentiation by electron backscatter diffraction using the dictionary indexing approach, Acta Mater. 144 (2018) 352–364. doi:10.1016/j.actamat.2017.10.069
2018 doi
-
[18]
F. Ram, S. Wright, S. Singh, M. De Graef, Error analysis of the crystal orientations obtained by the dictionary approach to EBSD indexing, Ultramicroscopy. 181 (2017) 17–26. doi:10.1016/j.ultramic.2017.04.016
2017 doi
-
[19]
Winkelmann, Dynamical Simulation of Electron Backscatter Diffraction Patterns, Electron Backscatter Diffr
A. Winkelmann, Dynamical Simulation of Electron Backscatter Diffraction Patterns, Electron Backscatter Diffr. Mater. Sci. (2009). doi:10.1007/978-0-387-88136-2
2009 doi
-
[20]
Callahan, J.C
P.G. Callahan, J.C. Stinville, E.R. Yao, M.P. Echlin, M.S. Titus, M. De Graef, D.S. Gianola, T.M. Pollock, Transmission scanning electron microscopy: Defect observations and image simulations, Ultramicroscopy. 186 (2018) 49–61. doi:10.1016/j.ultramic.2017.11.004
2018 doi
-
[21]
Callahan, M
P.G. Callahan, M. De Graef, Dynamical electron backscatter diffraction patterns. Part I: Pattern simulations, (2013) 1255–1265
2013
-
[22]
S. Wold, K. Esbensen, P. Geladi, Principal Component Analysis, Chemom. Intell. Lab. Syst. 2 (1987) 37–52. doi:10.1016/0169-7439(87)80084-9
1987 doi
-
[23]
Jolliffe, J
I.T. Jolliffe, J. Cadima, Principal component analysis : a review and recent developments, Philos. Trans. R. Soc. A. 374 (2016)
2016
-
[24]
doi:http://dx.doi.org/10.1098/rsta.2015.0202
2015
-
[25]
Brewer, P.G
L.N. Brewer, P.G. Kotula, J.R. Michael, Multivariate statistical approach to electron backscattered diffraction, Ultramicroscopy. 108 (2008) 567–578. doi:10.1016/j.ultramic.2007.10.013
2008 doi
-
[26]
M. Knop, P. Mulvey, F. Ismail, A. Radecka, K.M. Rahman, T.C. Lindley, B.A. Shollock, M.C. Hardy, M.P. Moody, T.L. Martin, P.A.J. Bagot, D. Dye, A new polycrystalline Co-Ni superalloy, JOM. 66 22 of 24 (2014) 2495–2501. doi:10.1007/s11837-014-1175-9
2014 doi
-
[27]
Knop, V.A
M. Knop, V.A. Vorontsov, M.C. Hardy, D. Dye, High-temperature γ (FCC)/ γ ′ (L1 2 ) Co-Al-W based superalloys, MATEC Web Conf. 14 (2014) 18003. doi:10.1051/matecconf/20141418003
2014
-
[28]
Britton, V
T.B. Britton, V. Tong, J. Hickey, A. Foden, A. Wilkinson, AstroEBSD: exploring new space in pattern indexing with methods launched from an astronomical approach, (2018). doi:10.1107/S1600576718010373
2018 doi
-
[29]
Jiang, D.J
R. Jiang, D.J. Bull, A. Evangelou, A. Harte, F. Pierron, I. Sinclair, M. Preuss, X.T. Hu, Strain accumulation and fatigue crack initiation at pores and carbides in a SX superalloy at room temperature, Int. J. Fatigue. (2018). doi:10.1016/j.ijfatigue.2018.05.003
2018 doi
-
[30]
Christofidou, M.C
K.A. Christofidou, M.C. Hardy, H.Y. Li, C. Argyrakis, H. Kitaguchi, N.G. Jones, P.M. Mignanelli, A.S. Wilson, O.M.D.M. Messé, E.J. Pickering, R.J. Gilbert, C.M.F. Rae, S. Yu, A. Evans, D. Child, P. Bowen, H.J. Stone, On the Effect of Nb on the Microstructure and Properties of ...
2018 doi
-
[31]
Hardy, B
M.C.C. Hardy, B. Zirbel, G. Shen, R. Shenkar, R. Shankar, Developing damage tolerance and creep resistance in a high strength nickel alloy for disc applications, in: Superalloys 2004, TMS, 2004: pp. 83–90. doi:10.7449/2004/Superalloys_2004_83_90
2004 doi
-
[32]
Wold, O.H.J
S. Wold, O.H.J. Christie, Extraction of mass spectral information by a combination of autocorrelation and principal components models, Anal. Chim. Acta. 165 (1984) 51–59. doi:10.1016/S0003-2670(00)85185-5
1984 doi
-
[33]
Zhang, X
X. Zhang, X. Qi, M. Zou, F. Liu, Rapid authentication of olive oil by Raman spectroscopy using principal component analysis, Anal. Lett. 44 (2011) 2209–2220. doi:10.1080/00032719.2010.546030
2011
-
[34]
Raîche, T.A
G. Raîche, T.A. Walls, D. Magis, M. Riopel, J.G. Blais, Non-graphical solutions for Cattell’s scree test, Methodology. 9 (2013) 23–29. doi:10.1027/1614-2241/a000051
2013 doi
-
[35]
Ilin, Practical approaches to Principal Component Analysis in the presence of missing values, J
A. Ilin, Practical approaches to Principal Component Analysis in the presence of missing values, J. Mach. Learn. Res. 11 (2010) 1957–2000
2010
-
[36]
Tong, A.J
V.S. Tong, A.J. Knowles, D. Dye, T. Ben Britton, Rapid electron backscatter diffraction mapping: Painting by numbers, Mater. Charact. 147 (2019) 271–279. doi:10.1016/j.matchar.2018.11.014
2019 doi
-
[37]
Campbell, P
A. Campbell, P. Murray, E. Yakushina, S. Marshall, W. Ion, New methods for automatic quantification of microstructural features using digital image processing, Mater. Des. 141 (2018) 395–406. doi:10.1016/j.matdes.2017.12.049
2018 doi
-
[38]
Meyer, Topographic distance and watershed lines, Signal Processing
F. Meyer, Topographic distance and watershed lines, Signal Processing. 38 (1994) 113–125. doi:10.1016/0165-1684(94)90060-4
1994 doi
-
[39]
Kaiser, The Application of Electronic Computers to Factor Analysis, Educ
H.F. Kaiser, The Application of Electronic Computers to Factor Analysis, Educ. Psychol. Meas. 20 (1960) 141–151. doi:10.1177/001316446002000116
1960 doi
-
[40]
Winkelmann, T
A. Winkelmann, T. Ben Britton, G. Nolze, Constraints on the Effective Electron Energy Spectrum in Backscatter Kikuchi Diffraction, 064115 (2018) 1–13. doi:10.1103/PhysRevB.99.064115
2018 doi
-
[41]
Wright, M.M
S.I. Wright, M.M. Nowell, S.P. Lindeman, P.P. Camus, M. De Graef, M.A. Jackson, Introduction and comparison of new EBSD post-processing methodologies, Ultramicroscopy. 159 (2015) 81–94. doi:10.1016/j.ultramic.2015.08.001
2015 doi
-
[42]
Brewick, S.I
P.T. Brewick, S.I. Wright, D.J. Rowenhorst, NLPAR: Non-local smoothing for enhanced EBSD pattern indexing, Ultramicroscopy. 200 (2019) 50–61. doi:10.1016/j.ultramic.2019.02.013
2019 doi
-
[43]
Einsle, A.S
J.F. Einsle, A.S. Eggeman, B.H. Martineau, Z. Saghi, S.M. Collins, R. Blukis, P.A.J. Bagot, P.A. Midgley, R.J. Harrison, Nanomagnetic properties of the meteorite cloudy zone, Proc. Natl. Acad. Sci. 115 (2018) E11436–E11445. doi:10.1073/pnas.1809378115
2018 doi
-
[44]
Keenan, P.G
M.R. Keenan, P.G. Kotula, Accounting for Poisson noise in the multivariate analysis of ToF-SIMS spectrum images, Surf. Interface Anal. 36 (2004) 203–212. doi:10.1002/sia.1657
2004 doi
-
[45]
Keenan, Exploiting spatial-domain simplicity in spectral image analysis, Surf
M.R. Keenan, Exploiting spatial-domain simplicity in spectral image analysis, Surf. Interface Anal. 41 (2009) 79–87. doi:10.1002/sia.2949
2009 doi
Reviewed August 14, 2026 · model on record in the stance chip above.
Discussion (0). Continue with ORCID to comment.