REVIEW 3 major objections 6 minor 103 references
VISON: An Ontology-Based Approach for Software Visualization Tool Discoverability
T0 review · 3 major / 6 minor · reviewed 2026-08-14 · deepseek-v4-flash
Pith's one-line read The paper claims that VISON, the first software visualization ontology built from 70 publicly available tools, lets developers and researchers find suitable visualization tools by querying semantic characteristics rather than reading…
desk verdict A genuine but modest resource contribution: a first populated software-visualization ontology and a 70-tool availability-checked catalog, with a discoverability claim that is illustrated, not yet proven. read the letter →
The pith
A machine-rendered reading of the paper's core claim, the machinery that carries it, and where it could break.
The reading
What carries the argument
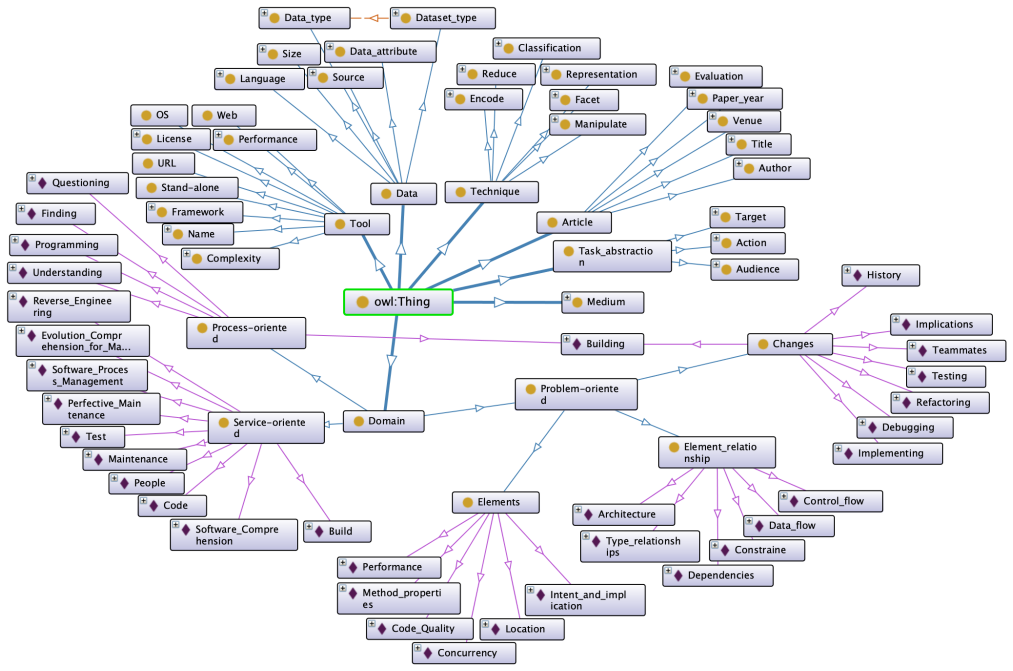
The central object is the VISON ontology itself: a formal OWL model with 150 classes, 20 individual properties, 696 class assertions, and 1,547 object property assertions, built in a widely used ontology editor. It is populated with the curated catalog of 70 tools, each characterized by name, software aspect, concern, last update, execution environment, visualization technique, display medium, and evaluation. The ontology's query mechanism converts a developer's stated need into a class expression and returns matching tool instances; this is the mechanism that turns a static catalog into a discovery engine. It also carries the paper's broader claim that semantic relationships, not just taxonomies, are needed to identify suitable visualization tools.
What would settle it
Take a set of concrete developer queries, such as finding a free tool to visualize runtime performance in Java, and have independent experts, blind to VISON, list the tools they would recommend; if VISON's query results omit a substantial share of the experts' recommended tools, or include tools that are no longer available or do not match the stated concern, the discoverability claim is falsified. A simpler check is to visit the linked repository of every tool returned by VISON for a sample query and verify that the tool is still downloadable and that its last-update date is correct.
Extended reading notes
Core claim
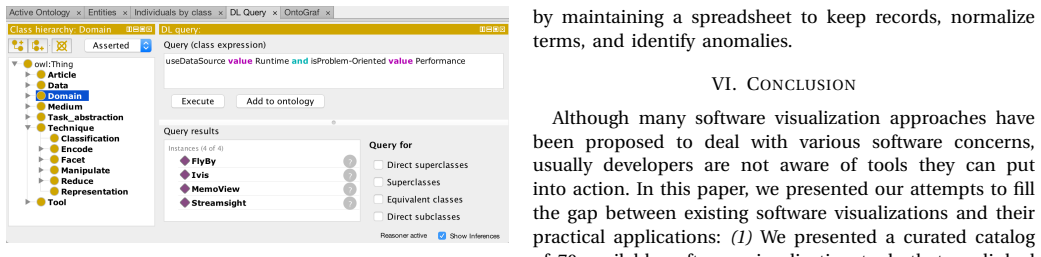
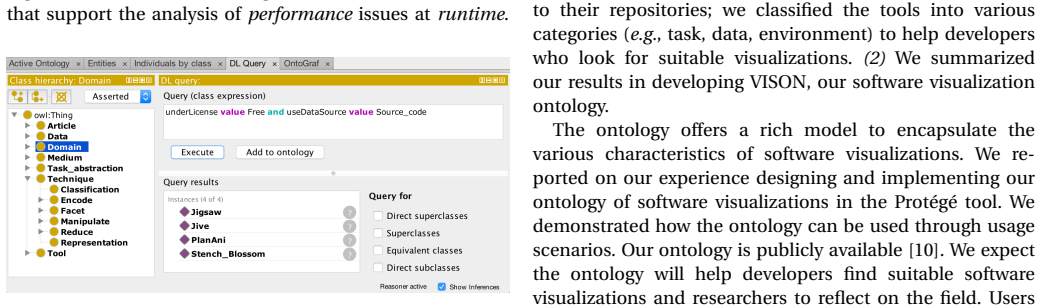
The paper's central claim is that discoverability of software visualization tools can be supported by an ontology, and that VISON is that ontology: to the paper's knowledge, the first ontology of software visualizations. The ontology expresses tools as instances of concepts spanning software aspect, development concern, execution environment, visualization technique, display medium, and evidence of effectiveness through evaluation. The catalog behind it was assembled by scanning 387 papers from the two dedicated software visualization venues between 2002 and 2018, keeping only named tools still publicly available, and ended with 70 tools. The paper demonstrates two OWL queries, one for runtime performance visualization and one for free source-code visualization tools, and reports that each returns suitable tools; these demonstrations are the evidence offered that the ontology serves both developers and researchers.
Load-bearing premise
The load-bearing premise is that the manually extracted characteristics in the catalog—what concerns each tool supports, its environment, maturity, and evidence—are accurate and that the 70 tools selected from two venues represent the tools practitioners actually need; if those data are wrong or miss the tools practitioners use, VISON's recommendations will mislead.
Editorial extensions
If this is right
- A developer can translate a concrete need, such as a free tool for source-code analysis, into a query and receive a shortlist of tools with links to repositories instead of scanning papers.
- A researcher proposing a new visualization tool can query VISON for an existing tool with the same concern or technique to serve as a baseline in a controlled experiment.
- The ontology can grow by user contributions: adding new tools, new supported questions, or new evaluation results keeps the catalog current.
- Because VISON exposes domain structure formally, higher-level search or recommendation frameworks can build on it without re-modeling the domain.
Reading between the lines
- A direct test of the discoverability claim would be a user study in which practitioners with real development questions use VISON and rate whether the returned tools match their needs; the paper does not report such a study.
- The catalog's restriction to two research venues and to tools that are still publicly available means the ontology likely underrepresents widely used commercial or industrial tools; extending the catalog beyond research venues would test whether the ontology generalizes.
- The paper's count of 70 available tools from 387 papers suggests an availability gap in the field; if maintained over time, VISON could serve as a living indicator of tool availability and maturity.
Signed reviews
Editorial analysis
A structured set of objections, weighed in public.
Referee Report
Summary. The paper presents VISON, an OWL ontology of software visualization tools, populated with a manually curated catalog of 70 publicly available tools drawn from 387 papers published in VISSOFT and SOFTVIS between 2002 and 2018. The authors follow the Noy and McGuiness ontology-engineering guidelines, report catalog details in Table I, and illustrate two usage scenarios (runtime performance analysis and free-licensed source-code tools) with OWL queries in Section V. The paper claims that VISON is the first software visualization ontology and that it can support developers in discovering suitable tools and researchers in identifying baselines; the artifact is publicly deposited on Zenodo.
Significance. If the catalog is accurate and representative, VISON is a useful queryable index and formal model for the software visualization domain. The strengths are the systematic extraction protocol, the public artifact, the explicit ontology metrics (150 classes, 696 class assertions), and the fact that the scenarios return tools from the encoded data. The contribution is modest but real: a structured, hyperlinked catalog and a reusable ontology. Credit is due for making the artifact available. The main weaknesses are that the discoverability claim is demonstrated only through two hand-picked scenarios with no user study, baseline, or ground-truth evaluation, and the manually populated catalog shows internal inconsistencies that undermine confidence in its attribute values.
major comments (3)
- [§IV.A.2, Table I] The text in §IV.A.2 states that twenty structure tools are displayed on the standard computer screen and only three use immersive virtual reality (PhysVis, ExplorViz, CityVR). Table I, however, lists 22 structure rows, of which 19 are marked SCS, two are marked I3D (PhysVis and CityVR), and ExplorViz is marked S/I. The stated totals do not add up, and the same discrepancy appears in §IV.A.4, where Getaviz is described as supporting immersive virtual reality while Table I lists it as S/I. Because the medium attribute is one of the fields that determine query results in Section V, this internal inconsistency undercuts the reliability of the manually populated catalog and must be resolved by correcting the table, the text, and the ontology so that all three agree.
- [§V, Figures 11–12] The two usage scenarios are the only evidence for the discoverability claim, but the OWL queries and the returned tool sets are shown only as screenshots; the full query text, the full result sets, and the justification that these sets are correct are not given in the manuscript or, as far as can be verified from the text, in the artifact. A reader cannot audit whether the queries retrieve all relevant tools and no irrelevant ones, nor whether the scenarios were chosen to match instances that the authors themselves encoded. Please provide the queries and result lists in machine-readable form, and ideally add a small ground-truth evaluation (e.g., recall and precision against the catalog, or an independent annotation of a sample of tools) so the discoverability claim is testable.
- [§IV.A, Threats to Validity] The catalog was populated manually by the authors from their own prior classifications ([6], [7]), with no inter-rater reliability, no independent verification of the extracted attributes, and no per-tool provenance for the 'publicly available', 'last update', 'environment', 'license', and 'medium' values. The Threats to Validity paragraph discusses selection bias but not annotation reliability. Since every query in Section V inherits these attribute values, an annotation error can change the recommended tool set and collapse the discoverability claim. I recommend either adding an independent extraction check (e.g., a second annotator on a sample with inter-rater agreement reporting) or making the evidence for each attribute available in the artifact so that errors can be corrected by the community.
minor comments (6)
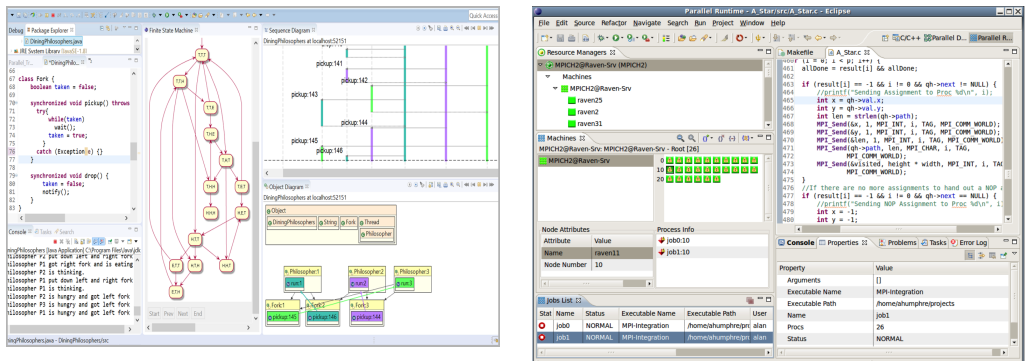
- [Figure 4 caption and §IV.A.1] The name 'Humprey' in the Figure 4 caption and in the sentence referencing reference [44] is a misspelling of 'Humphrey'.
- [Reference [4]] Reference [4] contains a typo: 'Proceeedings' should be 'Proceedings'.
- [§IV.A.4 vs Table I] The heading 'Behavior/Evolution/Structure' in §IV.A.4 does not match the table group label 'E.-S.-B.'; use one consistent abbreviation throughout.
- [Table I] The table lists two distinct tools named 'Jive' (rows with years 2007 and 2016); consider disambiguating the names (e.g., 'Jive (2007)' and 'Jive (2016)') to avoid confusion when querying the ontology.
- [Figures 11–12] The screenshots in Figures 11 and 12 appear to be small and difficult to read; provide enlarged versions or text-based alternatives so that the queries and returned tool names are legible.
- [§V] Please specify the query mechanism used (e.g., Protégé DL Query, SPARQL, or a custom reasoner) and the underlying reasoner configuration, since this affects how users reproduce the scenarios.
Circularity Check
No circularity: VISON is a catalog-and-ontology resource; its usage scenarios are demonstrative queries over the same manually curated instances, not predictions derived from fitted parameters or from a self-citation chain.
full rationale
The paper does not derive a predictive result from the data it encodes; it presents a curated catalog of 70 tools and an ontology populated from that catalog, with usage scenarios that illustrate how OWL queries can retrieve suitable tools. The load-bearing step is the manual extraction and classification of tool characteristics from the literature, which is an input to the ontology rather than a conclusion forced by definition. The paper explicitly says 'To populate VISON, we built on a set of selected papers of previous surveys of the software visualization literature [6], [7]' and 'we report on early results of usage scenarios that demonstrate how the ontology can support' discovery. These statements describe construction and demonstration, not validation against an independent outcome. There are no fitted parameters renamed as predictions, no uniqueness theorem imported from the authors' prior work, and no equation-level reduction. The self-citations to [6] and [7] supply the source data set, but the new contribution is the ontology artifact and its query interface; the usage scenarios are not statistical claims that could be forced by construction. Even though the accuracy of the manual annotations and an internal count inconsistency (e.g., Section IV.A.2 states twenty structure tools use the standard screen and three use immersive VR, while Table I lists counts that do not neatly match) raise validity concerns, they are correctness issues, not circularity. Therefore the derivation chain is self-contained and no circular step can be exhibited.
Assumptions & free parameters
assumptions (4)
- domain assumption Software visualization tools can be adequately characterized by the dimensions from prior surveys: software aspect, concern, last update, execution environment, visualization technique, display medium, and evaluation.
- domain assumption The set of papers published at SOFTVIS and VISSOFT between 2002 and 2018 is a sufficient source for the catalog of tools practitioners would want to discover.
- domain assumption A tool is worth including only if it has a name (C1) and is publicly available on the internet (C2), with availability checked at the time of the study.
- ad hoc to paper The two usage scenarios are representative of real practitioners' discovery needs.
invented entities (1)
-
VISON ontology
independent evidence
Cite this review
Pith. "Pith review of VISON: An Ontology-Based Approach for Software Visualization Tool Discoverability." pith.science (2026). https://pith.science/paper/YL3W5JEX
@misc{pith2026190804090,
  author       = {Pith},
  title        = {Pith review of: VISON: An Ontology-Based Approach for Software Visualization Tool Discoverability},
  year         = {2026},
  howpublished = {\url{https://pith.science/paper/YL3W5JEX}},
  note         = {Machine review of arXiv:1908.04090}
}
read the original abstract
Although many tools have been presented in the research literature of software visualization, there is little evidence of their adoption. To choose a suitable visualization tool, practitioners need to analyze various characteristics of tools such as their supported software concerns and level of maturity. Indeed, some tools can be prototypes for which the lifespan is expected to be short, whereas others can be fairly mature products that are maintained for a longer time. Although such characteristics are often described in papers, we conjecture that practitioners willing to adopt software visualizations require additional support to discover suitable visualization tools. In this paper, we elaborate on our efforts to provide such support. To this end, we systematically analyzed research papers in the literature of software visualization and curated a catalog of 70 available tools that employ various visualization techniques to support the analysis of multiple software concerns. We further encapsulate these characteristics in an ontology. VISON, our software visualization ontology, captures these semantics as concepts and relationships. We report on early results of usage scenarios that demonstrate how the ontology can support (i) developers to find suitable tools for particular development concerns, and (ii) researchers who propose new software visualization tools to identify a baseline tool for a controlled experiment.
Figures

Figures from the paper (6 more)


Reference graph
Works this paper leans on
-
[6]
Towards actionable visualization for software developers,
——, “Towards actionable visualization for software developers,” Journal of Software: Evolution and Process , vol. 30, no. 2, p. e1923, 2017
2017
-
[7]
A systematic literature review of software visualization evaluation,
L. Merino, M. Ghafari, C. Anslow, and O. Nierstrasz, “ A systematic literature review of software visualization evaluation,” Journal of Systems and Software , vol. 144, pp. 165–180, 2018
2018
-
[1]
Questions programmers ask during software evolution tasks,
J. Sillito, G. C. Murphy, and K. De Volder, “Questions programmers ask during software evolution tasks,” in Proceedings of FSE . ACM, 2006, pp. 23–34
2006
-
[2]
Information needs in collo- cated software development teams,
A. J. Ko, R. DeLine, and G. Venolia, “Information needs in collo- cated software development teams,” in Proceedings of ICSE . IEEE Computer Society, 2007, pp. 344–353
2007
-
[3]
Using information fragments to answer the questions developers ask,
T . Fritz and G. C. Murphy, “Using information fragments to answer the questions developers ask,” in Proceedings of ICSE . ACM, 2010, pp. 175–184
2010
-
[4]
Hard-to-answer questions about code,
T . D. LaToza and B. A. Myers, “Hard-to-answer questions about code,” in Proceeedings of PLATEAU . ACM, 2010, pp. 8:1–8:6
2010
-
[5]
Towards actionable visualisation in software development,
L. Merino, M. Ghafari, and O. Nierstrasz, “Towards actionable visualisation in software development,” in Proceedings of VISSOFT . IEEE, 2016
2016
-
[8]
Overcoming issues of 3D software visualization through immersive augmented reality,
L. Merino, A. Bergel, and O. Nierstrasz, “Overcoming issues of 3D software visualization through immersive augmented reality,” in Proceedings of VISSOFT . IEEE, 2018, pp. 54–64
2018
Show all 103 references
-
[9]
Toward principles for the design of ontologies used for knowledge sharing?
T . R. Gruber, “Toward principles for the design of ontologies used for knowledge sharing?” International Journal of Human-Computer Studies, vol. 43, no. 5-6, pp. 907–928, 1995
1995
-
[10]
Artifact: VISON: An Ontology-Based Approach for Software Visualization Tool Discoverability,
L. Merino, E. Kozlova, O. Nierstrasz, and D. Weiskopf, “Artifact: VISON: An Ontology-Based Approach for Software Visualization Tool Discoverability,” Jul. 2019. [Online]. Available: https://doi.org/ 10.5281/zenodo.3268626
2019 doi
-
[11]
Generating visualization-based analysis scenarios from maintenance task de- scriptions,
S. Hassaine, K. Dhambri, H. Sahraoui, and P . Poulin, “Generating visualization-based analysis scenarios from maintenance task de- scriptions,” in Proceedings of VISSOFT . IEEE, 2009, pp. 41–44
2009
-
[12]
What you see is what you asked for: An effort-based transformation of code analysis tasks into interactive visualization scenarios,
A. Sfayhi and H. Sahraoui, “What you see is what you asked for: An effort-based transformation of code analysis tasks into interactive visualization scenarios,” in Proceedings of SCAM . IEEE, 2011, pp. 195–203
2011
-
[13]
How information visualiza- tion novices construct visualizations,
L. Grammel, M. Tory, and M.-A. Storey, “How information visualiza- tion novices construct visualizations,” Transactions on Visualization and Computer Graphics , vol. 16, no. 6, pp. 943–952, 2010
2010
-
[14]
A framework for software architecture visualization assessment,
K. Gallagher, A. Hatch, and M. Munro, “ A framework for software architecture visualization assessment,” in Proceedings of VISSOFT . IEEE Computer Society, 2005, pp. 76–81
2005
-
[15]
Information visualization for agile software development,
J. Paredes, C. Anslow, and F . Maurer, “Information visualization for agile software development,” in Proceedings of VISSOFT. IEEE, 2014, pp. 157–166
2014
-
[16]
A systematic review of software architecture visualization techniques,
M. Shahin, P . Liang, and M. A. Babar, “ A systematic review of software architecture visualization techniques,” Journal of Systems and Software , vol. 94, pp. 161–185, 2014
2014
-
[17]
MetaVis: Exploring actionable visualization,
L. Merino, M. Ghafari, O. Nierstrasz, A. Bergel, and J. Kubelka, “MetaVis: Exploring actionable visualization,” in Proceedings of VIS- SOFT. IEEE, 2016, pp. 151–155
2016
-
[18]
On the use of visualization to support awareness of human activities in software development: a survey and a framework,
M.-A. D. Storey, D. ˇCubrani´ c, and D. M. German, “On the use of visualization to support awareness of human activities in software development: a survey and a framework,” in Proceedings of SOFTVIS. ACM, 2005, pp. 193–202
2005
-
[19]
Classifying desirable features of software visualization tools for corrective maintenance,
M. Sensalire, P . Ogao, and A. Telea, “Classifying desirable features of software visualization tools for corrective maintenance,” in Proceed- ings of SOFTVIS . ACM, 2008, pp. 87–90
2008
-
[20]
Evaluation of software visualization tools: Lessons learned,
——, “Evaluation of software visualization tools: Lessons learned,” in Proceedings of VISSOFT . IEEE, 2009, pp. 19–26
2009
-
[21]
Garnet: Comprehensive sup- port for graphical highly-interactive user interfaces,
B. Myers, D. Giuse, R. Dannenberg, B. Vander Zanden, D. Kosbie, E. Pervin, A. Mickish, and P . Marchal, “Garnet: Comprehensive sup- port for graphical highly-interactive user interfaces,” IEEE Computer, vol. 23, no. 11, pp. 71–85, 1990
1990
-
[22]
A principled taxonomy of software visualization,
B. A. Price, R. M. Baecker, and I. S. Small, “ A principled taxonomy of software visualization,” Journal of Visual Languages and Computing , vol. 4, no. 3, pp. 211–266, 1993
1993
-
[23]
A task oriented view of software visualization,
J. I. Maletic, A. Marcus, and M. Collard, “ A task oriented view of software visualization,” in Proceedings of VISSOFT . IEEE, 2002, pp. 32–40
2002
-
[24]
Using a task-oriented framework to characterize visualization approaches,
M. Schots and C. Werner, “Using a task-oriented framework to characterize visualization approaches,” in Proceedings of VISSOFT . IEEE, 2014, pp. 70–74
2014
-
[25]
Ontology development 101: A guide to creating your first ontology,
N. F . Noy, D. L. McGuinness et al. , “Ontology development 101: A guide to creating your first ontology,” 2001, Stanford Knowledge Sys- tems Laboratory Technical Report KSL-01-05 and Stanford Medical Informatics Technical Report SMI-2001-0880
2001
-
[26]
Diehl, Software Visualization
S. Diehl, Software Visualization. Berlin Heidelberg: Springer-Verlag, 2007
2007
-
[27]
Time travelling animated program executions,
K. Kahn, “Time travelling animated program executions,” in Pro- ceedings of SOFTVIS . ACM, 2006, pp. 185–186
2006
-
[28]
Scratch: A sneak preview,
J. Maloney, L. Burd, Y. Kafai, N. Rusk, B. Silverman, and M. Resnick, “Scratch: A sneak preview,” in Proceedings of C5 . IEEE Computer Society, 2004, pp. 104–109
2004
-
[29]
A tile-based editor for a textual program- ming language,
M. Homer and J. Noble, “ A tile-based editor for a textual program- ming language,” in Proceedings of VISSOFT . IEEE, 2013, pp. 1–4
2013
-
[30]
The clack graphical router: visualizing network software,
D. Wendlandt, M. Casado, P . Tarjan, and N. McKeown, “The clack graphical router: visualizing network software,” in Proceedings of SOFTVIS. ACM, 2006, pp. 7–15
2006
-
[31]
Graph works-pilot graph theory visualization tool,
D. Medani, G. Haggard, C. Bassett, P . Koch, N. Lampert, T . Medlock, S. Pierce, R. Smith, and A. Yehl, “Graph works-pilot graph theory visualization tool,” in Proceedings of SOFTVIS . ACM, 2010, pp. 205– 206
2010
-
[32]
Jayaraman, “JIVE,” Jul
B. Jayaraman, “JIVE,” Jul. 2019. [Online]. Available: https://cse. buffalo.edu/jive/images/home/JIVE-UI.png
2019
-
[33]
Methodology and architecture of jive,
P . Gestwicki and B. Jayaraman, “Methodology and architecture of jive,” in Proceedings of SOFTVIS . ACM, 2005, pp. 95–104
2005
-
[34]
Towards anomaly comprehension: using structural compression to navigate profiling call-trees,
S. Lin, F . Taïani, T . C. Ormerod, and L. J. Ball, “Towards anomaly comprehension: using structural compression to navigate profiling call-trees,” in Proceedings of SOFTVIS . ACM, 2010, pp. 103–112
2010
-
[35]
The paradox of software visualization,
S. P . Reiss, “The paradox of software visualization,” in Proceedings of VISSOFT . IEEE, 2005, pp. 59–63
2005
-
[36]
Visualizing program execution using user abstractions,
——, “Visualizing program execution using user abstractions,” in Proceedings of SOFTVIS . ACM, 2006, pp. 125–134
2006
-
[37]
Visualizing Java in action,
——, “Visualizing Java in action,” in Proceedings of SOFTVIS . ACM, 2003, pp. 57–66
2003
-
[38]
Visu- alization of dynamic program aspects,
P . Deelen, F . van Ham, C. Huizing, and H. van de Watering, “Visu- alization of dynamic program aspects,” in Proceedings of VISSOFT , 2007, pp. 39–46
2007
-
[39]
EVolve: an open extensible software visualization framework,
Q. Wang, W . Wang, R. Brown, K. Driesen, B. Dufour, L. Hendfren, and C. Verbrugge, “EVolve: an open extensible software visualization framework,” in Proceedings of ACM , 2003, pp. 37–49
2003
-
[40]
Beat: a tool for visualizing the exe- cution of object orientated concurrent programs,
P . Johnson and S. Marsland, “Beat: a tool for visualizing the exe- cution of object orientated concurrent programs,” in Proceedings of SOFTVIS. ACM, 2010, pp. 225–226
2010
-
[41]
Syn- chroVis: 3D visualization of monitoring traces in the city metaphor for analyzing concurrency,
J. Waller, C. Wulf, F . Fittkau, P . Döhring, and W . Hasselbring, “Syn- chroVis: 3D visualization of monitoring traces in the city metaphor for analyzing concurrency,” in Proceedings of VISSOFT . IEEE, 2013, pp. 1–4
2013
-
[42]
Revealing runtime features and constituent behaviors within software,
V . K. Palepu and J. A. Jones, “Revealing runtime features and constituent behaviors within software,” in Proceedings of VISSOFT . IEEE, 2015, pp. 86–95
2015
-
[43]
Visualizing the Java heap to detect memory problems,
S. P . Reiss, “Visualizing the Java heap to detect memory problems,” in Proceedings of VISSOFT . IEEE, 2009, pp. 73–80
2009
-
[44]
Gem: Graphical explorer of MPI programs,
A. Humphrey, C. Derrick, G. Gopalakrishnan, and B. Tibbitts, “Gem: Graphical explorer of MPI programs,” in Proceedings of ICPP . IEEE, 2010, pp. 161–168
2010
-
[45]
Using HTML5 visualizations in software fault localization,
C. Gouveia, J. Campos, and R. Abreu, “Using HTML5 visualizations in software fault localization,” in Proceedings of VISSOFT . IEEE, 2013, pp. 1–10
2013
-
[46]
Visualizing inter- active and shared debugging sessions,
F . Petrillo, G. Lacerda, M. Pimenta, and C. Freitas, “Visualizing inter- active and shared debugging sessions,” in Proceedings of VISSOFT . IEEE, 2015, pp. 140–144
2015
-
[47]
Program animation based on the roles of variables,
J. Sajaniemi and M. Kuittinen, “Program animation based on the roles of variables,” in Proceedings of SOFTVIS . ACM, 2003, pp. 7– 16
2003
-
[48]
Adding procedures and pointers to the ALVIS algorithm visualization software: a prelim- inary design,
C. D. Hundhausen, J. L. Brown, and S. Farley, “ Adding procedures and pointers to the ALVIS algorithm visualization software: a prelim- inary design,” in Proceedings of SOFTVIS . ACM, 2006, pp. 155–156
2006
-
[49]
jGRASP: an integrated development environment with visualizations for teaching Java in CS1, CS2, and beyond,
J. H. Cross II and T . D. Hendrix, “jGRASP: an integrated development environment with visualizations for teaching Java in CS1, CS2, and beyond,” Journal of Computing Sciences in Colleges , vol. 23, no. 2, pp. 170–172, 2007
2007
-
[50]
Jsvee & Kelmu: Creating and tailoring program anima- tions for computing education,
T . Sirkiä, “Jsvee & Kelmu: Creating and tailoring program anima- tions for computing education,” Journal of Software: Evolution and Process, vol. 30, no. 2, p. e1924, 2018
2018
-
[51]
Improving an interactive visualization of transition systems,
B. Ploeger and C. Tankink, “Improving an interactive visualization of transition systems,” in Proceedings of SOFTVIS . ACM, 2008, pp. 115–124
2008
-
[52]
Integrating anomaly diagnosis techniques into spreadsheet environments,
D. Kulesz, J. Scheurich, and F . Beck, “Integrating anomaly diagnosis techniques into spreadsheet environments,” in Proceedings of VIS- SOFT. IEEE, 2014, pp. 11–19
2014
-
[53]
XVIZIT: Visualizing cognitive units in spreadsheets,
K. Hodnigg and M. Pinzger, “XVIZIT: Visualizing cognitive units in spreadsheets,” in Proceedings of VISSOFT . IEEE, 2015, pp. 210–214
2015
-
[54]
Lightweight structured vi- sualization of assembler control flow based on regular expressions,
S. Toprak, A. Wichmann, and S. Schupp, “Lightweight structured vi- sualization of assembler control flow based on regular expressions,” in Proceedings of VISSOFT . IEEE, 2014, pp. 97–106
2014
-
[55]
Method execu- tion reports: Generating text and visualization to describe program behavior,
F . Beck, H. A. Siddiqui, A. Bergel, and D. Weiskopf, “Method execu- tion reports: Generating text and visualization to describe program behavior,” in Proceedings of VISSOFT . IEEE, 2017, pp. 1–10
2017
-
[56]
Kayrebt: An activity diagram extraction and visualization toolset designed for the Linux codebase,
L. Georget, F . Tronel, and V . V . T . Tong, “Kayrebt: An activity diagram extraction and visualization toolset designed for the Linux codebase,” in Proceedings of VISSOFT . IEEE, 2015, pp. 170–174
2015
-
[57]
Ori- onPlanning: Improving modularization and checking consistency on software architecture,
G. Santos, N. Anquetil, A. Etien, S. Ducasse, and M. T . Valente, “Ori- onPlanning: Improving modularization and checking consistency on software architecture,” in Proceedings of VISSOFT . IEEE, 2015, pp. 190–194
2015
-
[58]
Slicing-based techniques for visualizing large metamodels,
A. Blouin, N. Moha, B. Baudry, and H. Sahraoui, “Slicing-based techniques for visualizing large metamodels,” in Proceedings of VISSOFT. IEEE, 2014, pp. 25–29
2014
-
[59]
iTraceVis: Visualizing eye movement data within Eclipse,
B. Clark and B. Sharif, “iTraceVis: Visualizing eye movement data within Eclipse,” in Proceedings of VISSOFT . IEEE, 2017, pp. 22–32
2017
-
[60]
Visuocode: A software development environment that supports spatial navigation and composition
D. R. Bradley and I. J. Hayes, “Visuocode: A software development environment that supports spatial navigation and composition.” in Proceedings of VISSOFT . IEEE, 2013, pp. 1–4
2013
-
[61]
An empirical study assessing the effect of SeeIT 3D on comprehension,
B. Sharif, G. Jetty, J. Aponte, and E. Parra, “ An empirical study assessing the effect of SeeIT 3D on comprehension,” in Proceedings of VISSOFT . IEEE, 2013, pp. 1–10
2013
-
[62]
3D visualisation of code structures in Java software systems,
A. Fronk, A. Bruckhoff, and M. Kern, “3D visualisation of code structures in Java software systems,” in Proceedings of SOFTVIS . ACM, 2006, pp. 145–146
2006
-
[63]
Code flows: Visualizing structural evolution of source code,
A. Telea and D. Auber, “Code flows: Visualizing structural evolution of source code,” Computer Graphic Forum , vol. 27, no. 3, pp. 831– 838, 2008
2008
-
[64]
Package patterns for visual architecture recovery,
M. Lungu, M. Lanza, and T . Gîrba, “Package patterns for visual architecture recovery,” in Proceedings of CSMR . IEEE, 2006, pp. 185–196
2006
-
[65]
Requirements of software visual- ization tools: A literature survey,
H. M. Kienle and H. A. Muller, “Requirements of software visual- ization tools: A literature survey,” in Proceedings of VISSOFT . IEEE Computer Society, 2007, pp. 2–9
2007
-
[66]
Cluster analysis of Java dependency graphs,
J. Dietrich, V . Yakovlev, C. McCartin, G. Jenson, and M. Duchrow, “Cluster analysis of Java dependency graphs,” in Proceedings of SOFTVIS. ACM, 2008, pp. 91–94
2008
-
[67]
Design decisions in AspectMaps,
J. Fabry and A. Bergel, “Design decisions in AspectMaps,” in Pro- ceedings of VISSOFT . IEEE, 2013, pp. 1–4
2013
-
[68]
A visual support for decomposing complex feature models,
S. Urli, A. Bergel, M. Blay-Fornarino, P . Collet, and S. Mosser, “ A visual support for decomposing complex feature models,” in Proceedings of VISSOFT . IEEE, 2015, pp. 76–85
2015
-
[69]
Program comprehension through software habitability,
R. Wettel and M. Lanza, “Program comprehension through software habitability,” in Proceedings of ICPC . IEEE, 2007, pp. 231–240
2007
-
[70]
CodeMetropolis – a Minecraft based collaboration tool for developers,
G. Balogh and Á. Beszédes, “CodeMetropolis – a Minecraft based collaboration tool for developers,” in Proceedings of VISSOFT . IEEE, 2013, pp. 1–4
2013
-
[71]
An interactive ambient visualization for code smells,
E. Murphy-Hill and A. P . Black, “ An interactive ambient visualization for code smells,” in Proceedings of SOFTVIS . ACM, 2010, pp. 5–14
2010
-
[72]
Visual clone analysis with SolidSDD,
L. Voinea and A. C. Telea, “Visual clone analysis with SolidSDD,” in Proceedings of VISSOFT . IEEE, 2014, pp. 79–82
2014
-
[73]
Explora: A visualisation tool for metric analysis of software corpora,
L. Merino, M. Lungu, and O. Nierstrasz, “Explora: A visualisation tool for metric analysis of software corpora,” in Proceedings of VISSOFT . IEEE, 2015, pp. 195–199
2015
-
[74]
Softwarenaut,
M. Lungu, “Softwarenaut,” Jul. 2019. [On- line]. Available: https://cloud.githubusercontent.com/assets/ 464519/21022349/9ec2f748-bd7c-11e6-87ad-29c5332caba9.png
2019
-
[75]
CodeCity,
R. Wettel, “CodeCity,” Jul. 2019. [Online]. Available: https: //wettel.github.io/pics/wof/jmol.png
2019
-
[76]
Visualising software as a particle system,
S. Scarle and N. Walkinshaw, “Visualising software as a particle system,” in Proceedings of VISSOFT . IEEE, 2015, pp. 66–75
2015
-
[77]
Live trace visual- ization for comprehending large software landscapes: The ExplorViz approach,
F . Fittkau, J. Waller, C. Wulf, and W . Hasselbring, “Live trace visual- ization for comprehending large software landscapes: The ExplorViz approach,” in Proceedings of VISSOFT . IEEE, 2013, pp. 1–4
2013
-
[78]
CityVR: Game- ful software visualization,
L. Merino, M. Ghafari, C. Anslow, and O. Nierstrasz, “CityVR: Game- ful software visualization,” in Proceedings of ICSME . IEEE, 2017, pp. 633–637
2017
-
[79]
Icon graphs: visualizing the evolution of large class models,
S. Jucknath-John and D. Graf, “Icon graphs: visualizing the evolution of large class models,” in Proceedings of SOFTVIS . ACM, 2006, pp. 167–168
2006
-
[80]
Plugging-in visu- alization: experiences integrating a visualization tool with Eclipse,
R. Lintern, J. Michaud, M.-A. Storey, and X. Wu, “Plugging-in visu- alization: experiences integrating a visualization tool with Eclipse,” in Proceedings of SOFTVIS . ACM, 2003, pp. 47–56
2003
-
[81]
Visual exploration of combined architectural and metric information,
M. Termeer, C. F . Lange, A. Telea, and M. R. Chaudron, “Visual exploration of combined architectural and metric information,” in Proceedings of VISSOFT . IEEE, 2005, pp. 1–6
2005
-
[82]
How do changes in buggy Mozilla files propagate?
L. Voinea and A. Telea, “How do changes in buggy Mozilla files propagate?” in Proceedings of SOFTVIS , vol. 4, no. 05, 2006, pp. 147– 148
2006
-
[83]
Execution patterns for visualizing web services,
W . De Pauw, S. Krasikov, and J. F . Morar, “Execution patterns for visualizing web services,” in Proceedings of SOFTVIS . ACM, 2006, pp. 37–45
2006
-
[84]
CVSscan: visualization of code evolution,
L. Voinea, A. Telea, and J. J. van Wijk, “CVSscan: visualization of code evolution,” in Proceedings of SOFTVIS , 2005, pp. 47–56
2005
-
[85]
DEVis: A tool for visualizing software document evolution,
J. Zhi and G. Ruhe, “DEVis: A tool for visualizing software document evolution,” in Proceedings of VISSOFT . IEEE, 2013, pp. 1–4
2013
-
[86]
Visually exploring object mutation,
R. Schulz, F . Beck, J. W . C. Felipez, and A. Bergel, “Visually exploring object mutation,” in Proceedings of VISSOFT . IEEE, 2016, pp. 21–25
2016
-
[87]
A low-effort analytics platform for visualizing evolving Flask-based Python web services,
P . Vogel, T . Klooster, V . Andrikopoulos, and M. Lungu, “ A low-effort analytics platform for visualizing evolving Flask-based Python web services,” in Proceedings of VISSOFT . IEEE, 2017, pp. 109–113
2017
-
[88]
Visualizing project evolution through abstract syntax tree analysis,
M. D. Feist, E. A. Santos, I. Watts, and A. Hindle, “Visualizing project evolution through abstract syntax tree analysis,” in Proceedings of VISSOFT. IEEE, 2016, pp. 11–20
2016
-
[89]
ClonEvol: Visualizing software evolution with code clones,
A. Hanjali´ c, “ClonEvol: Visualizing software evolution with code clones,” in Proceedings of VISSOFT , 2013, pp. 1–4
2013
-
[90]
Software evolution storylines,
M. Ogawa and K.-L. Ma, “Software evolution storylines,” in Proceed- ings of SOFTVIS . ACM, 2010, pp. 35–42
2010
-
[91]
CVSscan,
A. Telea, “CVSscan,” Jul. 2019. [Online]. Available: https://www.researchgate.net/profile/Stephan_Diehl2/publication/ 221555679/figure/fig46/AS:669038149640208@1536522533700/ CVSScan-evolution-of-a-single-file.png
2019
-
[92]
Mondrian: An agile visualization framework,
M. Meyer, T . Gîrba, and M. Lungu, “Mondrian: An agile visualization framework,” in Proceedings of SOFTVIS . ACM, 2006, pp. 135–144
2006
-
[93]
Glyph-based software component identification,
I. Fernandez, A. Bergel, J. P . S. Alcocer, A. Infante, and T . Gîrba, “Glyph-based software component identification,” in Proceedings of ICPC, 2016, pp. 1–10
2016
-
[94]
The challenge of helping the programmer during debugging,
S. P . Reiss, “The challenge of helping the programmer during debugging,” in Proceedings of VISSOFT . IEEE, 2014, pp. 112–116
2014
-
[95]
Online-configuration of software visualization with Vizz3D,
T . Panas, R. Lincke, and W . Löwe, “Online-configuration of software visualization with Vizz3D,” in Proceedings of SOFTVIS, 2005, pp. 173– 182
2005
-
[96]
A combined software reconnaissance & static analysis Eclipse visualisation plug-in,
B. Cleary, A. Le Gear, C. Exton, and J. Buckley, “ A combined software reconnaissance & static analysis Eclipse visualisation plug-in,” in Proceedings of VISSOFT . IEEE, 2005, pp. 1–2
2005
-
[97]
GEF3D: a framework for two-, two- and-a-half-, and three-dimensional graphical editors,
J. von Pilgrim and K. Duske, “GEF3D: a framework for two-, two- and-a-half-, and three-dimensional graphical editors,” in Proceed- ings of SOFTVIS . ACM, 2008, pp. 95–104
2008
-
[98]
A domain-specific language for visualizing software dependencies as a graph,
A. Bergel, S. Maass, S. Ducasse, and T . Gîrba, “ A domain-specific language for visualizing software dependencies as a graph,” in Proceedings of VISSOFT , 2014, pp. 45–49
2014
-
[99]
GETAVIZ: generating structural, behavioral, and evolutionary views of software systems for empirical evaluation,
D. Baum, J. Schilbach, P . Kovacs, U. Eisenecker, and R. Müller, “GETAVIZ: generating structural, behavioral, and evolutionary views of software systems for empirical evaluation,” in Proceedings of VISSOFT. IEEE, 2017, pp. 114–118
2017
-
[100]
SPIDER SENSE: Software-engineering, networked, system evaluation,
N. H. Reddy, J. Kim, V . K. Palepu, and J. A. Jones, “SPIDER SENSE: Software-engineering, networked, system evaluation,” in Proceedings of VISSOFT . IEEE, 2015, pp. 205–209
2015
-
[101]
Bergel, “GRAPH,” Jul
A. Bergel, “GRAPH,” Jul. 2019. [Online]. Available: http: //agilevisualization.com/img/circle.png
2019
-
[102]
The Protégé project: a look back and a look forward,
M. A. Musen, “The Protégé project: a look back and a look forward,” AI Matters , vol. 1, no. 4, pp. 4–12, 2015
2015
-
[103]
Empirical findings on ontology metrics,
M. Sicilia, D. Rodríguez, E. García-Barriocanal, and S. Sánchez- Alonso, “Empirical findings on ontology metrics,” Expert Systems with Applications , vol. 39, no. 8, pp. 6706–6711, 2012
2012
Reviewed August 14, 2026 · model on record in the stance chip above.
Discussion (0). Continue with ORCID to comment.