REVIEW 4 major objections 5 minor 17 references
Assessing the Impact of Blood Pressure on Cardiac Function Using Interpretable Biomarkers and Variational Autoencoders
T0 review · 4 major / 5 minor · reviewed 2026-08-14 · deepseek-v4-flash
Pith's one-line read Rising blood pressure mainly alters the heart's filling phase
desk verdict A useful framework paper whose central physiological claim is undercut by missing age adjustment and by decoding the model's own fitted regression line. read the letter →
The pith
A machine-rendered reading of the paper's core claim, the machinery that carries it, and where it could break.
The reading
What carries the argument
The central object is the R-VAE: a variational autoencoder with a two-dimensional latent space and a linear regression term added to the loss so that one direction in latent space encodes systolic blood pressure. The regression uses a dummy variable for gender, and the total loss is $L_{\text{R-VAE}} = L_{\text{recon}} + \alpha L_{\text{KL}} + \beta L_{\text{regression}}$. Because the decoder maps latent coordinates back to the 13 interpretable biomarkers, sampling along the regression line lets the model decode how each biomarker responds to blood pressure while holding other latent variation fixed. This combination of a generative decoder with a supervised regression axis is what turns the model into a tool for physiological interpretation rather than a black-box predictor.
What would settle it
Repeatedly measure systolic blood pressure and the same cardiac biomarkers in the same individuals over several years; if a person's within-person rise in blood pressure does not produce the decoded changes (falling indexed end-diastolic volume, rising peak atrial filling and emptying rates), the physiological interpretation fails. A blood-pressure-lowering intervention that shifts systolic pressure but leaves these biomarkers unchanged would likewise refute the claim.
Extended reading notes
Core claim
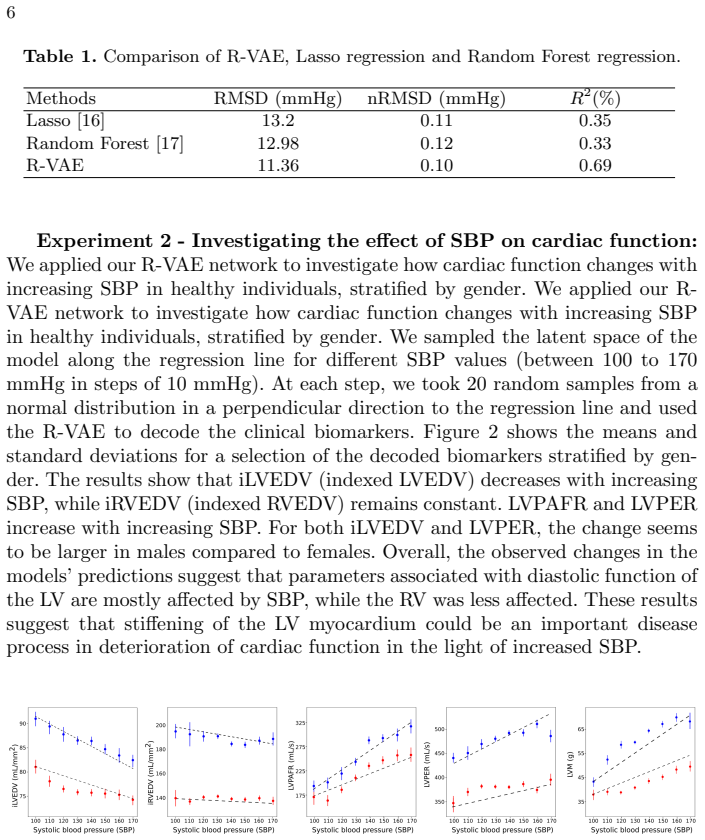
The central claim is that a regression-constrained variational autoencoder (R-VAE) learns a latent axis that tracks systolic blood pressure, and that decoding clinical cardiac biomarkers along this axis reveals a coherent physiological trajectory: as systolic blood pressure rises, indexed left-ventricular end-diastolic volume falls while left-ventricular peak atrial filling rate and peak emptying rate rise, with the right ventricle unaffected. The paper further claims that these decoded changes are larger in males for two of the biomarkers, and that the same latent regression can separate prehypertensive subjects whose cardiac biomarkers resemble normotensive or hypertensive patterns, with diastolic biomarkers again dominating the separation. The paper states this pattern suggests that stiffening of the left-ventricular myocardium could be an important disease process in deterioration of cardiac function in the light of increased systolic blood pressure.
Load-bearing premise
The model treats differences in blood pressure between different people at one point in time as if they were changes that happen within a single person over time.
Editorial extensions
If this is right
- If correct, routine cardiac MRI could track blood-pressure-related cardiac damage through a small set of interpretable diastolic biomarkers, without extra scans.
- The gender differences in the decoded trajectories imply that monitoring and intervention thresholds for blood-pressure-related cardiac remodeling may need to be sex-specific.
- Prehypertensive individuals whose biomarker profile predicts hypertension could be prioritized for early treatment, while those whose profile predicts normotension could be reassured.
- The R-VAE approach is not limited to blood pressure: the same latent regression with a dummy variable can be repurposed to other risk factors once the regression target is swapped.
Reading between the lines
- A testable extension: apply the same R-VAE to a dataset with repeated measurements to check whether the decoded cross-sectional trajectory matches within-person progression; the paper's physiological story depends on this match.
- If the latent axis truly reflects causal SBP effects, a randomized blood-pressure-lowering trial should show the decoded biomarkers reverting toward normotensive values, a prediction not tested in the paper.
- The biomarker bottleneck discards raw image information, so a combined image-and-biomarker VAE might reveal whether the SBP axis changes when higher-dimensional features are available.
- Because the model encodes SBP in one latent direction, the same framework could regress multiple risk factors simultaneously with orthogonal regression directions, exposing interactions between hypertension and other factors.
Signed reviews
Editorial analysis
A structured set of objections, weighed in public.
Referee Report
Summary. The paper presents R-VAE, a variational autoencoder with a latent-space regression loss, applied to 3,600 UK Biobank subjects to relate 13 automatically estimated cardiac MRI biomarkers to systolic blood pressure (SBP). The authors report that R-VAE predicts SBP with R2=0.69, outperforming Lasso and Random Forest, and then use the model to decode how cardiac biomarkers change along the fitted SBP axis in men and women (Experiment 2) and to identify biomarkers distinguishing prehypertensive subjects predicted as normotensive versus hypertensive (Experiment 3). The central physiological claim is that increasing SBP is mainly linked to changes in left ventricular diastolic function, suggesting progressive myocardial stiffening.
Significance. If the results are supported, the interpretable R-VAE framework would be a useful tool for exploring associations between risk factors and cardiac structure/function in large cohorts. The paper has clear strengths: it builds on a fully automated, quality-controlled biomarker extraction pipeline, uses well-known clinical biomarkers for interpretability, integrates regression and generative modeling in a principled way, and stratifies by gender. The decoded trajectories are a falsifiable prediction that could be tested against longitudinal or interventional data. However, the central physiological conclusions currently rest on cross-sectional associations, omit age as a likely confounder, and are extracted from the model's own fitted regression and decoder, so the evidence as presented does not yet support the causal or temporal language used in the Discussion.
major comments (4)
- [Section 4, Experiment 1, Table 1] The text states that 'all methods performed similarly with regard to regression', but Table 1 reports R2=0.69 for R-VAE versus 0.35 for Lasso and 0.33 for Random Forest, which is not similar. No confidence intervals, cross-validation variance, or significance tests are reported for RMSD, nRMSD, or R2, so the comparative claim is unsupported. The authors should report uncertainty intervals and a test of whether the R2 difference is statistically significant, or temper the comparison.
- [Section 3.2 and Section 4, Experiment 2] The latent regression model includes only SBP and a gender dummy variable; age is never mentioned as a covariate. The UK Biobank cohort spans ages 40-69, SBP increases steeply with age, and the diastolic LV changes decoded along the SBP axis (lower iLVEDV, higher LVPAFR and LVPER) also occur with normal aging. Because age is omitted and is correlated with SBP, the decoded trajectories may reflect age-related cardiac remodeling rather than SBP-specific effects. A concrete remedy is to include age in the regression, stratify the decoding by age decade, or run a negative control in which the latent regression is trained on age instead of SBP and the decoded patterns are compared.
- [Section 4, Experiment 2, and Section 5 Discussion] Cross-sectional differences between subjects are interpreted as temporal progression: the Discussion states that 'SBP results in slowly progressive changes in the myocardium' and describes 'deterioration of cardiac function with increasing SBP'. No longitudinal follow-up, causal inference method, or intervention data are provided, so this causal and temporal claim is not supported by the evidence. The authors should either reframe the findings as associations between SBP and cardiac biomarkers in a cross-sectional population or add an explicit causal modeling approach.
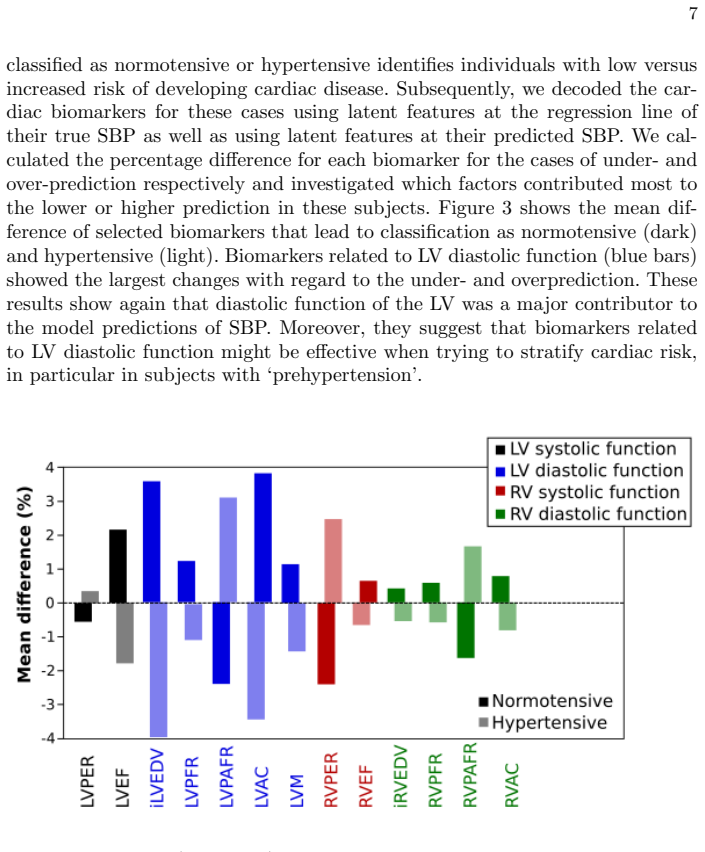
- [Section 4, Experiment 3] The abnormal-response analysis is circular with respect to the model: under- and over-prediction are defined by the same latent-space regression that is then used to decode the biomarkers and attribute differences to those biomarkers. Without external validation, such as follow-up outcome data or an independent cohort, the claim that specific LV diastolic biomarkers 'might be effective when trying to stratify cardiac risk' is exploratory, not a validated finding. The authors should clearly label this experiment as internal model analysis and avoid using it as independent evidence for the biomarkers' clinical utility.
minor comments (5)
- [Section 4, Experiment 2] The paragraph beginning 'We applied our R-VAE network to investigate how cardiac function changes with increasing SBP' is duplicated verbatim; one copy should be deleted.
- [Section 2] The reference to the image acquisition protocol appears as '[ ?]'; a proper reference should be inserted.
- [Section 3.2, Eq. (1)] The text first defines L_regression as mean squared error but then refers to it as the Huber loss in the joint loss equation; the notation should be made consistent.
- [Section 4, Figures 2 and 3] The figures show standard deviations but no confidence intervals, and the 'linear tendency curves' plotted with black dotted lines are not defined in the text or captions; adding a description would improve interpretability.
- [Section 3.2] The hyperparameters alpha=0.3, beta=2, dropout=0.3, and latent dimensionality 2 are introduced without sensitivity analysis; a short robustness check or a sentence justifying these choices would strengthen confidence in the qualitative results.
Circularity Check
Decoded SBP trajectories in Experiment 2 are reconstructions from the same fitted R-VAE, so the physiological conclusion is an interpretation of the model's own regression line rather than an independent finding.
-
fitted input called prediction
[Section 3.2 (Eq. 1) and Section 4, Experiment 2]
"At each step, we took 20 random samples from a normal distribution in a perpendicular direction to the regression line and used the R-VAE to decode the clinical biomarkers. ... The results show that iLVEDV (indexed LVEDV) decreases with increasing SBP, while iRVEDV (indexed RVEDV) remains constant. LVPAFR and LVPER increase with increasing SBP. ... These results suggest that stiffening of the LV myocardium could be an important disease process in deterioration of cardiac function in the light of increased SBP."
The regression line is the direction in latent space trained by L_regression to predict SBP from the same biomarker inputs that the decoder reconstructs. Experiment 2 samples this fitted regression line and decodes with the same trained decoder, so the resulting biomarker-vs-SBP trajectories are the model's own learned mapping expressed back in biomarker space. They are not new measurements, held-out predictions, or independent validations. The paper then interprets these internally generated trajectories as evidence about how cardiac function changes with SBP and as suggesting a myocardial stiffening disease process, which treats a reconstruction from the fitted model as if it were empirical support for the physiological claim.
-
fitted input called prediction
[Section 4, Experiment 3]
"Subsequently, we decoded the cardiac biomarkers for these cases using latent features at the regression line of their true SBP as well as using latent features at their predicted SBP. We calculated the percentage difference for each biomarker ... and investigated which factors contributed most to the lower or higher prediction in these subjects. ... These results show again that diastolic function of the LV was a major contributor to the model predictions of SBP."
Experiment 3 is an explanation of the same model's own SBP predictions. The biomarker differences are decoded by the same R-VAE that produced the predicted SBP, so identifying 'diastolic function of the LV' as a major contributor is describing the model's internal decision mechanism, not independently establishing a physiological relationship between SBP and diastolic function. The result is forced by the model's joint training objective: the latent regression and decoder were fitted together on these biomarkers, so decoding along the regression line will naturally highlight the biomarkers that the model uses.
full rationale
The paper is largely self-contained: biomarker estimation relies on a published pipeline, and Experiment 1 gives an external benchmark by comparing held-out SBP regression performance against Lasso and Random Forest. However, the central qualitative conclusion about the impact of SBP on cardiac function comes from Experiment 2, where the latent space is trained with a regression loss to predict SBP and then the same trained model is sampled along its regression line and decoded. The decoded trajectories are therefore the model's own learned mapping, not independent evidence; Experiment 3 similarly explains the model's own predictions. This is partial circularity: the paper's most clinically framed statements reduce to properties of the fitted model by construction. A separate correctness concern, the omission of age as a confounder despite strong SBP-age correlation in the 40-69 UK Biobank cohort, is a validity threat rather than circularity and is not scored here.
Assumptions & free parameters
free parameters (4)
- alpha (KL weight) =
0.3
- beta (regression weight) =
2
- latent dimensionality =
2
- dropout probability =
0.3
assumptions (4)
- domain assumption The listed clinical biomarkers (12 in the text, though N=13 is stated) provide a sufficient representation of cardiac function for studying SBP effects.
- domain assumption The automated segmentation and quality control pipeline from Ruijsink et al. [11] produces accurate biomarkers in this cohort.
- ad hoc to paper The relationship between latent biomarkers and SBP is linear: y = w^T (z + D) + epsilon.
- domain assumption The gender dummy variable fully accounts for sex differences in the SBP-biomarker relationship.
Cite this review
Pith. "Pith review of Assessing the Impact of Blood Pressure on Cardiac Function Using Interpretable Biomarkers and Variational Autoencoders." pith.science (2026). https://pith.science/paper/K26NX7TM
@misc{pith2026190804538,
  author       = {Pith},
  title        = {Pith review of: Assessing the Impact of Blood Pressure on Cardiac Function Using Interpretable Biomarkers and Variational Autoencoders},
  year         = {2026},
  howpublished = {\url{https://pith.science/paper/K26NX7TM}},
  note         = {Machine review of arXiv:1908.04538}
}
read the original abstract
Maintaining good cardiac function for as long as possible is a major concern for healthcare systems worldwide and there is much interest in learning more about the impact of different risk factors on cardiac health. The aim of this study is to analyze the impact of systolic blood pressure (SBP) on cardiac function while preserving the interpretability of the model using known clinical biomarkers in a large cohort of the UK Biobank population. We propose a novel framework that combines deep learning based estimation of interpretable clinical biomarkers from cardiac cine MR data with a variational autoencoder (VAE). The VAE architecture integrates a regression loss in the latent space, which enables the progression of cardiac health with SBP to be learnt. Results on 3,600 subjects from the UK Biobank show that the proposed model allows us to gain important insight into the deterioration of cardiac function with increasing SBP, identify key interpretable factors involved in this process, and lastly exploit the model to understand patterns of positive and adverse adaptation of cardiac function.
Figures

Reference graph
Works this paper leans on
-
[1]
Deep-learning cardiac motion analysis for human survival prediction,
G. Bello, T. Dawes, J. Duan, C. Biffi, et al., “Deep-learning cardiac motion analysis for human survival prediction,” Nature machine intelligence , vol. 1, no. 2, p. 95, 2019
work page 2019
-
[2]
Impact of prehypertension on left ventricu- lar structure, function and geometry,
J. Bajpai, A. Sahay, A. Agarwal, et al., “Impact of prehypertension on left ventricu- lar structure, function and geometry,”Journal of Clinical and Diagnostic Research: JCDR, vol. 8, no. 4, p. BC07, 2014. 9
work page 2014
-
[3]
R. Mo, J.-E. Nordrehaug, P. Omvik, and P. Lund-Johansen, “The bergen blood pressure study: prehypertensive changes in cardiac structure and function in off- spring of hypertensive families,” Blood pressure, vol. 4, no. 1, pp. 16–22, 1995
work page 1995
-
[4]
C. Biffi, O. Oktay, G. Tarroni, et al. , “Learning interpretable anatomical features through deep generative models: Application to cardiac remodeling,” in Interna- tional Conference on Medical Image Computing and Computer-Assisted Interven- tion, pp. 464–471, Springer, 2018
work page 2018
-
[5]
Explainable Anatomical Shape Analysis through Deep Hierarchical Generative Models
C. Biffi, J. Cerrolaza, G. Tarroni, et al., “Explainable shape analysis through deep hierarchical generative models: Application to cardiac remodeling,” arXiv preprint arXiv:1907.00058, 2019
work page Pith review arXiv 1907
-
[6]
Global and Local Interpretability for Cardiac MRI Classification
J. Clough, I. Oksuz, E. Puyol-Anton, et al. , “Global and local interpretability for cardiac mri classification,” arXiv preprint arXiv:1906.06188 , 2019
work page Pith review arXiv 1906
-
[7]
J. Xie, X. Wang, Y. Liu, and Y. Bai, “Autoencoder-based deep belief regression network for air particulate matter concentration forecasting,”Journal of Intelligent & Fuzzy Systems , vol. 34, no. 6, pp. 3475–3486, 2018
work page 2018
-
[8]
Machine load estimation via stacked autoencoder regression,
T. Bose, A. Majumdar, and T. Chattopadhyay, “Machine load estimation via stacked autoencoder regression,” in 2018 IEEE International Conference on Acous- tics, Speech and Signal Processing (ICASSP) , pp. 2126–2130, IEEE, 2018
work page 2018
Show all 17 references
-
[9]
A deep auto-encoder model for gene expression prediction,
R. Xie, J. Wen, A. Quitadamo, J. Cheng, and X. Shi, “A deep auto-encoder model for gene expression prediction,” BMC genomics , vol. 18, no. 9, p. 845, 2017
2017
-
[10]
Associations with intraocular pressure in a large cohort: results from the uk biobank,
M. Chan, C. Grossi, A. Khawaja, et al. , “Associations with intraocular pressure in a large cohort: results from the uk biobank,” Ophthalmology, vol. 123, no. 4, pp. 771–782, 2016
2016
-
[11]
Fully automated, quality-controlled cardiac analysis from cmr: Validation and large-scale application to characterize cardiac function,
B. Ruijsink, E. Puyol-Ant´ on, I. Oksuz,et al., “Fully automated, quality-controlled cardiac analysis from cmr: Validation and large-scale application to characterize cardiac function,” JACC: Cardiovascular Imaging , 2019
2019
-
[12]
Automated cardiovascular magnetic reso- nance image analysis with fully convolutional networks,
W. Bai, M. Sinclair, G. Tarroni, et al. , “Automated cardiovascular magnetic reso- nance image analysis with fully convolutional networks,”Journal of Cardiovascular Magnetic Resonance, vol. 20, no. 1, p. 65, 2018
2018
-
[13]
Fully automated segmentation-based respiratory motion correction of multiplanar cardiac magnetic resonance images for large-scale datasets,
M. Sinclair, W. Bai, E. Puyol-Ant´ on,et al., “Fully automated segmentation-based respiratory motion correction of multiplanar cardiac magnetic resonance images for large-scale datasets,” in International Conference on Medical Image Computing and Computer-Assisted Intervention...
2017
-
[14]
A formula to estimate the approximate surface area if height and weight be known,
D. Du Bois, “A formula to estimate the approximate surface area if height and weight be known,” Nutrition, vol. 5, pp. 303–313, 1989
1989
-
[15]
How should meta-regression analyses be undertaken and interpreted?,
S. Thompson and J. Higgins, “How should meta-regression analyses be undertaken and interpreted?,” Statistics in medicine , vol. 21, no. 11, pp. 1559–1573, 2002
2002
-
[16]
Regression shrinkage and selection via the lasso,
R. Tibshirani, “Regression shrinkage and selection via the lasso,” Journal of the Royal Statistical Society: Series B (Methodological) , vol. 58, no. 1, pp. 267–288, 1996
1996
-
[17]
Random forests and adaptive nearest neighbors,
Y. Lin and Y. Jeon, “Random forests and adaptive nearest neighbors,” Journal of the American Statistical Association , vol. 101, no. 474, pp. 578–590, 2006
2006
Reviewed August 14, 2026 · model on record in the stance chip above.
Discussion (0). Continue with ORCID to comment.