REVIEW 4 major objections 5 minor 16 references
Incorporating Task-Specific Structural Knowledge into CNNs for Brain Midline Shift Detection
T0 review · 4 major / 5 minor · reviewed 2026-08-14 · deepseek-v4-flash
Pith's one-line read Enforcing a per-row softmax constraint lets a two-headed CNN localize the brain midline and derive midline shift with a mean error of 1.54 mm on severe tumor cases, approaching the 3.44 mm inter-expert disagreement.
desk verdict A solid clinical imaging paper with a genuine methodological twist—per-column softmax midline regression plus a limits head—and a real external validation; the 'approaches inter-expert variability' claim is slightly oversold but not wrong. read the letter →
The pith
A machine-rendered reading of the paper's core claim, the machinery that carries it, and where it could break.
The reading
What carries the argument
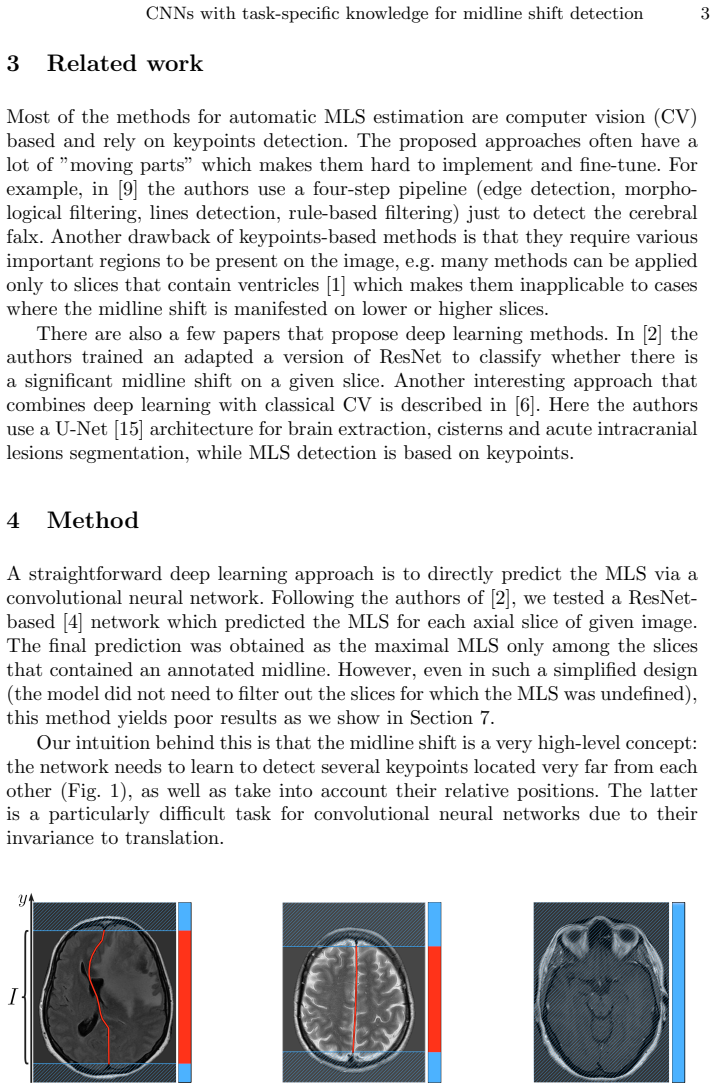
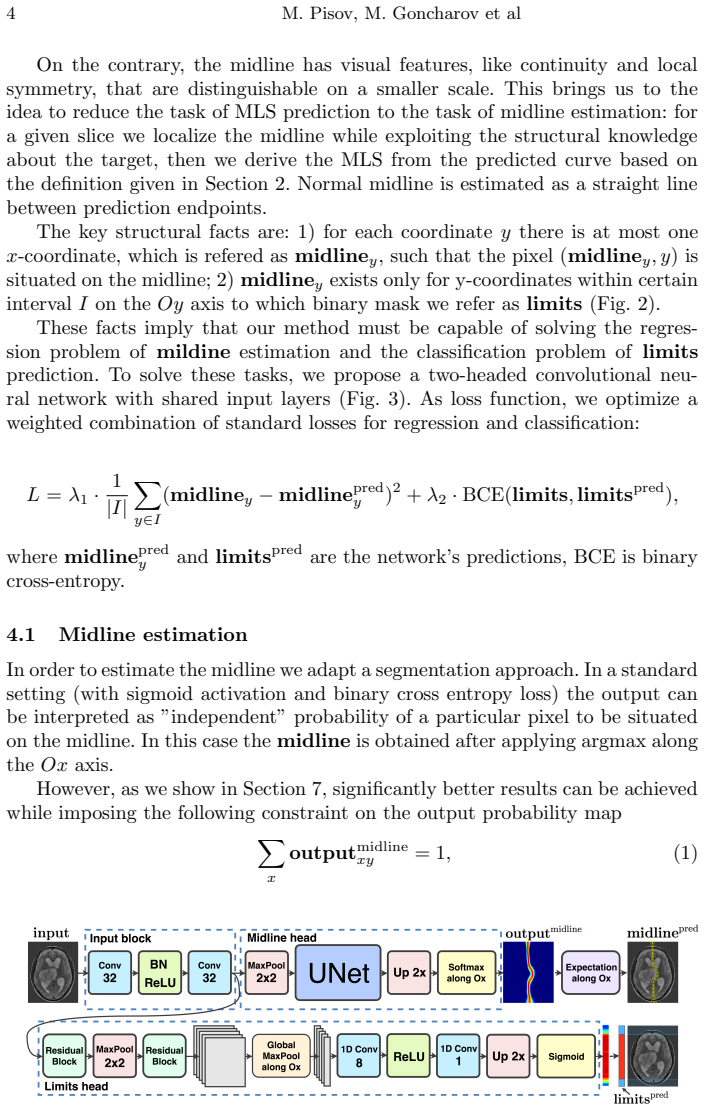
The load-bearing object is the two-headed CNN with a row-wise softmax midline head. The head's output for each $y$ is normalized so that $\sum_x \mathrm{output}_{xy} = 1$, and the predicted midline position is the expected value $\sum_x x \cdot \mathrm{output}_{xy}$. The second head uses global max pooling along $x$ followed by one-dimensional convolutions to predict the limits interval $\mathcal{I}$; predictions outside $\mathcal{I}$ are discarded, and the shift is computed as the maximum distance from the predicted curve to the straight line joining its endpoints. Because the softmax output is a probability distribution, percentiles and confidence intervals can be read off directly at inference time.
What would settle it
Re-run the proposed model on DS1 with the softmax-expectation head replaced by a sigmoid+argmax segmentation head under identical preprocessing and training; if the MAX midline error does not rise materially above the reported 3.61 mm, the paper's claim that the distributional constraint is the source of the gain would be contradicted. Independently, have two additional radiologists label a random subset of DS1 and compare the model's errors against their agreement; the 'approaches inter-expert variability' claim would be falsified if the model is much farther from the new consensus than the new experts are from each other.
Extended reading notes
Core claim
The paper's central claim is that imposing a distributional constraint on the output map—$\sum_x \mathrm{output}_{xy}^{\mathrm{midline}} = 1$ for each row $y$—and reading the midline as the expectation $\sum_x x \cdot \mathrm{output}_{xy}^{\mathrm{midline}}$ is what makes the difference. Under this constraint the network's job matches the anatomy: one midline point per row, with a second head deciding where the midline exists and a shared encoder for both tasks. The authors show that this softmax-expectation design outperforms both a plain segmentation head (sigmoid plus argmax) and a direct ResNet regression of the shift, and that the error is close to the inter-expert variability reported in their own data. The improvement is most visible in the maximum error across a brain, which matters because the final MLS is the maximum over axial slices.
Load-bearing premise
The method assumes the expert-annotated midlines and limits are reliable enough to be both training targets and the reference standard for evaluation, while the paper itself reports that experts disagree by up to 3.44 mm in maximum error.
Editorial extensions
If this is right
- A network that reports MLS in near-expert agreement could be used to prioritize severe cases in settings where a radiologist is not immediately available.
- Because the method works on MRI series with variable voxel spacings and modalities, it can be applied without retraining across heterogeneous hospital protocols.
- The per-row probability output gives percentile-based confidence bands, so cases with uncertain midlines can be flagged for review rather than silently mis-measured.
- The two-headed design removes the need for keypoint detectors, so it works even when the shift is visible only on slices without ventricles.
Reading between the lines
- The paper leaves implicit that the single-valued-per-row construction applies to any elongated structure with one crossing per axis; a natural next test would be the falx on CT or the spinal canal on sagittal MRI.
- Because the external dataset contains mostly small shifts (mean 2.9 mm, 8% over 5 mm), the external validation mainly supports the low-shift regime; a more stressing external test would use a severe-case cohort with CT or non-routine acquisition.
- A testable extension would be to replace the straight-line normal midline with a symmetry-derived reference line from the skull to see whether the residual 0.75–1.54 mm error shrinks further.
- The confidence intervals from the softmax head could be turned into an automated flagging rule by thresholding their width; the paper describes the intervals but does not propose such a rule.
Signed reviews
Editorial analysis
A structured set of objections, weighed in public.
Referee Report
Summary. This paper proposes a two-headed CNN for estimating brain midline shift (MLS) from axial MR slices. The midline head predicts, for each image row, a softmax distribution over x positions and takes its expectation as the predicted midline; a second head predicts the vertical interval (limits) where the midline is defined. The final MLS is derived from the predicted curve as the maximal deviation from the straight line connecting its endpoints. The method is trained on 352 MRI series labeled by one expert (exp1) and evaluated with 5-fold cross-validation plus an external 203-series dataset (DS2), comparing against a ResNet regression baseline and a plain segmentation variant. The paper reports MLS MAE of 1.54 mm (DS1) and 0.75 mm (DS2), a midline MAX error of 3.61 mm, and claims this approaches inter-expert variability (3.44 mm).
Significance. The design is principled, and the structural constraints (single midline point per row, finite limits) are derived from anatomy rather than from the test data, so the method is not circular. The softmax-expectation formulation gives a natural confidence estimate, the method is evaluated on an external clinical dataset, and the authors release training and inference code. If the reported accuracy and external validation hold under a more stringent expert comparison, the method would be a practically useful and interpretable alternative to direct MLS regression. The main caveat is that the headline 'approaches inter-expert variability' claim currently rests on a one-sided comparison with the training annotator and needs additional evaluation.
major comments (4)
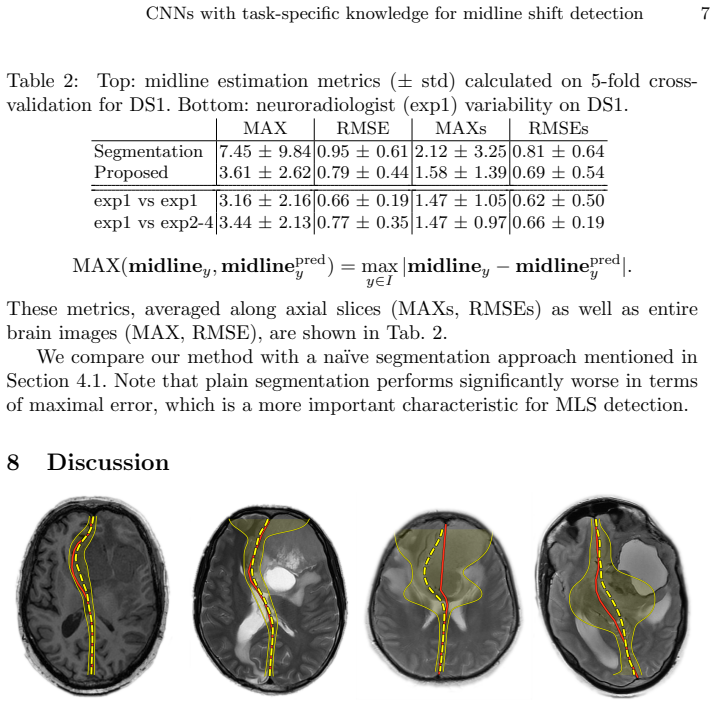
- [Abstract; §7.2, Table 2] The central claim that the method's error 'approaches the inter-expert variability' is not supported by the reported comparison. The model is trained on exp1's labels (Section 6), and Table 2 compares the model's midline predictions against exp1 with the variability between exp1 and exp2-4. This measures how well the model reproduces its training annotator, not how well it agrees with an arbitrary expert; a model that perfectly imitated exp1 would score zero against exp1 while still disagreeing with exp2-4 more than exp1 does. The paper should report the model's error against exp2-4 (or against a consensus or reference standard) and, if the abstract's 'mean error' refers to MLS MAE, it should compare that metric with the corresponding expert-level MLS variability. Without these numbers the headline claim is not established.
- [Table 1, DS2 row] The proposed method's DS2 MAE is reported as 0.75 ± 0.04 mm. If the ± value is the standard deviation across the 203 DS2 series, it is implausibly small compared with DS1 (1.54 ± 1.98 mm) and with the DS2 MLS distribution (2.9 ± 1.5 mm); if it is the standard deviation across cross-validation folds or model seeds, it is not the per-case accuracy dispersion that a reader would expect. Please clarify exactly how the DS2 statistics were computed and report the per-patient standard deviation or a confidence interval.
- [§4.2 and §7] The limits head is a mandatory component of the pipeline because it defines the y-interval over which the midline and the MLS are computed, yet no independent metric for limits prediction is reported and no ablation removes or replaces it. An evaluation such as IoU between predicted and annotated limits, or endpoint error, would let the reader judge whether the reported gain over the ResNet baseline is due to the structural formulation or to a particular behavior of the limits head. Given that errors in limits directly propagate to MLS, this is a necessary piece of evidence for the method's internal validity.
- [§7, Tables 1 and 2] No statistical tests or confidence intervals accompany the differences that matter for the paper's claims, such as Proposed vs ResNet-152, Proposed vs segmentation, and the 3.61 mm vs 3.44 mm gap in MAX. The RMSE values in Table 2 are within 0.02 mm of the expert-variability value, so without paired significance tests, bootstrap intervals, or per-case scatter, the 'approaches inter-expert variability' claim cannot be distinguished from chance. Please add appropriate statistical assessment.
minor comments (5)
- [Section 4] There is a typo in the phrase 'regression problem of mildine estimation'; 'mildine' should be 'midline'.
- [Section 7.2] The metrics MAXs and RMSEs are used in Table 2 but are not defined; please state explicitly how the per-slice maximum and root-mean-square errors are averaged over axial slices.
- [Figure 3] The schematic would be easier to follow if the shared input layers and the two heads were labeled directly, since the text refers to 'Fig. 3 (top)' and 'Fig. 3 (bottom)'.
- [Section 6] DS2 is described as used 'in a prospective fashion,' but the data appear to be retrospective; please rephrase to avoid ambiguity about the study design.
- [Section 1 and GitHub footnote] The code link is a strength, but a specific version or commit hash would improve reproducibility.
Circularity Check
No circularity: the MLS is predicted from learned midline curves and evaluated on held-out data; the inter-expert comparison is an evaluation limitation, not a circular derivation.
full rationale
The paper's derivation chain is self-contained and non-circular. The method reduces MLS prediction to midline estimation by defining the midline as a per-column location and then deriving MLS as the maximal distance between the predicted curve and a straight line between its endpoints (Section 2 and Section 4). This is a task decomposition, not a definitional equivalence: the network is trained with supervised losses on expert-annotated midlines and limits (L = λ1·... + λ2·BCE(...)), and the MLS itself is never used as a training target or fitted parameter. All reported metrics are computed on held-out cross-validation folds and on an external dataset (DS2) in a prospective fashion. The only arguable weakness is the claim that the model's error 'approaches inter-expert variability': the model is trained on exp1 labels and compared against exp1 variability, whereas a harder test against exp2-4 would be more convincing. However, this is an evaluation-design concern, not circularity: the model does not predict the inter-expert variability from a fitted constant, nor does the paper rename its training targets as predictions. No self-citation chain, no imported uniqueness theorem, and no ansatz smuggled in via citation appear in the load-bearing argument. Therefore the paper receives a circularity score of 0.
Assumptions & free parameters
free parameters (4)
- loss weights lambda1 and lambda2 =
lambda1 = lambda2 = 1
- learning rate =
1e-3
- batch size =
40
- number of training iterations =
32000
assumptions (4)
- domain assumption For each coordinate y there is at most one x-coordinate (midline_y) on the midline (structural fact 1).
- domain assumption The midline exists only for y-coordinates within a certain interval I on the Oy axis, captured by the limits mask (structural fact 2).
- domain assumption The normal midline is a straight line between the endpoints of the predicted midline.
- domain assumption Human expert annotations of the midline and limits are reliable enough to serve as ground truth.
Cite this review
Pith. "Pith review of Incorporating Task-Specific Structural Knowledge into CNNs for Brain Midline Shift Detection." pith.science (2026). https://pith.science/paper/ULFBSLHW
@misc{pith2026190804568,
  author       = {Pith},
  title        = {Pith review of: Incorporating Task-Specific Structural Knowledge into CNNs for Brain Midline Shift Detection},
  year         = {2026},
  howpublished = {\url{https://pith.science/paper/ULFBSLHW}},
  note         = {Machine review of arXiv:1908.04568}
}
read the original abstract
Midline shift (MLS) is a well-established factor used for outcome prediction in traumatic brain injury, stroke and brain tumors. The importance of automatic estimation of MLS was recently highlighted by ACR Data Science Institute. In this paper we introduce a novel deep learning based approach for the problem of MLS detection, which exploits task-specific structural knowledge. We evaluate our method on a large dataset containing heterogeneous images with significant MLS and show that its mean error approaches the inter-expert variability. Finally, we show the robustness of our approach by validating it on an external dataset, acquired during routine clinical practice.
Figures

Figures from the paper (1 more)
Reference graph
Works this paper leans on
-
[1]
Journal of visualized experiments: JoVE (74) (2013)
Chen, W., Belle, A., Cockrell, C., Ward, K.R., Najarian, K.: Automated midline shift and intracranial pressure estimation based on brain ct images. Journal of visualized experiments: JoVE (74) (2013)
work page 2013
-
[2]
The Lancet 392(10162), 2388–2396 (2018)
Chilamkurthy, S., Ghosh, R., Tanamala, S., Biviji, M., Campeau, N.G., Venugopal, V.K., Mahajan, V., Rao, P., Warier, P.: Deep learning algorithms for detection of critical findings in head ct scans: a retrospective study. The Lancet 392(10162), 2388–2396 (2018)
work page 2018
-
[3]
International Journal of Radiation Oncology* Biology* Physics 48(5), 1359–1362 (2000)
Gamburg, E.S., Regine, W.F., Patchell, R.A., Strottmann, J.M., Mohiuddin, M., Young, A.B.: The prognostic significance of midline shift at presentation on sur- vival in patients with glioblastoma multiforme. International Journal of Radiation Oncology* Biology* Physics 48(5), 1359–1362 (2000)
work page 2000
-
[4]
In: Proceedings of the IEEE conference on computer vision and pattern recognition
He, K., Zhang, X., Ren, S., Sun, J.: Deep residual learning for image recognition. In: Proceedings of the IEEE conference on computer vision and pattern recognition. pp. 770–778 (2016)
2016
-
[5]
Journal of neurotrauma 28(2), 203–215 (2011)
Jacobs, B., Beems, T., van der Vliet, T.M., Diaz-Arrastia, R.R., Borm, G.F., Vos, P.E.: Computed tomography and outcome in moderate and severe traumatic brain injury: hematoma volume and midline shift revisited. Journal of neurotrauma 28(2), 203–215 (2011)
work page 2011
-
[6]
Jain, S., Vande Vyvere, T., Terzopoulos, V., Maria Sima, D., Roura, E., Maas, A., Wilms, G., Verheyden, J.: Automatic quantification of ct features in acute traumatic brain injury. Journal of Neurotrauma (2019)
work page 2019
-
[7]
arXiv preprint arXiv:1412.6980 (2014)
Kingma, D.P., Ba, J.: Adam: A method for stochastic optimization. arXiv preprint arXiv:1412.6980 (2014)
arXiv 2014
-
[8]
International journal of biomedical imaging 2018 (2018)
Liao, C.C., Chen, Y.F., Xiao, F.: Brain midline shift measurement and its automa- tion: a review of techniques and algorithms. International journal of biomedical imaging 2018 (2018)
work page 2018
Show all 16 references
-
[9]
Computerized Medical Imaging and Graphics 38(1), 1–14 (2014)
Liu, R., Li, S., Su, B., Tan, C.L., Leong, T.Y., Pang, B.C., Lim, C.T., Lee, C.K.: Automatic detection and quantification of brain midline shift using anatomical marker model. Computerized Medical Imaging and Graphics 38(1), 1–14 (2014)
2014
-
[10]
Journal of the American College of Radiology 15(3), 577–579 (2018)
McGinty, G.B., Allen, B.: The acr data science institute and ai advisory group: harnessing the power of artificial intelligence to improve patient care. Journal of the American College of Radiology 15(3), 577–579 (2018)
2018
-
[11]
In: 3D Vision (3DV), 2016 Fourth International Conference on
Milletari, F., Navab, N., Ahmadi, S.A.: V-net: Fully convolutional neural networks for volumetric medical image segmentation. In: 3D Vision (3DV), 2016 Fourth International Conference on. pp. 565–571. IEEE (2016)
2016
-
[12]
IEEE transac- tions on systems, man, and cybernetics 9(1), 62–66 (1979)
Otsu, N.: A threshold selection method from gray-level histograms. IEEE transac- tions on systems, man, and cybernetics 9(1), 62–66 (1979)
1979
-
[13]
Journal of Neuroimaging 28(1), 61–63 (2018)
Paletta, N., Maali, L., Zahran, A., Sethuraman, S., Figueroa, R., Nichols, F.T., Bruno, A.: A simplified quantitative method to measure brain shifts in patients with middle cerebral artery stroke. Journal of Neuroimaging 28(1), 61–63 (2018)
2018
-
[14]
Neurology 49(4), 1090–1095 (1997)
Pullicino, P.M., Alexandrov, A., Shelton, J., Alexandrova, N., Smurawska, L., Nor- ris, J.: Mass effect and death from severe acute stroke. Neurology 49(4), 1090–1095 (1997)
1997
-
[15]
In: MICCAI
Ronneberger, O., Fischer, P., Brox, T.: U-net: Convolutional networks for biomed- ical image segmentation. In: MICCAI. pp. 234–241. Springer (2015)
2015
-
[16]
Journal of neurosurgery 71(4), 498–502 (1989)
Ross, D.A., Olsen, W.L., Ross, A.M., Andrews, B.T., Pitts, L.H.: Brain shift, level of consciousness, and restoration of consciousness in patients with acute intracra- nial hematoma. Journal of neurosurgery 71(4), 498–502 (1989)
1989
Reviewed August 14, 2026 · model on record in the stance chip above.
Discussion (0). Continue with ORCID to comment.