REVIEW 2 major objections 4 minor 54 references
Forecast Encompassing Tests for the Expected Shortfall
T0 review · 2 major / 4 minor · reviewed 2026-08-14 · deepseek-v4-flash
Pith's one-line read The paper introduces three forecast encompassing tests for Expected Shortfall, proves the tests stay valid when the risk model is misspecified, and shows one variant needs only the ES forecasts banks already report.
desk verdict The paper gives the first forecast encompassing tests for Expected Shortfall; the joint and auxiliary variants are solid, but the strict ES test's advertised robustness rests on an unproven negligibility claim that the simulations do not fully support. read the letter →
The pith
A machine-rendered reading of the paper's core claim, the machinery that carries it, and where it could break.
The reading
What carries the argument
The central object is the zero-homogeneous joint loss function for the pair (VaR, ES), $\rho(Y,q,e) = -\frac{1}{e}\left(e - q + \frac{(q-Y)\mathbf{1}\{Y\le q\}}{\alpha}\right) + \log(-e)$, introduced by Fissler and Ziegel (2016). Because the ES alone is not elicitable, this loss supplies the moment conditions and the semiparametric regressions $Y_{t+1} = g_q(\hat{q}_t,\beta) + u^q_{t+1}$ and $Y_{t+1} = g_e(\hat{e}_t,\eta) + u^e_{t+1}$, through which the optimal combination weights are estimated by M-estimation. A general link function $g$ maps two competing forecasts and parameters into a linear or nonlinear forecast combination; the null hypothesis that forecast 1 encompasses forecast 2 is $\theta^* = \theta_0$, meaning the weight on forecast 2 is zero and the weight on forecast 1 is one. The strict ES test sets the quantile link to $g_q(\hat{e}_t,\beta)$, using ES forecasts in place of VaR forecasts, and the misspecification-robust asymptotic theory in Propositions 2.8 and 2.9 plus Theorem 2.10 is what keeps the Wald statistics $\chi^2$ under the null.
What would settle it
Simulate a data-generating process with pronounced time-varying skewness so the ratio of ES to VaR moves substantially, generate two forecasts where one truly encompasses the other, run the strict ES test at $n=5000$, and check the empirical rejection rate; if it stays far above the 10% nominal level or the estimated weight on the encompassing forecast is not near one, the paper's negligibility argument fails.
Extended reading notes
Core claim
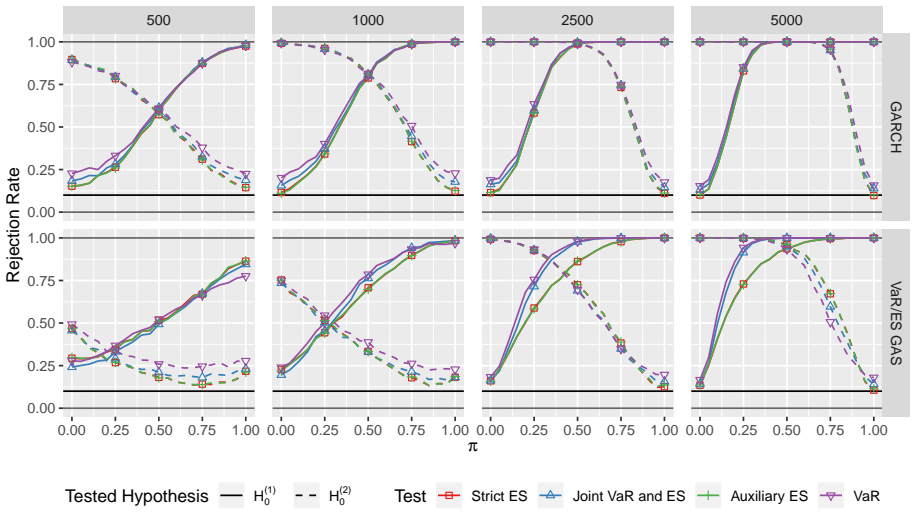
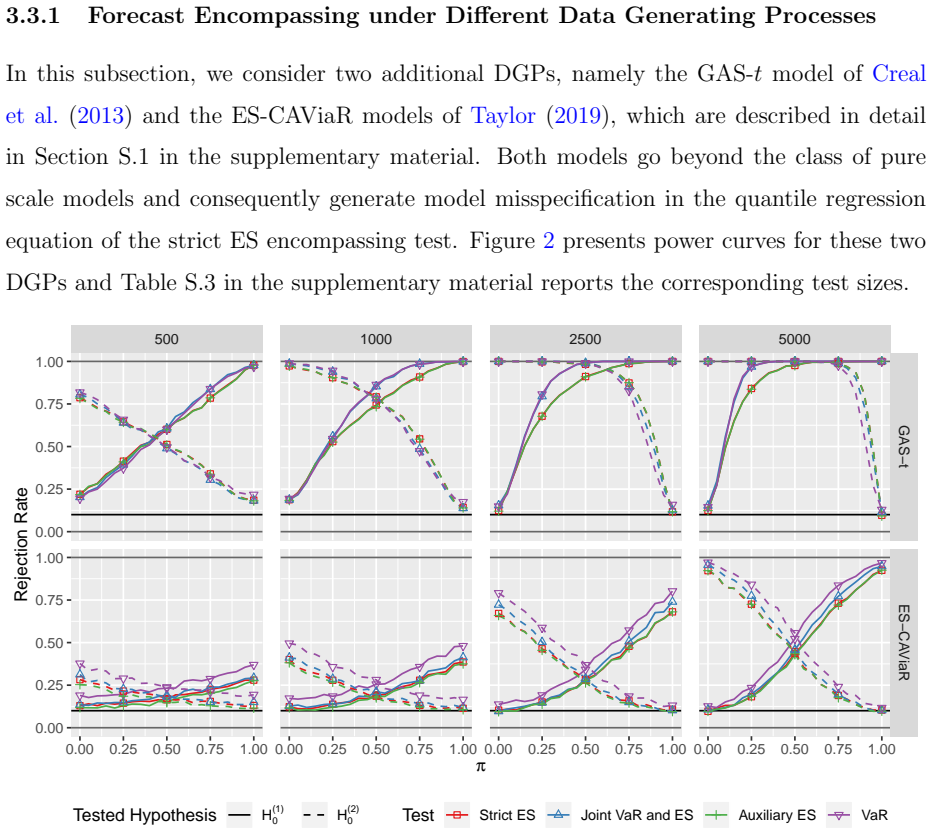
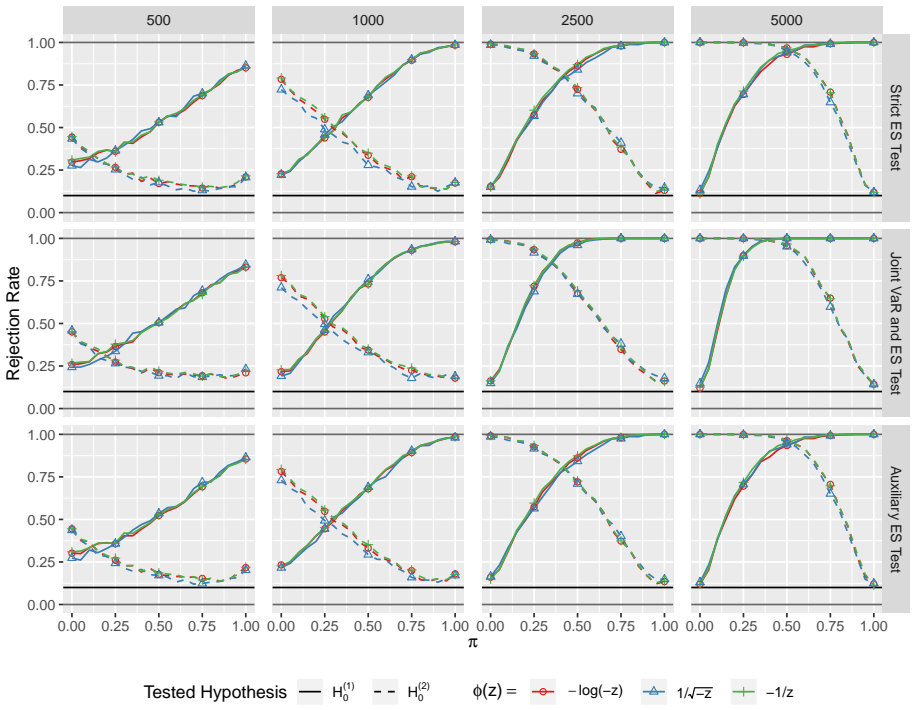
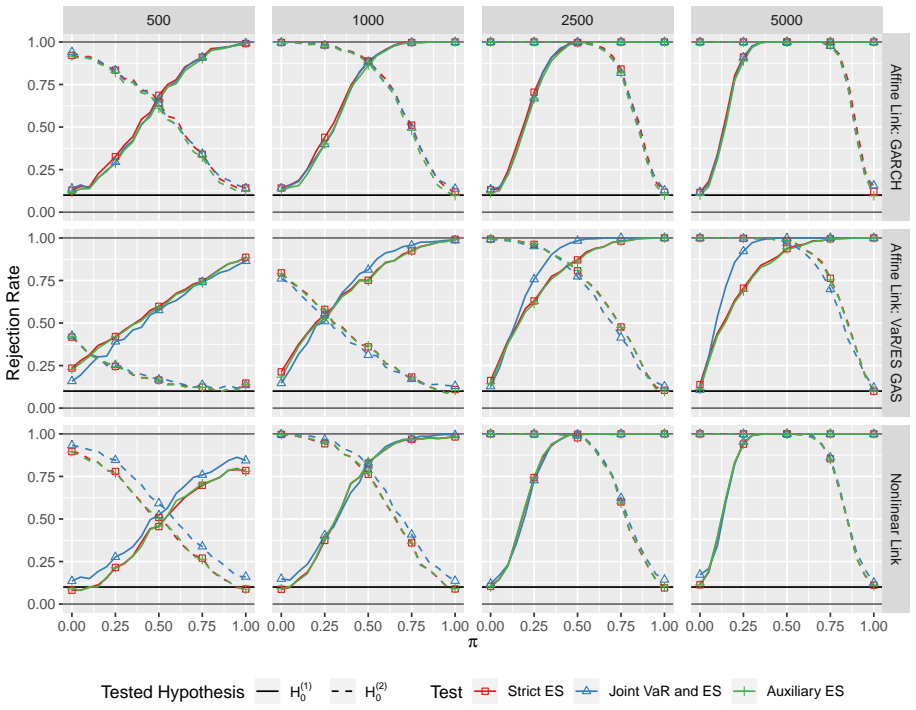
The paper's central claim is that forecast encompassing for the ES can be tested through M-estimation of a joint VaR–ES regression, and that the resulting Wald tests are valid even when the regression model is misspecified. Theorem 2.10 states that under Assumption 2.7 the test statistics of all three variants converge to a chi-squared distribution with degrees of freedom equal to the number of restricted parameters: four for the joint test, two for the auxiliary and strict tests under linear link functions. The asymptotic theory generalizes the joint quantile–ES M-estimator developed in earlier work to potentially misspecified nonlinear link functions, and uses a misspecification-robust covariance estimator assembled from the nid estimator of the density quantile and the scl-sp estimator of the truncated variance. The simulation evidence belongs to the claim: all three tests show approximately correct size and good power across GARCH, VaR/ES GAS, GAS-t, and ES-CAViaR DGPs, and the strict ES test behaves almost identically to the auxiliary test even though it uses no VaR forecasts, which supports the paper's argument that the misspecification from substituting ES forecasts for quantile forecasts is negligible in realistic financial settings.
Load-bearing premise
The load-bearing premise is that putting ES forecasts where the quantile forecasts belong in the strict test does not materially shift the estimated combination weights away from $(1,0)$ when one forecast truly encompasses the other; the paper argues this effect is negligible rather than proving it, and its own VaR/ES GAS simulation still rejects about 13.5% of the time at a 10% nominal level when $n=5000$.
Editorial extensions
If this is right
- Regulators who receive only ES forecasts, as under Basel III reporting rules, can run pairwise encompassing tests without needing the underlying VaR forecasts.
- When both directional hypotheses are rejected, the estimated combination weights from the joint regression provide a direct way to build a combined ES forecast, and the empirical application shows such combinations frequently beat stand-alone models for the IBM stock.
- The tests are implemented for linear, affine, and nonlinear link functions, so practitioners can choose the forecast combination formula that fits their setting.
- Because the strict and auxiliary tests behave almost identically in the simulations, the strict test loses little by not using VaR forecasts and can replace the auxiliary test when only ES forecasts are reported.
- The misspecification-robust asymptotic theory covers nonlinear models, which was not previously available for joint VaR–ES M-estimation and supports flexible parametric forecast combination.
Reading between the lines
- The strict ES test's clean behavior probably relies on the near proportionality of VaR and ES that holds for scale-type daily return models; in asset classes with strongly time-varying higher moments, the quantile misspecification could be larger than the 13.5% rejection observed here, so a cautious user would validate the test on the target data before trusting it.
- The same joint-loss machinery transfers to other jointly elicitable functionals, such as range value at risk or the mean–variance pair, which the paper notes as future work; the misspecification-robust M-estimation theory would need to be reworked for each new functional.
- A direct empirical check of the strict test's key assumption is to compare its estimated combination weights with those from the correctly specified joint model on datasets where both VaR and ES forecasts are available; systematic divergence would quantify the information lost by dropping VaR forecasts.
- Conditional encompassing tests that use instruments beyond the forecasts themselves would require extending the theory to overidentified GMM with nonsmooth moments, which the paper leaves open; if supplied, such tests could identify which variables drive the misspecification.
Signed reviews
Editorial analysis
A structured set of objections, weighed in public.
Referee Report
Summary. This paper proposes three forecast encompassing tests for Expected Shortfall (ES) based on the FZ0 joint loss function: a joint VaR-and-ES test, an auxiliary ES test, and a strict ES test that requires only ES forecasts. The authors develop misspecification-robust asymptotic theory for the M-estimator of the combination parameters, derive Wald tests for linear and nonlinear link functions, and investigate finite-sample size and power in simulations calibrated to GARCH, GAS, and CAViaR DGPs. An empirical application to IBM, S&P 500, and DAX returns illustrates the use of the tests for forecast selection and combination.
Significance. If the results hold, the paper makes a useful contribution to risk management by providing the first encompassing tests for ES, and the strict ES test is especially valuable because Basel III requires banks to report only ES forecasts. The misspecification-robust asymptotic theory for nonlinear link functions extends prior work, and the simulations are extensive and based on realistic DGPs. However, the central claim that the strict ES test is robust to quantile misspecification rests on a negligibility argument that is not formally proved, which limits the strength of the headline result.
major comments (2)
- [Section 2.2 and Theorem 2.10] The strict ES encompassing test in Definition 2.6 tests the restriction η*=η0, where η* is the pseudo-true parameter defined in (2.15). The economic null of interest, that forecast e1 encompasses e2, requires that whenever e1 genuinely encompasses e2, the pseudo-true parameter satisfies η*=(1,0). The paper states after Definition 2.6 that the misspecification bias is 'negligible' but does not provide a proof or a set of sufficient conditions. Theorem 2.10 only gives a chi-squared limit for the test statistic under the hypothesis η*=η0; it does not establish that the economic null implies η*=η0. The simulation results in Table 1 are not decisive: for the VaR/ES GAS DGP at n=5000, the strict test shows rejection rates of 13.5% and 10.6% at the 10% level for the two hypotheses, which could reflect a small asymptotic bias, though the H1 size point corresponds to a correctly specified DGP (the 1F GAS model has colinear VaR and ES). Please provide a formal analysis of the pseudo-true parameters under misspecification, or clearly redefine the null as testing η*=η0 and discuss the economic interpretation accordingly.
- [Section 2.3, covariance estimation] The covariance matrix estimator Ω̂ relies on the approximation Ft(gq_t(β*))≈α, which is exact when the quantile link is correctly specified but not in general. For the strict ES test under misspecification, the term Ft(gq_t(β*))-α in Eq. (2.22) is nonzero, and the approximation is justified only by a heuristic 'the degree of misspecification is small' argument. Theorem 2.10 assumes that Ω̂-Ω_n converges to zero, but the consistency of the nonparametric estimators (nid and scl-sp) under the misspecification conditions of Assumption 2.7 is not established. The authors should either prove consistency of Ω̂ or provide a reference that does so in this setting.
minor comments (4)
- [Table 1 and notes] The column labels 'Str ES', 'Aux ES', 'VaR ES', and 'VaR' are potentially confusing; the 'VaR ES' column refers to the joint VaR-and-ES test, but the abbreviation is not defined in the table note. I suggest renaming the column to 'Joint VaR/ES' for clarity.
- [Equation (2.24)] The displayed expression is split across lines and the bracket opened at the end is closed only in the following display; please reformat to make the expression self-contained.
- [Section 4 and Assumption 2.7] The paper uses a fixed forecasting scheme with one-time in-sample estimation, but the asymptotic theory in Section 2 does not explicitly account for estimation error in forecast parameters. The paper cites Giacomini and White (2006), but it should be stated more clearly that the tests are intended for fixed forecast methods rather than models with estimated parameters.
- [Section 3.2, Table 1] With 2000 Monte Carlo replications and a nominal size of 10%, the binomial standard error is about 0.9%, so the difference between 13.5% and 10% is just under four standard errors. Reporting standard errors or confidence bands for the size estimates would help the reader judge the significance of the deviations.
Circularity Check
No circular derivation detected: the tests are built on external elicitability results, the asymptotic theorems are proved in the paper, and the strict-test robustness gap is an unproven empirical claim rather than a circular reduction.
full rationale
The paper's derivation chain is self-contained against external benchmarks. The joint VaR/ES loss function is taken from Fissler and Ziegel (2016), an external result, and the encompassing null hypotheses are defined as standard parameter restrictions. Theorem 2.10 is derived, not assumed: Propositions 2.8 and 2.9 are proved in Appendix A under explicit mixing and moment conditions in Assumption 2.7. The M-estimation framework extends Patton et al. (2019) and Dimitriadis and Bayer (2019) to misspecified nonlinear settings, and the proofs are carried out in the paper rather than imported by citation. Self-citations to Dimitriadis and Bayer (2019) and Bayer and Dimitriadis (2020) provide methodological ingredients such as covariance estimators and the joint regression setup, but these are not used to assert a conclusion that is then relabeled as a prediction; the central asymptotic distribution result is proven in the manuscript. Simulation DGPs use calibrated parameters from external sources, including Patton et al. (2019), Taylor (2019), and Creal et al. (2013), not free parameters fitted to the target result. The strict ES test's robustness under quantile misspecification is asserted rather than proved: the paper states, 'The potential model misspecification might bias the pseudo-true parameters and challenge the interpretability of the test decision, but we argue that this effect is negligible for this setup,' and Table 1 shows some size distortion at 13.5% for a 10% nominal level under the VaR/ES GAS DGP at n=5000. That is a missing proof and a correctness risk, not a circular identification of a fitted input with a prediction. No equation in the paper reduces to its own input by construction, and the strict test's parameter restriction is a definitional null hypothesis rather than a derived empirical claim presented as novel evidence.
Assumptions & free parameters
assumptions (3)
- domain assumption Assumption 2.7(a)-(i): strong mixing, compact parameter space, unique pseudo-true minimizer with uncorrelated score, smooth bounded densities, bounded moment conditions, and separation of link functions.
- ad hoc to paper The misspecification bias of the strict ES test's pseudo-true parameters is negligible in realistic financial settings.
- ad hoc to paper In covariance estimation, the conditional distribution function at the pseudo-true quantile is approximated by alpha, namely Ft(gq_t(beta*)) approximately equals alpha.
Cite this review
Pith. "Pith review of Forecast Encompassing Tests for the Expected Shortfall." pith.science (2026). https://pith.science/paper/LOBZEIKW
@misc{pith2026190804569,
  author       = {Pith},
  title        = {Pith review of: Forecast Encompassing Tests for the Expected Shortfall},
  year         = {2026},
  howpublished = {\url{https://pith.science/paper/LOBZEIKW}},
  note         = {Machine review of arXiv:1908.04569}
}
read the original abstract
We introduce new forecast encompassing tests for the risk measure Expected Shortfall (ES). The ES currently receives much attention through its introduction into the Basel III Accords, which stipulate its use as the primary market risk measure for the international banking regulation. We utilize joint loss functions for the pair ES and Value at Risk to set up three ES encompassing test variants. The tests are built on misspecification robust asymptotic theory and we investigate the finite sample properties of the tests in an extensive simulation study. We use the encompassing tests to illustrate the potential of forecast combination methods for different financial assets.
Figures
Figures from the paper (1 more)
Reference graph
Works this paper leans on
-
[1]
Artzner, P., Delbaen, F., Eber, J.-M., and Heath, D. (1999). C oherent M easures of R isk. Mathematical Finance , 9(3):203--228
work page 1999
-
[2]
Barendse, S. (2017). Interquantile Expectation Regression . Available at https://ssrn.com/abstract=2937665
work page 2017
-
[3]
F undamental review of the trading book: A revised market risk framework
Basel Committee (2013). F undamental review of the trading book: A revised market risk framework. Technical report, Bank for International Settlements. Available at http://www.bis.org/publ/bcbs265.pdf
work page 2013
-
[4]
M inimum capital requirements for M arket R isk
Basel Committee (2016). M inimum capital requirements for M arket R isk. Technical report, Bank for International Settlements. Available at http://www.bis.org/bcbs/publ/d352.pdf
work page 2016
-
[5]
P illar 3 disclosure requirements -- consolidated and enhanced framework
Basel Committee (2017). P illar 3 disclosure requirements -- consolidated and enhanced framework. Technical report, Basel Committee on Banking Supervision. Available at http://www.bis.org/bcbs/publ/d400.pdf
work page 2017
-
[6]
Regression Based Expected Shortfall Backtesting
Bayer, S. and Dimitriadis, T. (2019). Regression based expected shortfall backtesting. arXiv:1801.04112 [q-fin.RM]
work page Pith review arXiv 2019
-
[7]
Bollerslev, T. (1986). G eneralized autoregressive conditional heteroskedasticity. Journal of Econometrics , 31(3):307--327
work page 1986
-
[8]
Chong, Y. Y. and Hendry, D. (1986). Econometric evaluation of linear macro-economic models. Review of Economic Studies , 53(4):671--690
work page 1986
Show all 54 references
-
[9]
Clements, M. P. and Harvey, D. I. (2009). Forecast combination and encompassing. In Mills, T. C. and Patterson, K., editors, Palgrave Handbook of Econometrics: Volume 2: Applied Econometrics , pages 169--198. Palgrave Macmillan UK, London
2009
-
[10]
Clements, M. P. and Harvey, D. I. (2010). Forecast encompassing tests and probability forecasts. Journal of Applied Econometrics , 25(6):1028--1062
2010
-
[11]
Cont, R., Deguest, R., and Scandolo, G. (2010). Robustness and sensitivity analysis of risk measurement procedures. Quantitative Finance , 10(6):593--606
2010
-
[12]
J., and Lucas, A
Creal, D., Koopman, S. J., and Lucas, A. (2013). Generalized autoregressive score models with applications. Journal of Applied Econometrics , 28(5):777--795
2013
-
[13]
Danielsson, J., Embrechts, P., Goodhart, C., Keating, C., Muennich, F., Renault, O., and Shin, H. S. (2001). An Academic Response to Basel II . Financial Markets Group Special Papers, available at https://EconPapers.repec.org/RePEc:fmg:fmgsps:sp130
2001
-
[14]
and Mariano, R
Diebold, F. and Mariano, R. (1995). C omparing P redictive A ccuracy. Journal of Business & Economic Statistics , 13(3):253--63
1995
-
[15]
Diebold, F. X. (1989). Forecast combination and encompassing: Reconciling two divergent literatures. International Journal of Forecasting , 5(4):589 -- 592
1989
-
[16]
and Bayer, S
Dimitriadis, T. and Bayer, S. (2019). A joint quantile and expected shortfall regression framework . Electron. J. Statist. , 13(1):1823--1871
2019
-
[17]
Elliott, G., Komunjer, I., and Timmermann, A. (2005). Estimation and testing of forecast rationality under flexible loss. The Review of Economic Studies , 72(4):1107--1125
2005
-
[18]
Embrechts, P., Liu, H., and Wang, R. (2018). Quantile-based risk sharing. Operations Research , 66(4):936--949
2018
-
[19]
and Manganelli, S
Engle, R. and Manganelli, S. (2004a). CAV ia R : C onditional A utoregressive V alue at R isk by R egression Q uantiles. Journal of Business & Economic Statistics , 22(4):367--381
2004
-
[20]
Engle, R. F. and Manganelli, S. (2004b). Caviar: Conditional autoregressive value at risk by regression quantiles. Journal of Business & Economic Statistics , 22(4):367--381
2004
-
[21]
Ericsson, N. R. (1993). On the limitations of comparing mean square forecast errors: Clarifications and extensions. Journal of Forecasting , 12(8):644--651
1993
-
[22]
and Ziegel, J
Fissler, T. and Ziegel, J. F. (2016). H igher order elicitability and Osband's principle. Annals of Statistics , 44(4):1680--1707
2016
-
[23]
and Ziegel, J
Fissler, T. and Ziegel, J. F. (2019). Elicitability of range value at risk. arXiv:1902.04489 [math.ST]
2019 arXiv
-
[24]
F., and Gneiting, T
Fissler, T., Ziegel, J. F., and Gneiting, T. (2016). E xpected S hortfall is jointly elicitable with V alue at R isk - I mplications for backtesting. Risk , January:58--61
2016
-
[25]
and Komunjer, I
Giacomini, R. and Komunjer, I. (2005). Evaluation and combination of conditional quantile forecasts. Journal of Business & Economic Statistics , 23:416--431
2005
-
[26]
and White, H
Giacomini, R. and White, H. (2006). Tests of conditional predictive ability. Econometrica , 74(6):1545--1578
2006
-
[27]
and Skorokhod, A
Gikhman, I. and Skorokhod, A. (2004). T he T heory of S tochastic P rocesses I , volume 210 of Classics in Mathematics . Springer Berlin Heidelberg
2004
-
[28]
R., Jagannathan, R., and Runkle, D
Glosten, L. R., Jagannathan, R., and Runkle, D. E. (1993). O n the R elation between the E xpected V alue and the V olatility of the N ominal E xcess R eturn on S tocks. The Journal of Finance , 48(5):1779--1801
1993
-
[29]
Gneiting, T. (2011). M aking and E valuating P oint F orecasts. Journal of the American Statistical Association , 106(494):746--762
2011
-
[30]
and Pohlmeier, W
Halbleib, R. and Pohlmeier, W. (2012). Improving the value at risk forecasts: Theory and evidence from the financial crisis . Journal of Economic Dynamics and Control , 36(8):1212--1228
2012
-
[31]
Hall, A. R. and Inoue, A. (2003). The large sample behaviour of the generalized method of moments estimator in misspecified models . Journal of Econometrics , 114(2):361--394
2003
-
[32]
Hansen, B. E. and Lee, S. (2019). Inference for iterated GMM under misspecification. Working Paper, available at https://www.ssc.wisc.edu/ bhansen/papers/IteratedGMM.html
2019
-
[33]
Harvey, A. (2013). Dynamic Models for Volatility and Heavy Tails . Cambridge University Press
2013
-
[34]
and Newbold, P
Harvey, D. and Newbold, P. (2000). Tests for multiple forecast encompassing. Journal of Applied Econometrics , 15(5):471--482
2000
-
[35]
Heinrich, C. (2014). The mode functional is not elicitable. Biometrika , 101(1):245--251
2014
-
[36]
and Richard, J.-F
Hendry, D. and Richard, J.-F. (1982). On the formulation of empirical models in dynamic econometrics. Journal of Econometrics , 20(1):3--33
1982
-
[37]
and Eulert, M
Holzmann, H. and Eulert, M. (2014). The role of the information set for forecasting—with applications to risk management. Ann. Appl. Stat. , 8(1):595--621
2014
-
[38]
Huber, P. (1967). T he behavior of maximum likelihood estimates under nonstandard conditions. In Proceedings of the Fifth Berkeley Symposium on Mathematical Statistics and Probability , pages 221--233. Berkeley: University of California Press
1967
-
[39]
Koenker, R. W. and Bassett, G. (1978). Regression quantiles. Econometrica , 46(1):33--50
1978
-
[40]
and Richard, J.-F
Mizon, G. and Richard, J.-F. (1986). The encompassing principle and its application to testing non-nested hypotheses. Econometrica , 54(3):657--78
1986
-
[41]
and Harvey, D
Newbold, P. and Harvey, D. I. (2007). Forecast Combination and Encompassing , chapter 12, pages 268--283. John Wiley and Sons, Ltd
2007
-
[42]
and McFadden, D
Newey, W. and McFadden, D. (1994). L arge sample estimation and hypothesis testing. In Engle, R. and McFadden, D., editors, Handbook of Econometrics , volume 4, chapter 36, pages 2111--2245. Elsevier
1994
-
[43]
and Ziegel, J
Nolde, N. and Ziegel, J. F. (2017). Elicitability and backtesting: Perspectives for banking regulation. The Annals of Applied Statistics , 11(4):1833--1874
2017
-
[44]
Patton, A. J. (2011). Data-based ranking of realised volatility estimators. Journal of Econometrics , 161:284--303
2011
-
[45]
Patton, A. J. (2019). Comparing possibly misspecified forecasts. Journal of Business & Economic Statistics , 0(0):1--14
2019
-
[46]
Patton, A. J. and Timmermann, A. (2007). Testing forecast optimality under unknown loss. Journal of the American Statistical Association , 102(480):1172--1184
2007
-
[47]
J., Ziegel, J
Patton, A. J., Ziegel, J. F., and Chen, R. (2019a). Dynamic semiparametric models for expected shortfall (and value-at-risk). Journal of Econometrics , 211(2):388 -- 413
2019
-
[48]
J., Ziegel, J
Patton, A. J., Ziegel, J. F., and Chen, R. (2019b). Supplemental appendix for dynamic semiparametric models for expected shortfall (and value-at-risk). available at https://doi.org/10.1016/j.jeconom.2018.10.008
2019 doi
-
[49]
Taylor, J. W. (2019). Forecasting value at risk and expected shortfall using a semiparametric approach based on the asymmetric laplace distribution. Journal of Business & Economic Statistics , 37(1):121--133
2019
-
[50]
Timmermann, A. (2006). Forecast combinations. In Elliott, G., Granger, C., and Timmermann, A., editors, Handbook of Economic Forecasting , volume 1, chapter 04, pages 135--196. Elsevier, 1 edition
2006
-
[51]
Weiss, A. A. (1991). Estimating nonlinear dynamic models using least absolute error estimation. Econometric Theory , 7(01):46--68
1991
-
[52]
West, K. (2006). Forecast evaluation. In Elliott, G., Granger, C., and Timmermann, A., editors, Handbook of Economic Forecasting , volume 1, chapter 03, pages 99--134. Elsevier, 1 edition
2006
-
[53]
White, H. (1994). Estimation, Inference and Specification Analysis . Econometric Society Monographs. Cambridge University Press
1994
-
[54]
White, H. (2001). Asymptotic Theory for Econometricians . Academic Press, San Diego
2001
Reviewed August 14, 2026 · model on record in the stance chip above.
Discussion (0). Continue with ORCID to comment.