REVIEW 3 major objections 5 minor 32 references
L2P: Learning to Place for Estimating Heavy-Tailed Distributed Outcomes
T0 review · 3 major / 5 minor · reviewed 2026-08-14 · deepseek-v4-flash
Pith's one-line read This paper claims that heavy-tailed outcome prediction is best done by learning pairwise comparisons between instances and then voting on where a new instance falls among known outcomes.
desk verdict L2P is a sensible and clearly described two-phase method, but the paper's central accuracy claim is not directly measured; it deserves serious refereeing, not a desk rejection. read the letter →
The pith
A machine-rendered reading of the paper's core claim, the machinery that carries it, and where it could break.
The reading
What carries the argument
The central object is the pairwise preference classifier C trained on concatenated feature vectors $[f_i, f_j]$ with labels $+1$ if $t_i > t_j$ and $-1$ otherwise. The placing stage turns this classifier into predictions: bins along the sorted target-value axis receive upvotes and downvotes from each training instance according to the predicted relationship direction, and the midpoint of the bin with the maximum total vote is the prediction. The paper shows this argmax vote count is a maximum likelihood estimate of the optimal bin under a uniform prior over bins and probabilities $p^l_i(q)$ and $p^r_i(q)$, so the mechanism is an ordinal-placement estimator rather than a score regression. The voting step is linear in $n$ and can absorb substantial pairwise classification error.
What would settle it
Run L2P and the baselines on the same three datasets and compute the mean absolute error on log-transformed outcomes. If XGBoost or LambdaMART achieves lower pointwise error while L2P only wins on adapted AUC and distribution distances, the central claim of accurate prediction would be falsified; a sharper version is to compare errors restricted to the top 5% of outcomes.
Extended reading notes
Core claim
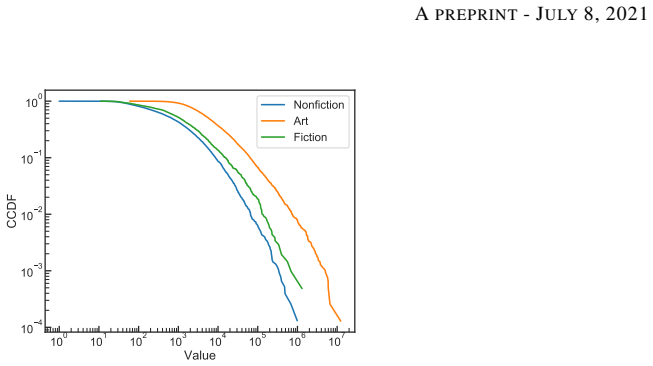
L2P claims that for heavy-tailed outcome variables, prediction accuracy and distribution fidelity are better achieved by recasting regression as a placement problem. Training builds a classifier over concatenated feature vectors of instance pairs, labeled by which instance's target value is larger. At test time, the classifier predicts the pairwise relationship between the new instance and every training instance; each training instance votes on all bins left or right of its own target value depending on the predicted relationship; and the bin with the highest vote determines the prediction. The paper argues via a maximum-likelihood calculation that this voting scheme is the optimal placement given the pairwise preferences, and it reports that L2P reaches top-tier AUC while also giving the most faithful heavy-tailed distribution in Q-Q plots and KS/EMD scores across nonfiction, fiction, and art auction data. It does not report a direct pointwise error metric such as mean absolute error.
Load-bearing premise
The load-bearing premise is that high scores on the paper's adapted ranking and distribution-matching metrics really mean accurate prediction, even though the paper notes that randomly shuffled true values can perfectly match the outcome distribution and the ranking metric does not measure error on individual values.
Editorial extensions
If this is right
- If L2P is right, practitioners predicting sales, prices, or demand with heavy tails should expect less under-prediction of top instances than from direct regression or XGBoost.
- Because placement is derived from pairwise order, the predicted distribution retains the heavy tail and should match Q-Q plots at high quantiles better than methods optimizing only point loss.
- The method's robustness means imperfect pairwise classifiers are acceptable: up to about 45% random pair errors leave overall AUC nearly unchanged.
- Each prediction comes with interpretable context—the neighboring training instances it was placed between—useful for decisions like publisher advances or artist representation.
Reading between the lines
- A direct pointwise error comparison, such as mean absolute error on log-transformed outcomes, would sharpen the empirical claim; the reported AUC and distribution distances alone leave open whether L2P's advantage is mainly in ordering.
- Because randomly shuffled true outcomes can achieve near-perfect KS and EMD, any heavy-tail method should be benchmarked against random permutation as a lower bound to show that distribution fidelity is not trivial.
- A natural extension is a hybrid approach that uses direct regression for mid-tail values and placement voting to protect the tail, or applying L2P to other heavy-tailed targets such as insurance claims or online engagement counts.
Signed reviews
Editorial analysis
A structured set of objections, weighed in public.
Referee Report
Summary. The paper proposes L2P, a two-stage method for predicting heavy-tailed outcome variables. In the training stage, L2P learns a binary pairwise-preference classifier on concatenated feature pairs labeled by which instance has the larger target value. In the placing stage, it compares a test instance to every training instance, converts the predicted pairwise relations into +/-1 votes over bins sorted by training target values, and predicts the midpoint of the highest-vote bin. The authors claim that L2P consistently outperforms six baselines on three real-world datasets (nonfiction book sales, fiction book sales, and art auction prices) both in reproducing the heavy-tailed distribution and in accurately predicting instance values, especially for 'big and rare' tail instances. A theoretical section argues that the voting stage is a maximum likelihood estimate of the optimal bin, and case studies illustrate model interpretability.
Significance. If the claimed empirical advantage were established, L2P would be a practically useful default for heavy-tailed targets, with the additional benefit of interpretable placements. Strengths of the paper include a clearly specified algorithm, publicly available code, 5-fold cross-validation, and comparison with six methods, including heavy-tailed linear regression and LambdaMART. However, the current evaluation does not measure per-instance point accuracy, so the load-bearing claim of accurate prediction, particularly for tail instances, is not yet demonstrated. The contribution is potentially significant but needs additional evaluation before its central claim can be accepted.
major comments (3)
- [Section 3.3, Eq. (3); Fig. 3] The evaluation does not measure point prediction accuracy, yet 'accurate predictions' is a central claim (abstract; Section 3.4.1 takeaway). The adapted AUC in Eq. (3) is a threshold-ranking metric: it checks whether predicted values exceed each actual threshold, not whether predicted and actual values are close. KS, EMD, and Q-Q plots compare marginal distributions, and the paper itself notes (Section 3.3) that random shuffling of true outcomes would achieve KS=0 and EMD=0. Consequently, a model could rank well and reproduce the marginal distribution while making large per-instance errors, such as systematically compressed predictions, especially in the tail. Please add direct error metrics on the original and log scales (MAE, RMSE, and mean/median absolute relative error), report fold-level means and standard deviations, and break these out for tail groups (e.g., top 1% and 5% of outcomes). Without these, the claim of consistent outperformance in accurate prediction is unsupported.
- [Algorithm 2; Section 3.4.1] The placing phase predicts the midpoint of adjacent unique training target values, so L2P's predictions are structurally bounded by the minimum and maximum observed training values. This matters for the claimed strength on 'big and rare' tail instances: if a held-out tail instance exceeds the training maximum, L2P cannot produce a value that large. The paper does not report how many test instances fall outside the training target range, nor their prediction errors. Please quantify this; if L2P cannot extrapolate beyond the training range, the tail-accuracy claim should be qualified accordingly.
- [Section 2.1] The theoretical justification that voting is a maximum likelihood estimator is a sketch, and the assumptions are not validated for the implemented algorithm. The derivation assumes independent evidence across training instances, a uniform prior over bins, and uniform conditional probability within the right/left region (footnote 4), but the implementation thresholds the pairwise probabilities into hard +1/-1 votes (footnote 3) rather than using p_l and p_r as written. As written, the proof does not establish that the implemented hard-voting rule is MLE. Please either provide a formal derivation for the exact voting rule used or present the MLE argument as an interpretation/heuristic.
minor comments (5)
- [Section 2.2, Algorithm 1] Algorithm 1 appears to implement the vanilla O(n^2) all-pairs training, but Section 2.2 describes an efficient training procedure using the parameters ns and k; the pseudocode does not include the near-instance sampling or the random sampling of non-near instances. Please add the sampling steps or explicitly label Algorithm 1 as the full training variant.
- [Section 3.3] The preprocessing description is ambiguous: 'we impose standard scaling on all the columns of the data matrix and the target variable. For all competing methods, we first take the logarithm...' does not make clear whether L2P also receives log-transformed features and target or only the baselines do. Please state explicitly which transformations are applied to L2P and confirm that all methods are compared on the same target scale.
- [Section 3.4.1, Fig. 3] The text says methods are grouped into tiers based on the mean and standard deviation of the score, but no confidence intervals or significance tests are reported. Adding fold-level confidence intervals, or significance tests for the new point-error metrics requested above, would make the 'consistent outperformance' claim assessable.
- [Section 3.4.1, Fig. 4] The LambdaMART failure analysis is performed on the full dataset, rather than on held-out folds. This is illustrative, but the statement that the failure to preserve neighborhood ranking is the 'root cause' of the poor held-out predictions goes beyond what this experiment establishes.
- [Section 3.4.1] There is a typo: 'LamdaMART' should be 'LambdaMART'.
Circularity Check
No circularity: L2P's pairwise classifier and bin-placement prediction are trained/derived separately, and the paper's metric limitations are measurement-validity concerns, not circular reasoning.
full rationale
The paper's derivation chain is self-contained and not circular. L2P trains a pairwise preference classifier on labeled pairs (Eq. 1-2) where labels come from the target variable, and then in the placing phase uses that classifier to obtain votes over bins defined by training target values, predicting the midpoint of the winning bin (Algorithm 2). This is the method's definition, not a hidden fitting of test outcomes. The theoretical analysis in Section 2.1 recasts voting as an MLE over pairwise-conditional placement probabilities, but that is an interpretation of the algorithm's own voting rule, not an independent result imported to justify the algorithm. The central empirical claim rests on adapted AUC plus KS/EMD; while these metrics may not directly establish per-instance point accuracy (the paper itself notes random shuffling gives KS=0 and EMD=0), that is a correctness/evaluation concern, not circularity. The paper's self-citations, such as [1] for the book-sales dataset and [12] for logarithmic binning, supply data or preprocessing choices and are not used as load-bearing evidence that L2P works. No fitted parameter is renamed as a prediction, and no uniqueness theorem or prior result is invoked to force the model choice. Therefore the appropriate circularity score is 0.
Assumptions & free parameters
free parameters (2)
- ns (number of comparison samples per training instance in efficient training) =
described as 20% of n, exact values not reported
- k (number of near instances per training instance) =
not reported
assumptions (3)
- domain assumption Pairwise comparisons learned from concatenated feature vectors are sufficient to place a new instance among training instances.
- ad hoc to paper Voting is maximum likelihood estimation: each training instance contributes independent evidence, with uniform prior over bins and uniform probability inside each region.
- domain assumption For efficient training, nearness in target value makes pairwise relationships harder, so sampling distant pairs suffices.
Cite this review
Pith. "Pith review of L2P: Learning to Place for Estimating Heavy-Tailed Distributed Outcomes." pith.science (2026). https://pith.science/paper/LOPBQMMM
@misc{pith2026190804628,
  author       = {Pith},
  title        = {Pith review of: L2P: Learning to Place for Estimating Heavy-Tailed Distributed Outcomes},
  year         = {2026},
  howpublished = {\url{https://pith.science/paper/LOPBQMMM}},
  note         = {Machine review of arXiv:1908.04628}
}
read the original abstract
Many real-world prediction tasks have outcome variables that have characteristic heavy-tail distributions. Examples include copies of books sold, auction prices of art pieces, demand for commodities in warehouses, etc. By learning heavy-tailed distributions, "big and rare" instances (e.g., the best-sellers) will have accurate predictions. Most existing approaches are not dedicated to learning heavy-tailed distribution; thus, they heavily under-predict such instances. To tackle this problem, we introduce Learning to Place (L2P), which exploits the pairwise relationships between instances for learning. In its training phase, L2P learns a pairwise preference classifier: is instance A > instance B? In its placing phase, L2P obtains a prediction by placing the new instance among the known instances. Based on its placement, the new instance is then assigned a value for its outcome variable. Experiments on real data show that L2P outperforms competing approaches in terms of accuracy and ability to reproduce heavy-tailed outcome distribution. In addition, L2P provides an interpretable model by placing each predicted instance in relation to its comparable neighbors. Interpretable models are highly desirable when lives and treasure are at stake.
Figures


Figures from the paper (2 more)


Reference graph
Works this paper leans on
-
[1]
Success in books: predicting book sales before publication
Xindi Wang, Burcu Yucesoy, Onur Varol, Tina Eliassi-Rad, and Albert-László Barabási. Success in books: predicting book sales before publication. EPJ Data Science, 8(1), 2019
work page 2019
-
[2]
Forecasting for inventory planning: a 50-year review
Aris A Syntetos, John E Boylan, and Stephen M Disney. Forecasting for inventory planning: a 50-year review. Journal of the Operational Research Society, 60(sup1):S149–S160, 2009
work page 2009
-
[3]
Smote: Synthetic minority over-sampling technique
Nitesh V Chawla, Kevin W Bowyer, Lawrence O Hall, and W Philip Kegelmeyer. Smote: Synthetic minority over-sampling technique. JAIR, 16, 2002
work page 2002
-
[4]
Maher Maalouf, Dirar Homouz, and Theodore B Trafalis. Logistic regression in large rare events and imbalanced data: A performance comparison of prior correction and weighting methods. Computational Intelligence, 34(1), 2018
work page 2018
-
[5]
Learning on the border: Active learning in imbalanced data classification
Seyda Ertekin, Jian Huang, Leon Bottou, and Lee Giles. Learning on the border: Active learning in imbalanced data classification. In CIKM, pages 127–136, 2007
work page 2007
-
[6]
Max Schubach, Matteo Re, Peter N Robinson, and Giorgio Valentini. Imbalance-aware machine learning for predicting rare and common disease-associated non-coding variants. Scientific Reports, 7(1), 2017
work page 2017
-
[7]
Logistic regression in rare events data
Gary King and Langche Zeng. Logistic regression in rare events data. Political Analysis, 9(2), 2001
work page 2001
-
[8]
A physical model for efficient ranking in networks
Caterina De Bacco, Daniel B Larremore, and Cristopher Moore. A physical model for efficient ranking in networks. Science Advances, 4(7), 2018
work page 2018
Show all 32 references
-
[9]
Aggregating inconsistent information: Ranking and clustering
Nir Ailon, Moses Charikar, and Alantha Newman. Aggregating inconsistent information: Ranking and clustering. J. ACM, 55(5):23:1–23:27, 2008
2008
-
[10]
Learning to order things
William W Cohen, Robert E Schapire, and Yoram Singer. Learning to order things. In NIPS, pages 451–457, 1998
1998
-
[11]
Quantifying reputation and success in art
Samuel P Fraiberger, Roberta Sinatra, Magnus Resch, Christoph Riedl, and Albert-László Barabási. Quantifying reputation and success in art. Science, 362(6416), 2018
2018
-
[12]
It’s who you know: Graph mining using recursive structural features
Keith Henderson, Brian Gallagher, Lei Li, Leman Akoglu, Tina Eliassi-Rad, Hanghang Tong, and Christos Faloutsos. It’s who you know: Graph mining using recursive structural features. In KDD, pages 663–671, 2011
2011
-
[13]
Heavy-tailed regression with a generalized median-of-means
Daniel Hsu and Sivan Sabato. Heavy-tailed regression with a generalized median-of-means. In ICML, pages 37–45, 2014
2014
-
[14]
XGBoost: A scalable tree boosting system
Tianqi Chen and Carlos Guestrin. XGBoost: A scalable tree boosting system. In KDD, pages 785–794, 2016
2016
-
[15]
Optimizing search engines using clickthrough data
Thorsten Joachims. Optimizing search engines using clickthrough data. In KDD, pages 133–142, 2002
2002
-
[16]
From ranknet to lambdarank to lambdamart: An overview
Christopher JC Burges. From ranknet to lambdarank to lambdamart: An overview. Learning, 11(23-581):81, 2010
2010
-
[17]
Learning to rank with nonsmooth cost functions
Christopher J Burges, Robert Ragno, and Quoc V Le. Learning to rank with nonsmooth cost functions. In Advances in neural information processing systems, pages 193–200, 2007. 11 A PREPRINT - J ULY 8, 2021
2007
-
[18]
Greedy function approximation: A gradient boosting machine
Jerome H Friedman. Greedy function approximation: A gradient boosting machine. Annals of Statistics , 29(5):1189–1232, 2001
2001
-
[19]
Estimation of high conditional quantiles for heavy-tailed distributions
Huixia Judy Wang, Deyuan Li, and Xuming He. Estimation of high conditional quantiles for heavy-tailed distributions. JASA, 107(500):1453–1464, 2012
2012
-
[20]
Robust regression with asymmetric heavy-tail noise distributions
Ichiro Takeuchi, Yoshua Bengio, and Takafumi Kanamori. Robust regression with asymmetric heavy-tail noise distributions. Neural Computation, 14(10):2469–2496, 2002
2002
-
[21]
L1 regression with heavy-tailed distributions
Lijun Zhang and Zhi-Hua Zhou. L1 regression with heavy-tailed distributions. In NeurIPS, volume 31, pages 1076–1086, 2018
2018
-
[22]
Ordinal regression by extended binary classification
Ling Li and Hsuan-Tien Lin. Ordinal regression by extended binary classification. In NIPS, volume 19, pages 865–872, 2007
2007
-
[23]
A survey of predictive modeling on imbalanced domains
Paula Branco, Luís Torgo, and Rita P Ribeiro. A survey of predictive modeling on imbalanced domains. ACM Computing Surveys, 49(2), 2016
2016
-
[24]
Adasyn: Adaptive synthetic sampling approach for imbalanced learning
Haibo He, Yang Bai, Edwardo A Garcia, and Shutao Li. Adasyn: Adaptive synthetic sampling approach for imbalanced learning. In IEEE IJCNN, pages 1322–1328, 2008
2008
-
[25]
Learning when data sets are imbalanced and when costs are unequal and unknown
Marcus A Maloof. Learning when data sets are imbalanced and when costs are unequal and unknown. In ICML Workshop on Learning from Imbalanced Data Sets II, volume 2, 2003
2003
-
[26]
Utility-based regression
Luis Torgo and Rita Ribeiro. Utility-based regression. In PKDD, pages 597–604, 2007
2007
-
[27]
Sinha, and Huimin Zhao
Gaurav Bansal, Atish P. Sinha, and Huimin Zhao. Tuning data mining methods for cost-sensitive regression: A study in loan charge-off forecasting. J. of Mgmt Info Sys, 25(3):315–336, 2008
2008
-
[28]
Evaluating and tuning predictive data mining models using receiver operating characteristic curves
Atish P Sinha and Jerrold H May. Evaluating and tuning predictive data mining models using receiver operating characteristic curves. J. of Mgmt Info Sys, 21(3):249–280, 2004
2004
-
[29]
Fast pairwise query selection for large-scale active learning to rank
Buyue Qian, Xiang Wang, Jun Wang, Hongfei Li, Nan Cao, Weifeng Zhi, and Ian Davidson. Fast pairwise query selection for large-scale active learning to rank. In IEEE ICDM, pages 607–616, 2013
2013
-
[30]
An online algorithm for large scale image similarity learning
Gal Chechik, Uri Shalit, Varun Sharma, and Samy Bengio. An online algorithm for large scale image similarity learning. In NIPS, volume 22, pages 306–314, 2009
2009
-
[31]
Fast similarity search for learned metrics
Brian Kulis, Prateek Jain, and Kristen Grauman. Fast similarity search for learned metrics. IEEE TPAMI, 31(12):2143–2157, 2009
2009
-
[32]
Deep supervised hashing for fast image retrieval
Haomiao Liu, Ruiping Wang, Shiguang Shan, and Xilin Chen. Deep supervised hashing for fast image retrieval. In CVPR, pages 2064–2072, 2016. 12 Supplementary Information July 8, 2021 1 Supplementary Material 1.1 Reproducibility The code for Python implementation of L2P method i...
2016 arXiv
Reviewed August 14, 2026 · model on record in the stance chip above.
Discussion (0). Continue with ORCID to comment.