REVIEW 3 major objections 6 minor 23 references
Construction of efficient detectors for character information recognition
T0 review · 3 major / 6 minor · reviewed 2026-08-14 · deepseek-v4-flash
Pith's one-line read A modified Census transform gives the most efficient railway-digit detectors.
desk verdict A modest, honest engineering comparison of Haar/LBP/Census features for railway carriage number detection; the headline claim outruns a single 274-image test set. read the letter →
The pith
A machine-rendered reading of the paper's core claim, the machinery that carries it, and where it could break.
The reading
What carries the argument
The central object is the modified Census transform extended to a rectangle of arbitrary size, which the paper calls a non-local binary pattern: a 9-bit code $C$ whose bits are set by comparing the mean brightness of each of nine equal sub-regions of a rectangular aperture with the mean brightness of the whole aperture. This turns the image into a high-dimensional feature space of codes $0 \le C \le 511$. The argument is carried by pairing that coding with the AdaBoost cascade: weak classifiers are built from per-code likelihood estimates, strong classifiers are weighted sums of weak classifiers, and detectors are serial cascades of strong classifiers; the overlap parameter controls how densely the scanning window samples the training and search images. The mechanism explains the efficiency gain as richer local structure captured in one 9-bit pattern, so the boosted cascade reaches its error target with fewer weak classifiers.
What would settle it
To test the ranking, run the same three feature families under identical cascade training on several independent datasets of car numbers, license plates, and text captured in different lighting, weather, and camera positions, and report feature counts and false-rejection rates with cross-validation. If Haar features or LBP match or beat the modified Census transform in both feature count and FRR at overlap 0.75-0.8 on any such dataset, the paper's central conclusion is falsified.
Extended reading notes
Core claim
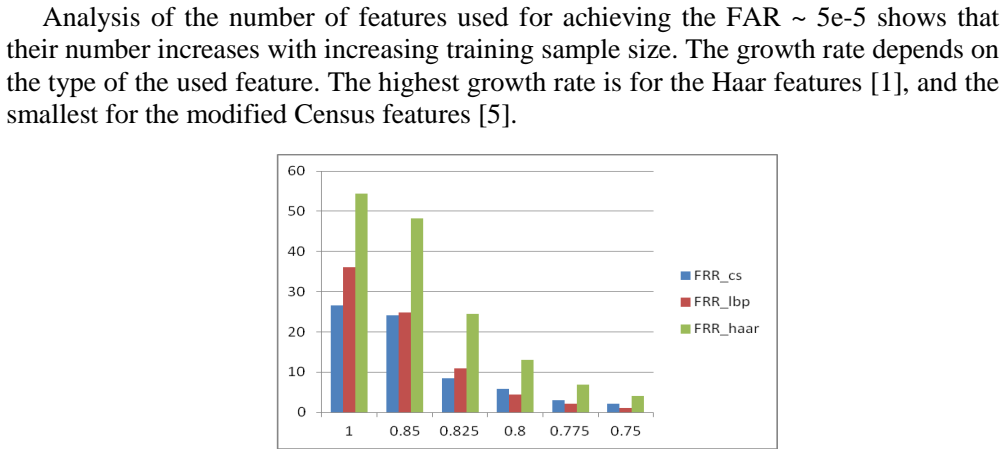
On the paper's own terms, the discovery is a ranking of feature families under one fixed boosted-cascade protocol: the modified Census transform is the most effective feature for forming detectors of railway carriage numbers and digits. Each image fragment is encoded as a 9-bit integer $C \in \{0,\dots,511\}$ by comparing the average brightness of each of nine sub-regions of a rectangle with the rectangle's overall average; this yields a non-local binary pattern. A weak classifier uses the estimated code histograms for signal versus background under a maximum-likelihood rule, and AdaBoost combines them into a strong classifier. Across 198 trained detectors at a false-acceptance rate near $5\times10^{-5}$, Census-based detectors consistently need the fewest features and give the lowest false-rejection rate, while Haar features require the most features and reject the most true objects; the authors conclude that the best overlap of the scanning window with the labeled object lies in $[0.75, 0.8]$.
Load-bearing premise
The load-bearing premise is that the single set of 1139 manually labeled railway-car frames, split once into training and test parts, fairly represents the full range of objects and imaging conditions, so the observed feature ranking is a property of the features rather than of this one dataset.
Editorial extensions
If this is right
- Census-based detectors reach a false-acceptance rate around $5\times10^{-5}$ with the smallest number of weak classifiers among the three feature families.
- For both whole-number detection and digit recognition, Haar features are consistently the weakest, needing the most features and producing the highest false-rejection rate.
- The overlap parameter around $0.75$-$0.8$ is recommended when designing scanning detectors for objects of a given type.
- Digit '1' is an exception where the standard $12\times24$ aperture is too large; the paper implies that a smaller aperture is needed for narrow digits.
- The general recipe is claimed to be universal, applying to faces, vehicles, letters, and other fixed-type objects, not just railway numbers.
Reading between the lines
- Beyond the paper: the same feature-ranking protocol could be run on independent datasets of license plates or text images captured in different conditions; if the Census advantage persists there, the 'universal' claim would be much stronger.
- The paper's conclusions rest on a single annotated dataset split once without cross-validation or confidence intervals, so a reader should treat the feature ranking as provisional until it is reproduced on additional data.
- The 9-bit code space of 512 patterns is small enough that the learned distribution of Census codes for signal versus background could be visualized, offering a principled way to see which patterns the cascade actually relies on.
Signed reviews
Editorial analysis
A structured set of objections, weighed in public.
Referee Report
Summary. The paper proposes a cascade detection scheme, based on the Viola-Jones framework with AdaBoost, for detecting railway carriage numbers and recognizing digits. The main technical ingredient is a modified Census transform that encodes a rectangular image fragment as a 9-bit non-local binary pattern, compared empirically against Haar features and local binary patterns (LBP). The authors construct 11 detector types (one for carriage numbers, ten for digits), evaluate false rejection rates (FRR) and feature counts on a single dataset of 1139 frames split 3:1 into training and test sets, and conclude that the modified Census transform yields the fewest features and the lowest FRR, with the best overlap parameter in [0.75, 0.8], and that the approach is universal for searching objects of a given type.
Significance. If the empirical finding holds, the paper provides a useful data point for practitioners building cascade detectors for character information: a non-local Census-based binary pattern can outperform Haar and LBP features in feature efficiency and FRR on a specific railway carriage dataset. The paper is honest in reporting per-digit results, making public the dataset (ref. [36]), and acknowledging the failure on digit '1'. However, the significance is limited by the single-domain, single-dataset evaluation, the absence of statistical validation, and the lack of comparison with modern deep-learning baselines, which the authors explicitly defer to future work. The strength of the claim 'most effective' and 'universal' exceeds what the evidence supports.
major comments (3)
- [§4.1, Fig. 5, Table 1] The central comparative claim that modified Census (CS) features are the most efficient (fewest weak classifiers, lowest FRR) is based on a single random split of 1139 images into 865 training and 274 test images, with no confidence intervals, cross-validation, or significance tests. With only 274 test frames, the FRR differences between CS and LBP in Fig. 5 could plausibly be sampling noise, and the per-digit FRRs in Table 1 (e.g., 31.13% for '1' vs. 0.66% for '9') have wide binomial uncertainty. The paper should report error bars or at least a significance test for the CS-vs-LBP comparison before claiming that CS is 'most effective'.
- [§5, Conclusions] The conclusion that the modified Census transform is 'most effective for forming the features of objects to be recognized' generalizes beyond the evidence. The experiments cover only railway carriage numbers and digits from one dataset, and the authors themselves note that the result does not hold for digit '1'. The 'universal approach' claim in the abstract and introduction is not supported by experiments on faces, vehicles, or other object classes. This overreach should be removed or explicitly scoped to the tested domain.
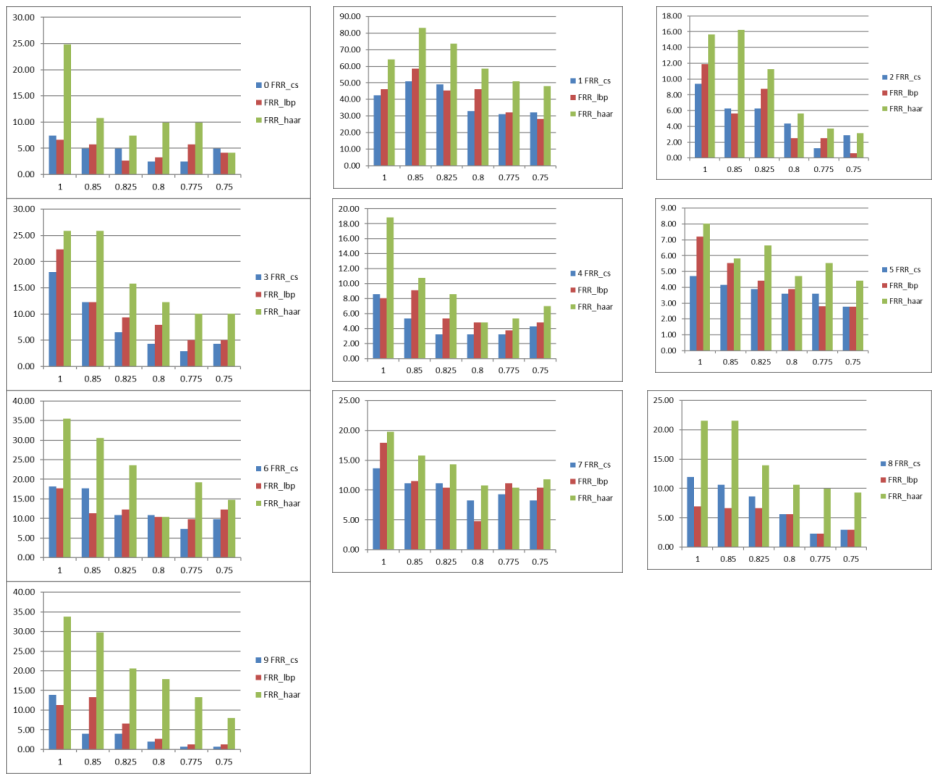
- [§4.2, Table 1] The digit '1' detector has an FRR of 31.13%, which is far above all other digits and would be unacceptable in practice. The paper acknowledges this and suggests a smaller aperture (8x24) as future work, but this exception is load-bearing for the claim that CS features are best for digit recognition: if the most difficult digit is excluded, the conclusion covers only 'the majority of the digits'. The paper should either present results with the corrected aperture for digit '1' or clearly state that the general claim does not apply to all digits.
minor comments (6)
- [Abstract and §5] The phrase 'universal approach' is used repeatedly, but the experiments are limited to a single object domain. This is a presentation issue: replacing 'universal' with 'general-purpose for a given object class' would align the wording with the evidence.
- [§1, References] Several references are incomplete or inconsistently formatted, e.g., ref. [2] gives a journal title without volume/pages, and ref. [8] is listed with an ISBN but no publisher. The authors should verify the reference list against the journal style.
- [§4.1, Eq. (1)-(3)] Equations (1) and (2) are poorly typeset and hard to read due to missing summation limits and garbled indices. Please rewrite these formulas clearly, as they define the core non-local Census code.
- [§4.1, Fig. 5] Fig. 5 is described in the text as showing FRR versus overlap, but the figure contains multiple curves without error bars or point markers. Adding markers and error bars would make the comparison interpretable.
- [§4.2, Fig. 7] The text says 'Fig. 7' shows the FRR for digit detectors, but the figure is not referenced in the main body before the conclusions. Please add an explicit pointer and a short discussion of the per-digit FRR curves.
- [§4.1, Terminology] The paper interchangeably uses 'neural network' for the cascade of AdaBoost strong classifiers (e.g., in §4.1 and Fig. 4). Since the method is not a neural network, this terminology is misleading and should be corrected to 'cascade detector'.
Circularity Check
No circularity: the central claims are empirical comparisons on a held-out test split, with external feature definitions and an external dataset.
full rationale
The paper's central claim—that the modified Census transform yields the fewest features and lowest false rejection rate—is an empirical result obtained by training cascade detectors on 865 frames and evaluating them on a disjoint 274-frame test set (Section 4.1). The features compared (Haar, LBP, modified Census) are defined by external references [1,2,5,6,7], not derived from the target conclusion. The dataset [36] is a collected corpus of railway-car images; its train/test split provides genuinely independent evidence about detector performance. Weak classifiers are built from probability density estimates on the training set only, and the final FRR/FAR values are measured on the test set, so no fitted parameter is renamed as a prediction. The only self-citations are references [28–31], which merely place the work in the authors' research line and carry no load-bearing mathematical or empirical weight. The post-hoc selection of the overlap range [0.75, 0.8] from the same test data is a statistical limitation (lack of error bars and multiple-comparison control), not a circularity: the conclusion is not equivalent to an input by construction. The generalization from railway digits to arbitrary objects is an overstatement given the single domain, but overgeneralization is a correctness/robustness concern, not a circular-derivation concern. The derivation chain is self-contained in the sense that every stated result is supported by a reproducible experiment on held-out data rather than by definition or by the authors' own unverified prior theorems.
Assumptions & free parameters
free parameters (4)
- Overlapping threshold =
[0.75, 0.8] chosen as best from experiments
- Detector aperture size for digits =
12x24 pixels (8x24 suggested for digit 1)
- Strong classifier decision threshold Theta =
learned per detector
- Number of weak classifiers =
varies by feature type and overlap
assumptions (5)
- standard math AdaBoost yields a strong classifier from weak classifiers (refs [3,4]).
- standard math Viola-Jones cascade detection reduces false positives when weak classifiers are arranged in stages (refs [1,2]).
- domain assumption Probability densities of integer codes can be estimated by histograms from a training sample.
- domain assumption The manually labeled railway carriage dataset is representative of real video conditions.
- domain assumption The modified Census transform produces discriminative features for characters.
Cite this review
Pith. "Pith review of Construction of efficient detectors for character information recognition." pith.science (2026). https://pith.science/paper/G2YIFXHK
@misc{pith2026190804634,
  author       = {Pith},
  title        = {Pith review of: Construction of efficient detectors for character information recognition},
  year         = {2026},
  howpublished = {\url{https://pith.science/paper/G2YIFXHK}},
  note         = {Machine review of arXiv:1908.04634}
}
read the original abstract
We have developed and tested in numerical experiments a universal approach to searching objects of a given type in captured video images (for example, people's faces, vehicles, special characters, numbers and letters, etc.). The novelty and versatility of this approach consists in a unique combination of the well-known methods ranging from creating detectors to making decisions independent of the type of recognition objects. The efficiencies of various types of basic features used for image coding, including the Haar features, the LBP features, and the modified Census transformation are compared. A combination of the modified methods is used for constructing 11 types of detectors of the number of railway carriages and for recognizing digits from zero to nine. The efficiency of the constructed detectors is studied.
Figures


Figures from the paper (5 more)



Reference graph
Works this paper leans on
-
[36]
https://github.com/telnykha/trains_dataset/
-
[1]
Rapid object detection using a boosted cascade of simple fe a- tures // IEEE Conf
Viola P., Jones M.J. Rapid object detection using a boosted cascade of simple fe a- tures // IEEE Conf. on Computer V ision and Pattern Recognition. – Kauai, Hawaii, USA – 2001. V. 1. P. 511–518
work page 2001
-
[2]
Viola, P. and Jones, M. Robust Real Time Object Detection, In International Jou r- nal of Computer Vision, 1(2), 2002
work page 2002
-
[3]
Schapire R.E. (2013) Explaining AdaBoost. In: Schölkopf B., Luo Z., Vovk V. (eds) Empirical Inference. Springer, Berlin, Heidelberg
work page 2013
-
[4]
Younghyun Lee, David K. Han, and Hanseok Ko Reinforced AdaBoost Learning for Object Detection with Lo cal Pattern Representations, Scientific World Journal. Sci- entific World Journal. Published online 2013 Nov 28. doi: 10.1155/2013/153465
-
[5]
Froba B., Ernst A. Face Detection with the Modi fied Census Transform // Pr o- ceedings of the Sixth IEEE International Conference on Automatic Face and Ge sture Recognition (FGR’04) 0-7695-2122-3/04. 2004. IEEE
work page 2004
-
[6]
Cheung, Yiu-ming & Deng, Junping. (2014). Ultra local binary pattern for image texture analysis. Proceedings 2014 IEEE International Conference on Security, Pattern Analysis, and Cybernetics, SPAC 2014. 290 -293. 10.1109/SPAC.2014.6982701. Jou r- nal of Network Communications and Emerging Technologies (JNCET) www.jncet.org Volume 7, Issue 5, May (2017) IS...
-
[7]
Xie Liping, W. H. (July 2014). Video-based Facial Expression Recognition Using Histogram Sequence of Local Gabor Binary Patterns from Three Orthogonal Planes. Proceedings of the 33rd Chinese Control Conference. Nanjing, China
work page 2014
Show all 23 references
-
[8]
Video analytics: Myths and reality // Security Focus
Torsten A., Ivo K., Harald L. Video analytics: Myths and reality // Security Focus
-
[9]
Principles of pattern recognition
Tu, D., Gonzalez R. Principles of pattern recognition. // M .: Tekhnosfera, 2012, ISBN: 978-5-94836-331-8. In Rusian. 10.Fukushima Kunihiko Neocognitron: A Self -organizing Neural Network Model for a Mechanism of Pattern Recognition Unaffected by Shift in Position. // Biolog i...
2012
-
[18]
Optical character recognition: a review
Singh AK, Gupta A, Saxena A. Optical character recognition: a review. // Journal of Emerging Technolo gies and Innovative Research (JETIR) www.jetir.org 2016;3(4):142-146. 19.Mamta Kadyan A Review on Character Recognition Using OCR Algorithm // Journal of Network Communication...
2017
-
[20]
Ankit Lat, C. V. Jawahar : Enhancing OCR Accuracy with Super Resol u- tion. ICPR 2018: 3162-3167
2018
-
[21]
Chao Dong, Ximei Zhu, Yubin Deng, Chen Change Loy, and Yu Qiao Member, Boosting Optical Character Recognition: A Super -Resolution Approach, ICDAR 2015 COMPETITION ON TEXT IMAGE SUPER-RESOLUTION
2015
-
[22]
Beketov, S.L.Karateev, Yu.V.Vizilter
I.V. Beketov, S.L.Karateev, Yu.V.Vizilter. Algorithm for automatic d etection of license plate images of railway rolling stock based on adaptive boosting methods // Pr o- ceedings of the GraphiCon’2013 conference. Vladivostok. September 16 -20, 2013. Pp.219-221. In Russian
2013
-
[23]
LeNet -5, convolutional neural networks
LeCun, Yann. "LeNet -5, convolutional neural networks ". – http://yann.lecun.com/exdb/lenet/ 24.Xie L., Ahmad T., Jin L., Zang S. A new CNN Based method for multi - directional car licence plate detection /IEEE Trans. Intell. Transp. Syst 19, p.507 -517 (2018)
2018
-
[25]
Ortiz License Plate Detection and Recognition Using Deeply Learned Convolutional Neural Networks https://arxiv.org/abs/1703.07330 (2017) 26.Scott Gray, Alec Radford and Diederik P
Syed Zain Masood , Guang Shu , Afshin Dehghan , Enrique G. Ortiz License Plate Detection and Recognition Using Deeply Learned Convolutional Neural Networks https://arxiv.org/abs/1703.07330 (2017) 26.Scott Gray, Alec Radford and Diederik P. Kingma GPU Ke rnels for Block - Spars...
2017 arXiv
-
[29]
and Yakhno V
Bellustin N., Kalafati Y., Kovalchuck A., Telnykh A., Shemagina O., Sharma P., Vaish A., Verma S. and Yakhno V. Instant Human Face Attributes Recogn ition System 14 // International Journal of Advanced Computer Science and Applications (IJACSA ). Special Issue on Artificial In...
2011
-
[30]
image s for adults
N.S, Bellustin, Yu.D., Kalafati, A.A., Telnykh, O.V. Shemagina. Application of algorithms for adaptive segmentation and semantic description of images in the problem of recognition of “image s for adults” // Information -measuring and control systems
-
[31]
N. S. Belliustin, Yu. D. Kalafati, A. A. Telnykh, and O. V. Shemagina Neuron Like Algorithms of Adaptive Segmentation and Semantic Descri ption of Images in the ―Adult Image Recognition Problem // Optical Memory and Neural Networks (Info r- mation Optics). 2014. V. 23 (1). P. ...
2014
-
[34]
Microcolumns in the cerebral cortex
Jones E.G. Microcolumns in the cerebral cortex. // Proc. Natl. Acad. Sci. U. S. A. UNITED STATES, 2000. Vol. 97, № 10. P. 5019–5021
2000
-
[35]
http://caffe.berkeleyvision.org
-
[2013]
Vol.11 No. 7. Pp. 37 - 42. In Russian
-
[2019]
P. 186. ISBN: 978-5-9901176-5-5. In Rusian
Reviewed August 14, 2026 · model on record in the stance chip above.
Discussion (0). Continue with ORCID to comment.