REVIEW 3 major objections 5 minor 30 references
The role of cue enhancement and frequency fine-tuning in hearing impaired phone recognition
T0 review · 3 major / 5 minor · reviewed 2026-08-14 · deepseek-v4-flash
Pith's one-line read A token-specific noise-robustness measure, SNR90, can identify which consonant cues to amplify or frequency-shift for each hearing-impaired ear, improving recognition for 92% of tokens when the cue is enhanced.
desk verdict Small-sample but genuinely novel SNR90-based test separates cue enhancement from vowel fine-tuning in HI consonant recognition; the qualitative direction is credible, but the abstract/text inconsistency and the NH-to-HI transfer assumption keep the quantitative claims provisional. read the letter →
The pith
A machine-rendered reading of the paper's core claim, the machinery that carries it, and where it could break.
The reading
What carries the argument
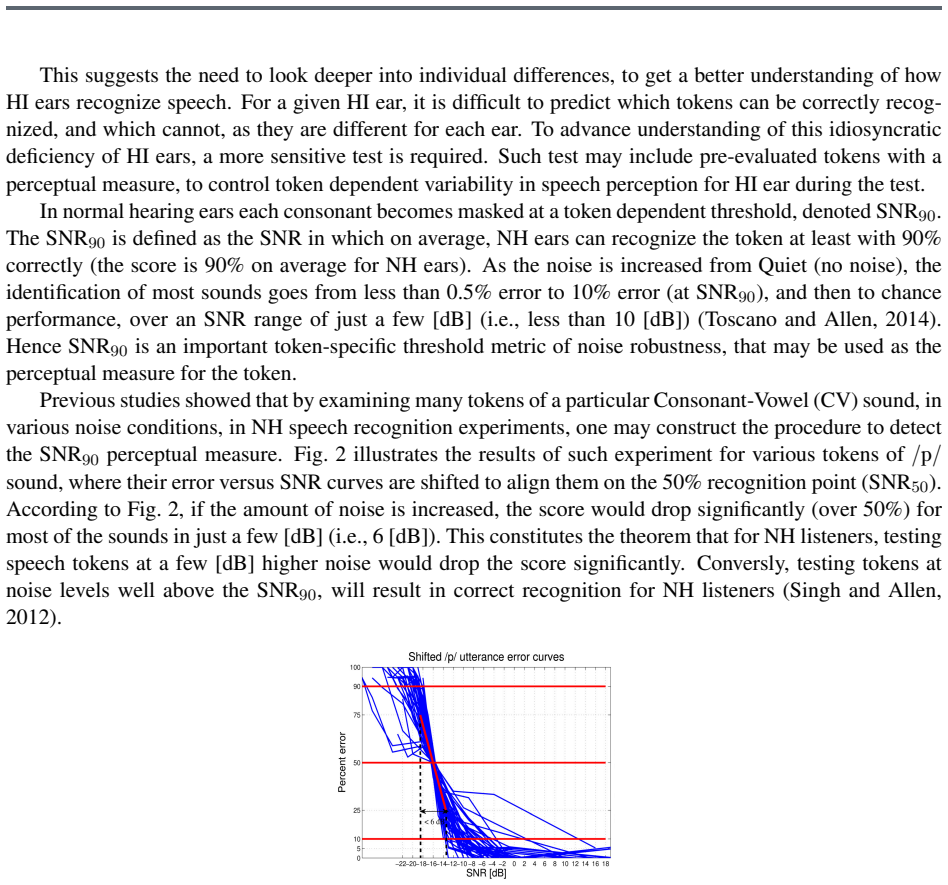
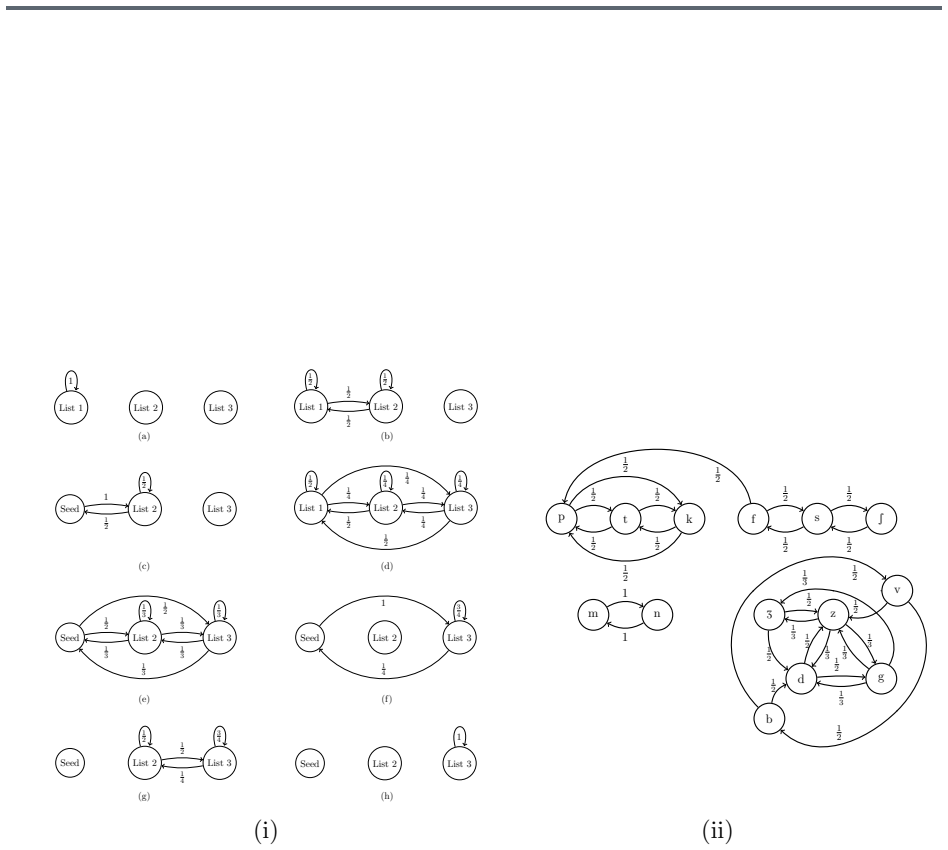
The central object is the SNR90 perceptual measure, defined as the signal-to-speech-weighted-noise ratio at which a normal-hearing listener recognizes a token with at least 90% accuracy on average. It does two jobs: it selects noise-robust tokens (error below 10% at SNR = -2 dB) for the hearing test, and it defines equivalence classes of tokens so that swapping talkers or vowels holds the approximate intensity of the primary cue constant. The adaptive List 1 to List 2 to List 3 procedure then identifies which tokens are error-prone for a particular HI ear and tests alternatives against them.
What would settle it
Directly measure SNR90 in hearing-impaired ears for the same tokens, or compare HI error rates across tokens matched by NH SNR90: if tokens with equal NH SNR90 produce significantly different HI recognition when presented at the same level above threshold, the transfer assumption fails and the reported vowel-change improvements would be attributable to uncontrolled token difficulty rather than frequency fine-tuning.
Extended reading notes
Core claim
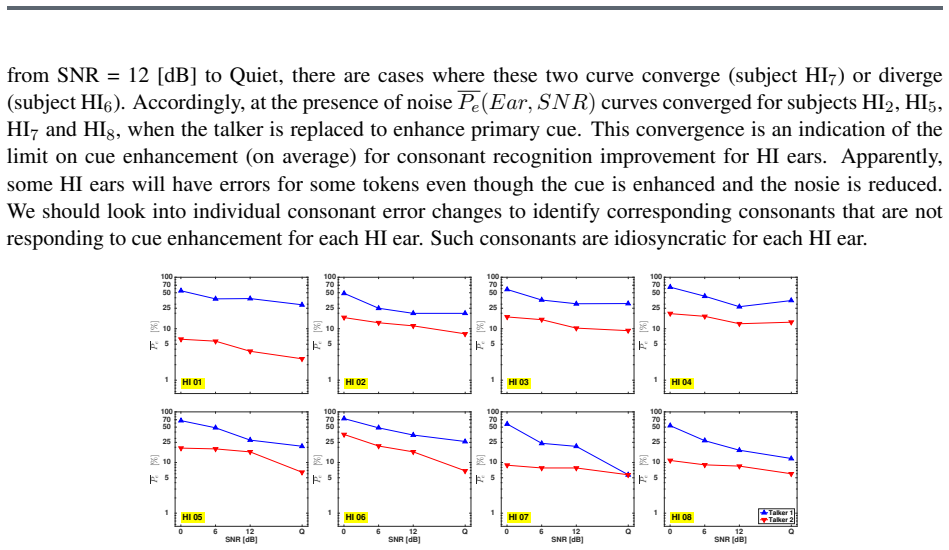
The paper's claim is that SNR90, the signal-to-speech-weighted-noise ratio at which normal-hearing listeners recognize a token with 90% accuracy on average, is a valid perceptual measure of the salience of the primary cue in a consonant-vowel token, and that it can be used to control token difficulty while testing hearing-impaired ears. In an adaptive experiment, error-prone tokens identified for each HI ear were replaced either by the same CV from a talker with a lower SNR90 (more salient) or by a token with the same consonant, a different vowel, and a similar SNR90. On average, the more salient talker improved recognition for 92% of tokens, including cases where the error vanished; among tokens that remained errorful in both conditions, 85% improved and 10% degraded. Vowel changes matched in SNR90 improved recognition for 63 to 75 percent of tokens depending on the vowel. The authors conclude that HI ears use the same primary cues as NH ears, and that individual confusion patterns, interpreted alongside the audiogram, can identify when amplification should be applied and whether the frequency content of the cue should be shifted.
Load-bearing premise
The paper assumes that a token's SNR90 measured in normal-hearing listeners carries over to hearing-impaired ears as a measure of the salience of the primary cue, so that matching tokens on NH SNR90 actually controls cue intensity for HI listeners.
Editorial extensions
If this is right
- Hearing aid fitting could move from a universal gain prescription to a token-specific test that first finds the consonants each ear mishears.
- Enhancing the primary cue by selecting a more salient talker should reduce consonant errors for most tokens in most HI ears, with degradation concentrated in ears that also have low-frequency hearing loss.
- Vowel changes matched in SNR90 offer a way to shift the frequency content of the primary cue without changing its overall salience, improving most tokens though less consistently than talker enhancement.
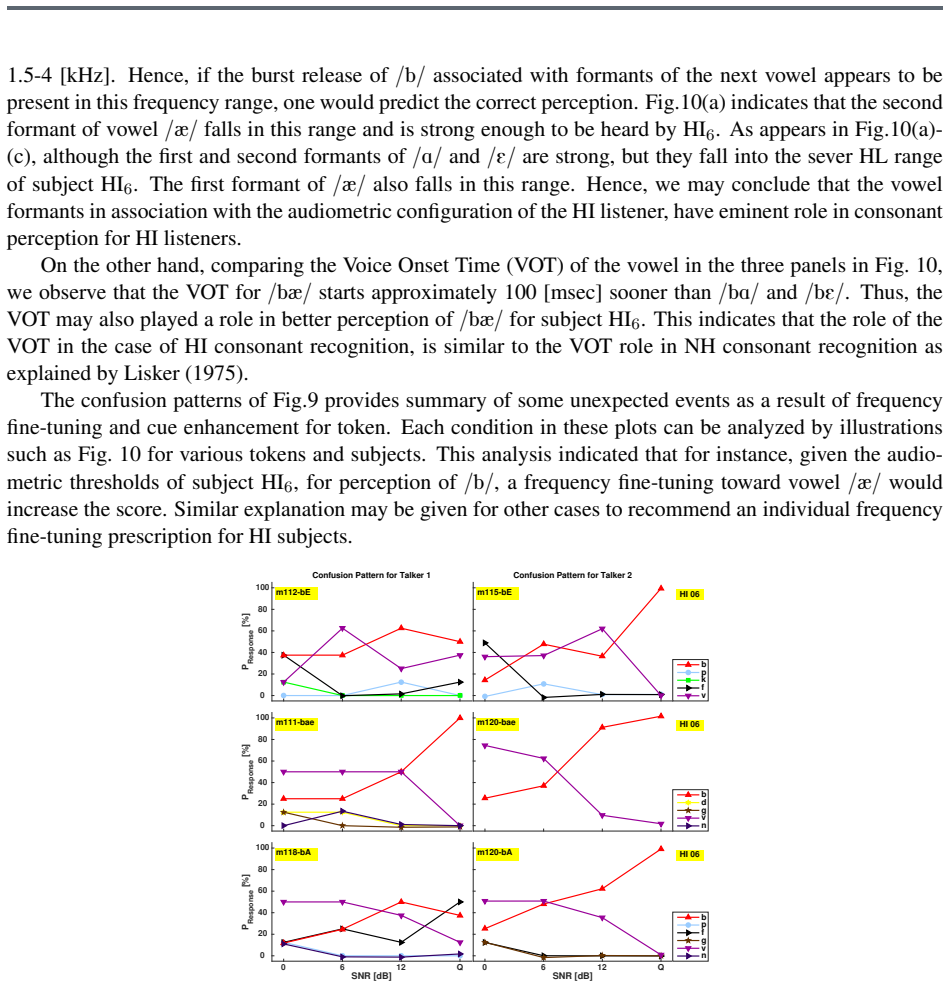
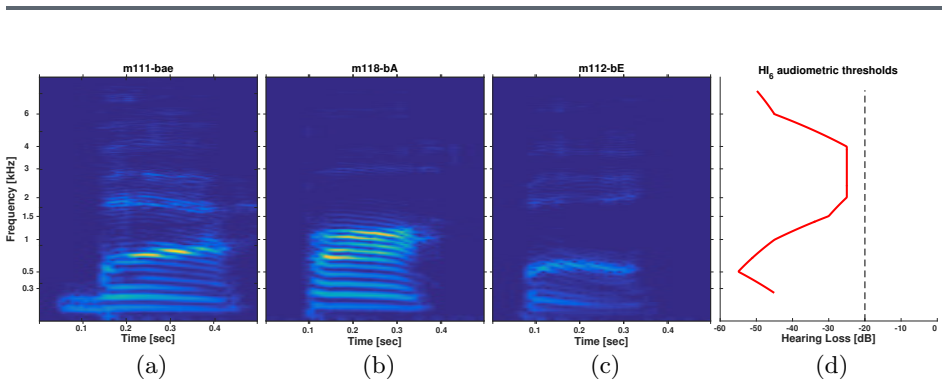
- Per-token confusion patterns can point to the acoustic feature, such as burst strength, voice onset time, or formant location, that needs amplification for a given ear.
- The minority of tokens that degrade under cue enhancement or vowel change implies that these interventions should be evaluated per ear rather than assumed beneficial for everyone.
Reading between the lines
- If NH SNR90 transfers to HI ears, the same token bank could be reused as a standardized perceptual probe, mapping each ear's confusion patterns to a personalized gain or filter recommendation without collecting HI-specific SNR90 curves.
- A natural extension not performed in this paper would be to measure SNR90 directly in hearing-impaired ears and compare it to the NH values; if they correlate, SNR90 could be estimated from the audiogram, making the test practical for clinicians.
- The frequency fine-tuning results suggest a testable prediction: for a consonant whose primary cue lies in a high-frequency band, shifting the coarticulated vowel to move burst and formant energy into a region of residual hearing should improve recognition more than flat amplification.
- The 92% improvement rate under talker replacement might partly reflect talker clarity differences beyond primary-cue salience, such as speaking rate or vocal effort; an experiment controlling for duration and vocal effort would separate those mechanisms.
Signed reviews
Editorial analysis
A structured set of objections, weighed in public.
Referee Report
Summary. The paper proposes a speech-based hearing test that uses a normal-hearing (NH) perceptual measure, SNR90, to select noise-robust tokens and to identify error-prone phones for individual hearing-impaired (HI) ears. In two experiments, the authors study (1) cue enhancement, where a CV token is replaced by the same CV spoken by a talker with a lower (more salient) SNR90, and (2) frequency fine-tuning, where the consonant is kept fixed and the vowel is changed to another vowel matched in SNR90. The reported results are that cue enhancement improves recognition on average (92% in the abstract, 85% in the text), while vowel changes improve 63–75% of tokens depending on the vowel. The authors propose using confusion patterns, cue-enhancement responses, and fine-tuning responses to tailor hearing aid amplification to individual ears.
Significance. If the SNR90-based approach works, it would provide a principled, token-specific alternative to broad audibility-based hearing aid fitting, with the potential to explain idiosyncratic HI consonant confusions. The paper's strengths include its fine-grained token-level analysis rather than class-averaged errors, the use of an external NH benchmark (SNR90) as a control variable, and a detailed case study (HI6) linking spectrotemporal token properties to audiometric configuration. However, the significance is substantially limited by the small sample (8 ears from 6 subjects), the lack of any statistical inference, and an internal inconsistency in the headline improvement rate. The central idea is promising, but the current evidence is preliminary and the quantitative claims are not yet reliable.
major comments (3)
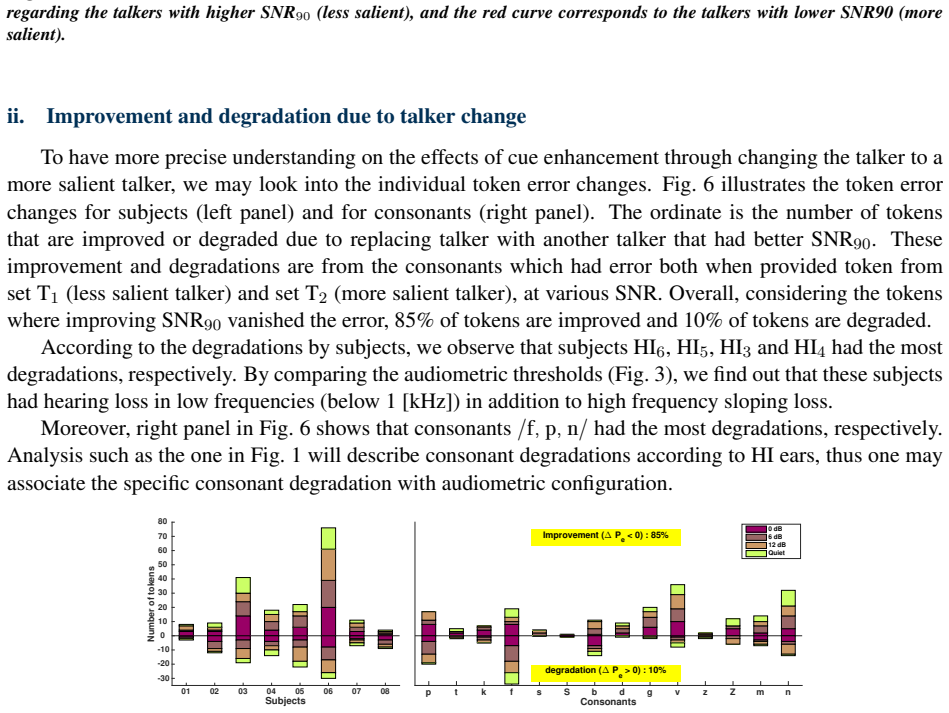
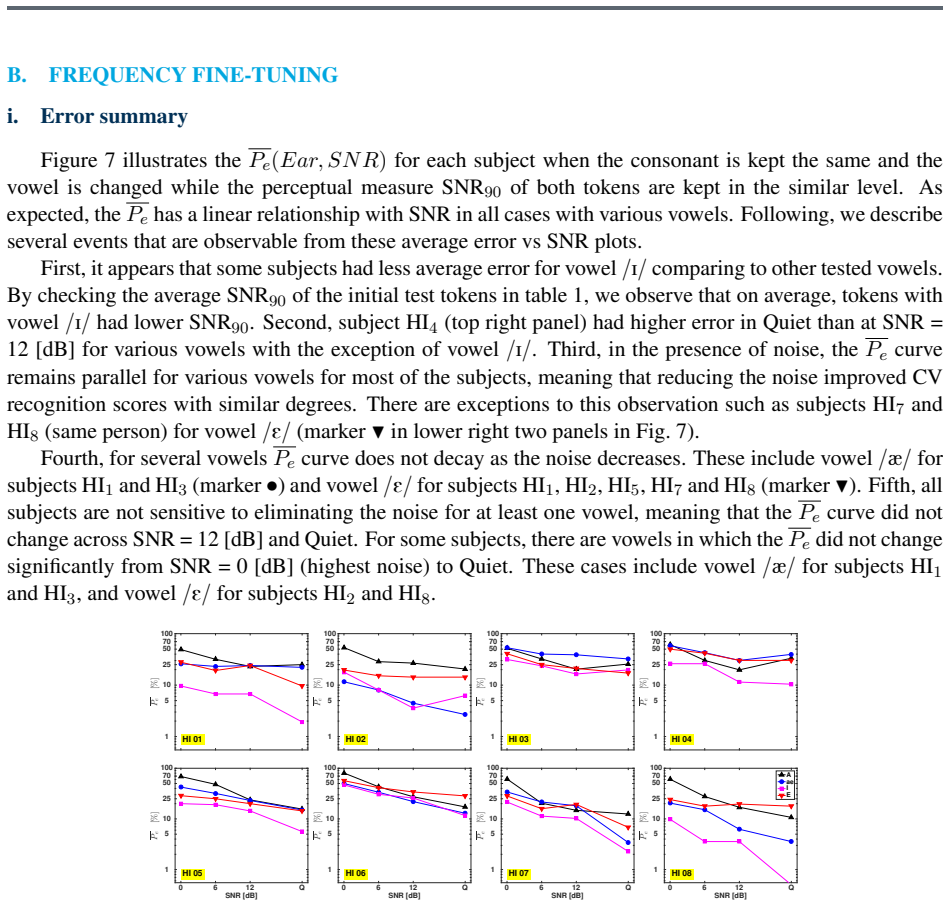
- [Abstract and §3.A.ii (Fig. 6)] The abstract states that 'On average, 92% of tokens are improved when we replaced the CV with the same CV but with a more robust talker,' but the Results section reports that '85% of tokens are improved and 10% of tokens are degraded' and no 92% figure appears anywhere in the text. This is a direct internal inconsistency in the paper's primary quantitative claim. The reader cannot tell which number is correct, and the discrepancy between an 85% improvement rate and a 92% improvement rate (with an unexplained 10% degradation) is large enough to affect the interpretation of the cue-enhancement result.
- [Methods II.A and Discussion (Figs. 9–10)] The frequency fine-tuning experiment matches tokens on SNR90 values estimated from 30 NH listeners (Methods II.A, Table 1), but the paper's own Discussion shows that this matching does not control cue salience in HI ears. For subject HI6, /bae/ is recognized far better than /bA/ and /bE/ despite comparable SNR90, and the authors attribute this to the placement of burst energy and vowel formants relative to HI6's audiogram (Figs. 9–10). That is precisely an audiogram-dependent, HI-specific effect that SNR90 matching does not capture. Therefore the improvements attributed to vowel change in Table 1 may reflect uncontrolled token audibility or difficulty in the HI ear rather than a frequency fine-tuning effect. To support the central claim, the authors need to directly test whether NH-derived SNR90 transfers to HI ears (e.g., by measuring HI recognition at SNRs around the putative SNR90 or by demonstrating that matched tokens produce matched errors in HI ears) or, failing that, substantially weaken the claims about frequency fine-tuning.
- [Methods II.D and Table 1] All quantitative claims in §3 (the 85%/10% improvement/degradation rates, the 63–75% vowel-change improvements, and the subject/consonant differences in Fig. 8) are reported as raw token counts with no confidence intervals, standard errors, or significance tests. With only 8 ears, a response-repeat option, and an adaptive selection procedure that determines which tokens reach List 3, the sampling variability is considerable. For example, a claim that '75% of tokens are improved' based on a small number of errorful tokens per ear could easily arise from chance. The manuscript should include per-subject and per-token error bars, a statement of how many tokens contributed to each percentage, and a statistical test (e.g., sign test or mixed-effects model) for the improvement rates. Without this, the numerical improvement percentages are not interpretable.
minor comments (5)
- [Fig. 6] The caption of Fig. 6 is incomplete: it reads only 'Figure 6: .' and should describe the left and right panels and the meaning of the bars.
- [Introduction, after Fig. 2] There is a typo: 'Conversly' should be 'Conversely'.
- [§3.A.i] There is a typo: 'when the nosie decreases' should be 'when the noise decreases.'
- [Table 1] The header 'Changed V owel' has a spacing typo; it should read 'Changed Vowel.'
- [Fig. 8 and Table 1] The figure caption states that cases where the vowel change vanished the error are not shown, but Table 1 appears to include such cases in the improvement percentages. Please clarify whether the Table 1 percentages count only error-reducing changes or also error-vanishing changes, and make the definitions consistent between text, table, and figure.
Circularity Check
No material circularity; the SNR90 control is an externally measured NH benchmark, and HI outcomes are independent of the fitted threshold values.
full rationale
The paper is an empirical study rather than a derivation. The claimed improvements are measured HI recognition errors, while the control variable SNR90 is taken from prior NH listening data (e.g., Li et al. 2010) and is not fitted to any HI response. The cue-enhancement comparison selects tokens by SNR90 differences of at least 6 dB, but the reported 92% improvement is an observed outcome on HI ears, not a quantity recomputed from SNR90. The vowel-change experiment matches tokens on NH SNR90 and then compares HI errors; matching on an independent benchmark does not define the HI outcome, so the 75/71/63/72% improvement rates are not forced by construction. Citations to Abavisani and Allen (2017) and related prior work supply experimental design and background support; they do not act as an imported uniqueness theorem or as a fitted parameter renamed as a prediction. The concern that NH SNR90 may not transfer to HI ears (e.g., subject HI6's /b/ tokens) is a validity or external-criterion question, not circularity, because the paper's equations do not equate the predicted outcome to the input. No load-bearing step reduces to its own inputs.
Assumptions & free parameters
free parameters (2)
- SNR90 separation threshold between sets T1 and T2 =
>= 6 dB
- Noise-robustness inclusion threshold for tokens =
SNR90 below -2 dB and less than 10% error at SNR=-2 dB
assumptions (3)
- domain assumption SNR90 measured in normal-hearing listeners transfers to hearing-impaired ears as a measure of primary cue salience.
- domain assumption Tokens selected as noise-robust are representative of the cues needed for consonant recognition, and errors for HI ears at high SNR reflect individual audiometric deficits rather than token difficulty.
- domain assumption No systematic learning or order effects in the adaptive multi-list procedure that would inflate improvement rates.
Cite this review
Pith. "Pith review of The role of cue enhancement and frequency fine-tuning in hearing impaired phone recognition." pith.science (2026). https://pith.science/paper/HHFAFMCS
@misc{pith2026190804751,
  author       = {Pith},
  title        = {Pith review of: The role of cue enhancement and frequency fine-tuning in hearing impaired phone recognition},
  year         = {2026},
  howpublished = {\url{https://pith.science/paper/HHFAFMCS}},
  note         = {Machine review of arXiv:1908.04751}
}
read the original abstract
A speech-based hearing test is designed to identify the susceptible error-prone phones for individual hearing impaired (HI) ear. Only robust tokens in the experiment noise levels had been chosen for the test. The noise-robustness of tokens is measured as SNR90 of the token, which is the signal to the speech-weighted noise ratio where a normal hearing (NH) listener would recognize the token with an accuracy of 90% on average. Two sets of tokens T1 and T2 having the same consonant-vowels but different talkers with distinct SNR90 had been presented with flat gain at listeners' most comfortable level. We studied the effects of frequency fine-tuning of the primary cue by presenting tokens of the same consonant but different vowels with similar SNR90. Additionally, we investigated the role of changing the intensity of primary cue in HI phone recognition, by presenting tokens from both sets T1 and T2. On average, 92% of tokens are improved when we replaced the CV with the same CV but with a more robust talker. Additionally, using CVs with similar SNR90, on average, tokens are improved by 75%, 71%, 63%, and 72%, when we replaced vowels /A, ae, I, E/, respectively. The confusion pattern in each case provides insight into how these changes affect the phone recognition in each HI ear. We propose to prescribe hearing aid amplification tailored to individual HI ears, based on the confusion pattern, the response from cue enhancement, and the response from frequency fine-tuning of the cue.
Figures


Figures from the paper (7 more)

Reference graph
Works this paper leans on
-
[1]
Abavisani, A. and Allen, J. B. (2017). Evaluating hearing aid amplification using idiosyncratic consonant errors. J. Acoust. Soc. Am. , 142(6):3736-3745
work page 2017
-
[2]
Allen, J. B. (2005). Articulation and Intelligibility . Morgan and Claypool, 3401 Buckskin Trail, LaPorte, CO 80535. ISBN : 1598290088, 136 pages
work page 2005
-
[3]
Blumstein, S. E., and Stevens, K. N. (1979). Acoustic invariance in speech production: Evidence from measurements of the spectral characteristics of stop consonants. J. Acoust. Soc. Am. , 66(4), 1001-1017
work page 1979
-
[4]
Cole, C. L. (2017). On the effects of masking of perceptual cues in hearing-impaired ears . PhD thesis, University of Illinois at Urbana-Champaign
work page 2017
-
[5]
Delattre, P. C., Liberman, A. M., and Cooper, F. S. (1955). Acoustic loci and transitional cues for consonants. J. Acoust. Soc. Am. , 27(4), 769-773
work page 1955
-
[6]
Dillon, H. (2001). Hearing Aids . Thieme, 333 7th Avenue, NY: 239-242
work page 2001
-
[7]
Fousek, P., Svojanovsky, P., Grezl, F., and Hermansky, H. (2004). New nonsense syllables database -- analyses and preliminary ASR experiments. In Proceedings of International Conference on Spoken-Language Processing (ICSLP) : 2749-2752
work page 2004
-
[8]
Ganong, W. F. (1980). Phonetic categorization in auditory word perception. Journal of experimental psychology: Human perception and performance , 6(1), 110
work page 1980
Show all 30 references
-
[9]
A., Clark, M
Hillenbrand, J., Getty, L. A., Clark, M. J., and Wheeler, K. (1995). Acoustic Characteristics of American English vowels. J. Acoust. Soc. Am. , 97(5):3099--3111
1995
-
[10]
and Allen, J
Kapoor, A. and Allen, J. B. (2012). Perceptual effects of plosive feature modification. J. Acoust. Soc. Am. , 131(1):478--491
2012
-
[11]
Lee, B., and Hasegawa-Johnson, M. (2007). Minimum mean squared error a posteriori estimation of high variance vehicular noise. Biennial on DSP for In-Vehicle and Mobile Systems , Chicago
2007
-
[12]
Li, F., Menon, A., and Allen, J. B. (2010). A psychoacoustic method to find the perceptual cues of stop consonants in natural speech. J. Acoust. Soc. Am. , 127(4):2599--2610
2010
-
[13]
and Allen, J
Li, F. and Allen, J. B. (2011). Manipulation of Consonants in Natural Speech. IEEE Transactions on Audio, Speech, and Language Processing , 19(3):496--504
2011
-
[14]
Lisker, L. (1975). Is it VOT or a first formant transition detector?. J. Acoust. Soc. Am. , 57(6), 1547-1551
1975
-
[15]
Miller, G. A. and Nicely, P. E. (1955). An analysis of perceptual confusions among some E nglish consonants. J. Acoust. Soc. Am. , 27(2):338--352
1955
-
[16]
Ohman, S. E. (1966). Coarticulation in VCV utterances: Spectrographic measurements. J. Acoust. Soc. Am. , 39(1), 151-168
1966
-
[17]
D., Nimmo Smith, I., Weber, D
Patterson, R. D., Nimmo Smith, I., Weber, D. L., and Milroy, R. (1982). The deterioration of hearing with age: Frequency selectivity, the critical ratio, the audiogram, and speech threshold. J. Acoust. Soc. Am. , 72(6), 1788-1803
1982
-
[18]
and Allen, J
Phatak, S. and Allen, J. B. (2007). Consonant and vowel confusions in speech-weighted noise. J. Acoust. Soc. Am. , 121(4):2312--26
2007
-
[19]
Plomp, R. (1986). A signal-to-noise ratio model for the speech-reception threshold of the hearing impaired. Journal of Speech, Language, and Hearing Research , 29(2):146--154
1986
-
[20]
and Mimpen, A
Plomp, R. and Mimpen, A. M. (1979). Speech reception threshold for sentences as a function of age and noise level. J. Acoust. Soc. Am. , 66(5):1333--1342
1979
-
[21]
R\'egnier, M. S. and Allen, J. B. (2008). A method to identify noise-robust perceptual features: application for consonant /t/. J. Acoust. Soc. Am. , 123(5):2801--2814
2008
-
[22]
and Allen, J
Singh, R. and Allen, J. B. (2012). The influence of stop consonants ' perceptual features on the A rticulation I ndex model. J. Acoust. Soc. Am. , 131(4):3051--3068
2012
-
[23]
Steinberg, J. C. and Gardner, M. B. (1940). On the auditory significance of the term hearing loss. J. Acoust. Soc. Am. , 11(3):270--277
1940
-
[24]
M., McCaffrey, H
Sussman, H. M., McCaffrey, H. A., and Matthews, S. A. (1991). An investigation of locus equations as a source of relational invariance for stop place categorization. J. Acoust. Soc. Am. , 90(3), 1309-1325
1991
-
[25]
and Allen, J
Toscano, J. and Allen, J. B. (2014). Across and within consonant errors for isolated syllables in noise. Jol. of Speech, Language, and Hearing Research , 57(DOI: 10.1044/2014\_JSLHR-H-13-0244):2293--2307
2014 doi
-
[26]
and Allen, J
Trevino, A. and Allen, J. B. (2013a). Individual variability of hearing impaired consonant perception. Seminars in Hearing, Guest Editor: Jason Gaalster, PhD , 34(2):74--85
2013
-
[27]
and Allen, J
Trevino, A. and Allen, J. B. (2013b). Within-consonant perceptual differences in the hearing impaired ear. J. Acoust. Soc. Am. , 134(1):607--617
2013
-
[28]
E., and Reeds, J
Winitz, H., Scheib, M. E., and Reeds, J. A. (1972). Identification of stops and vowels for the burst portion of /p,t,k/ isolated from conversational speech. J. Acoust. Soc. Am. , 51(4B), 1309-1317
1972
-
[29]
Yoon, Y., Allen, J., and Gooler, D. (2012). Relationship between consonant recognition in noise and hearing threshold. J. Speech, Language, and Hearing Research, , doi: 10.1044/1092-4388(2011/10-0239):460--473
2012 doi
-
[30]
Zurek, P. M. and Delhorne, L. A. (1987). Consonant reception in noise by listeners with mild and moderate sensorineural hearing impairment. J. Acoust. Soc. Am. , 82(5):1548--1559
1987
Reviewed August 14, 2026 · model on record in the stance chip above.
Discussion (0). Continue with ORCID to comment.